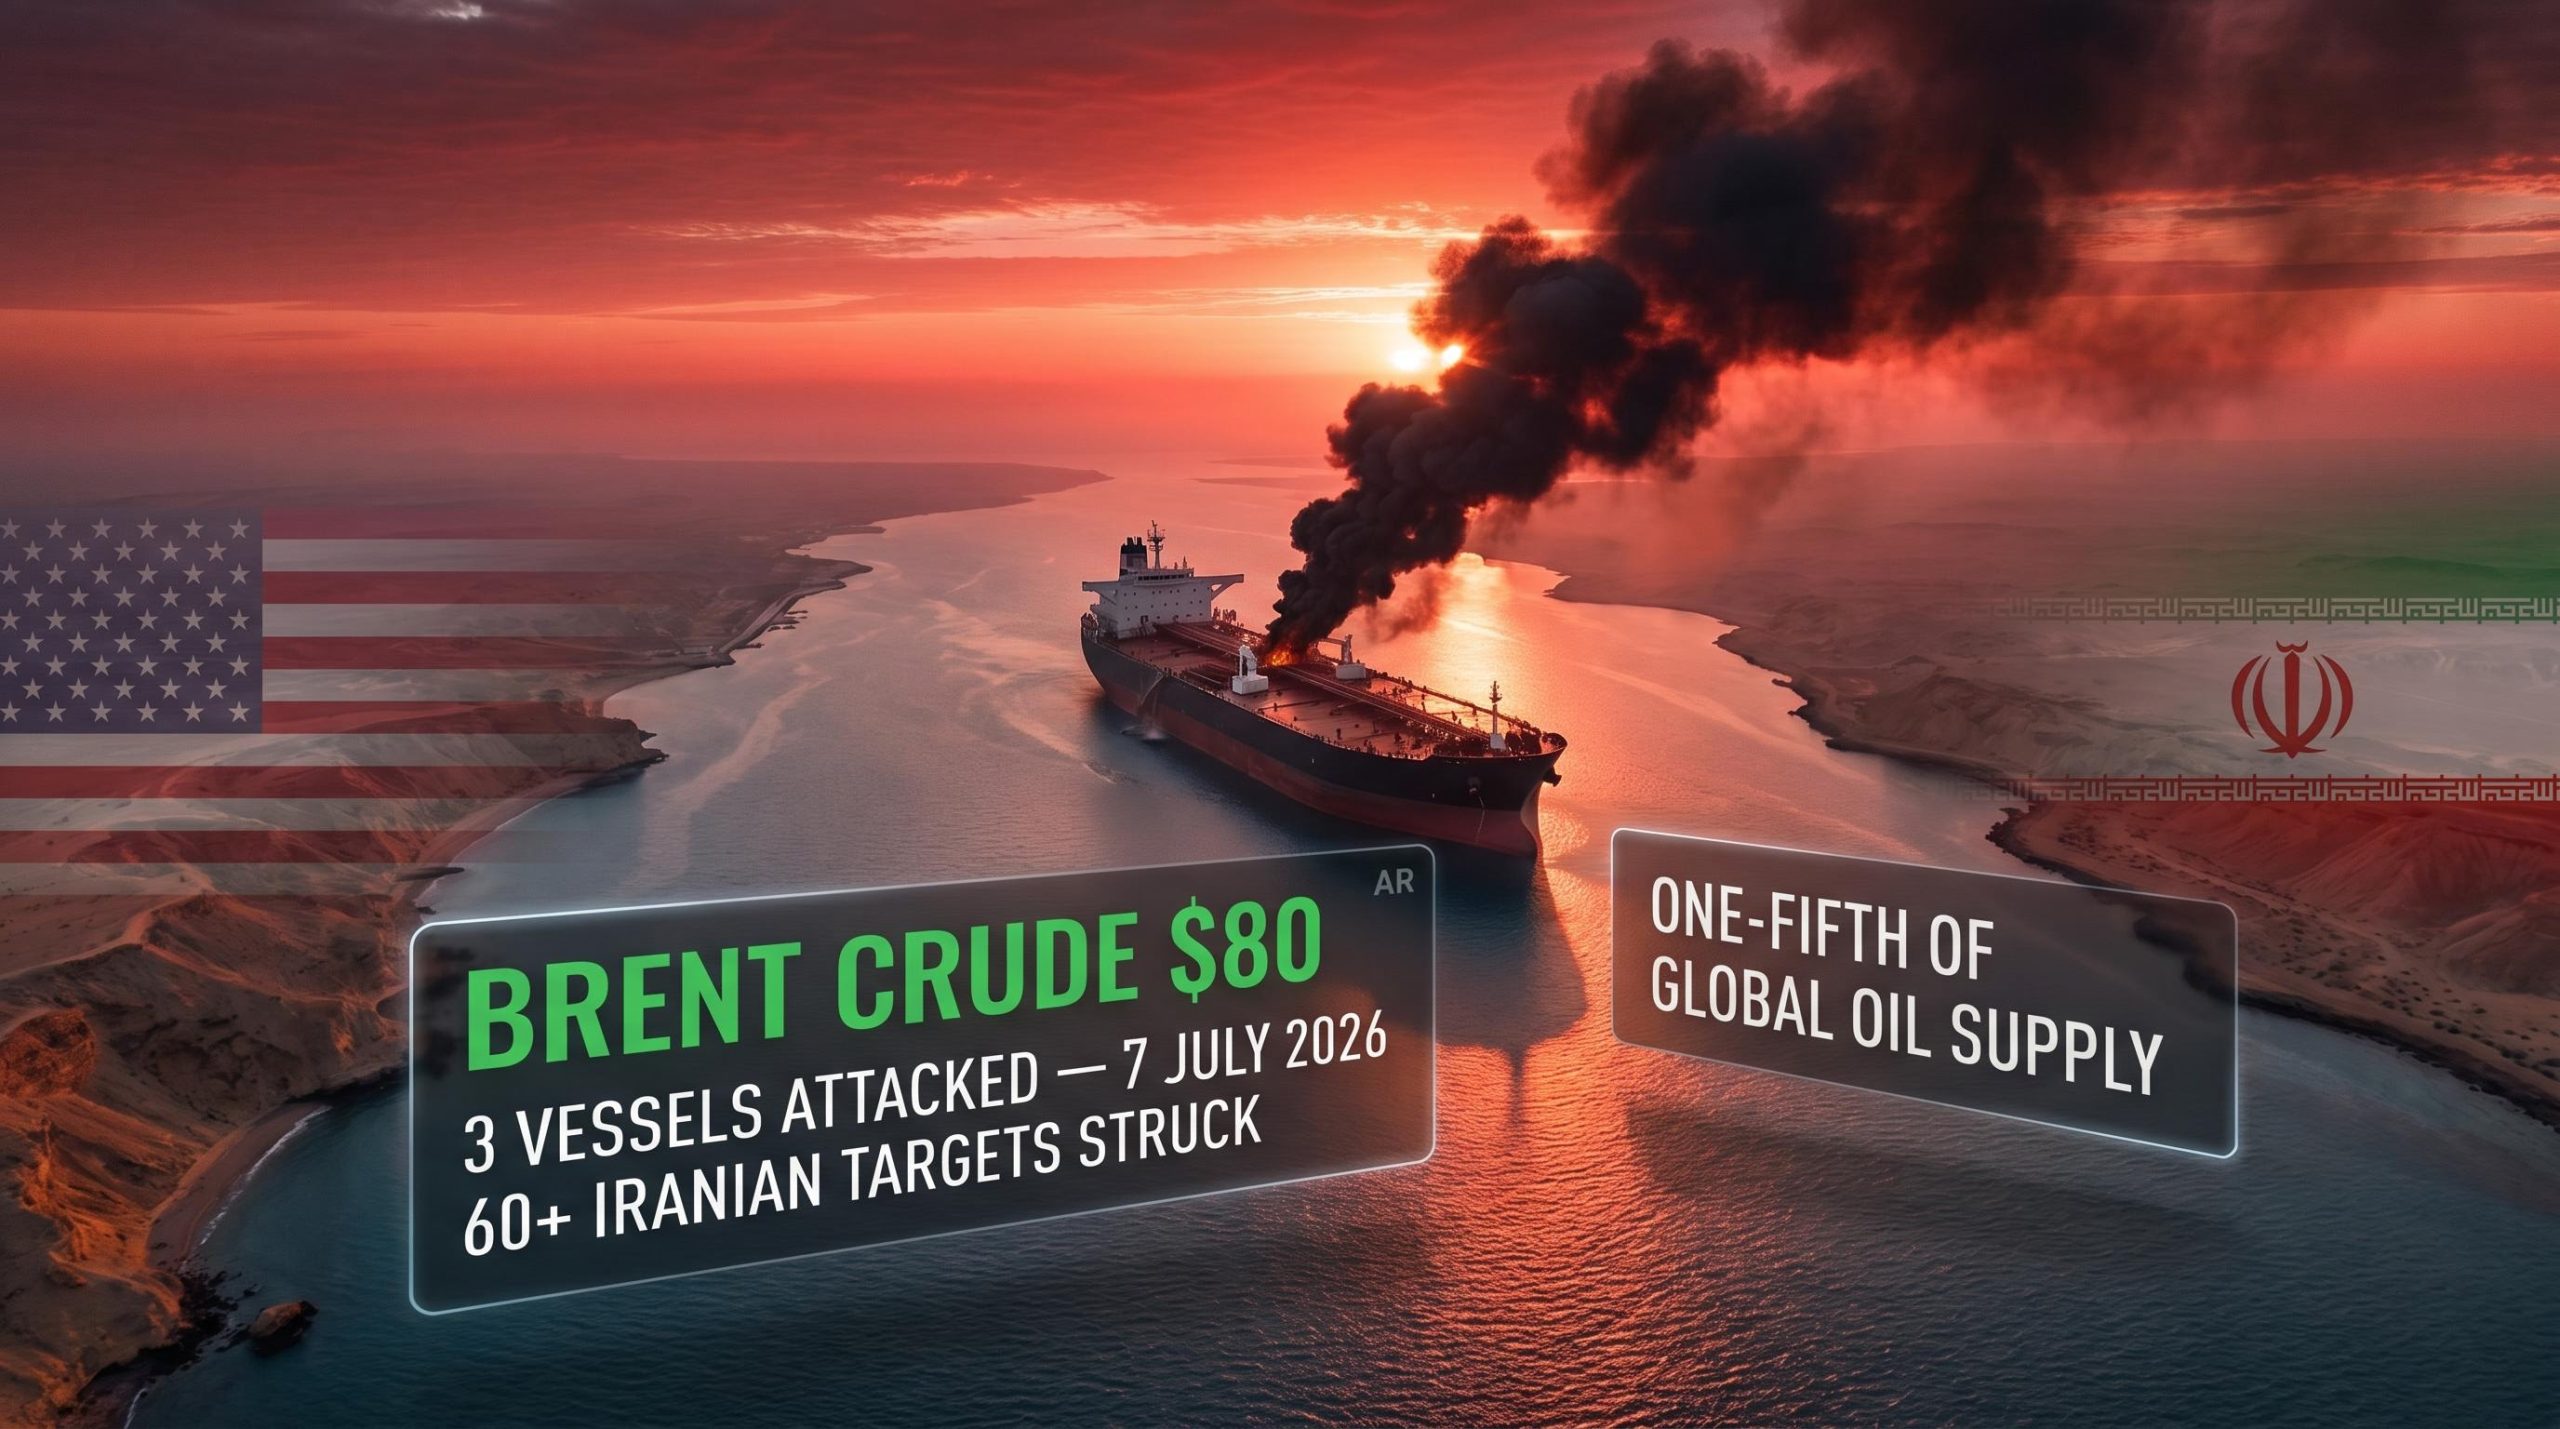
Three commercial vessels came under attack in and around the Strait of Hormuz on 7 July 2026. The United States struck more than 60 Iranian military targets in retaliation. By 8 July, Brent crude had pushed above $80 per barrel, a level not seen in more than two weeks.
The ceasefire that had briefly allowed limited Iranian oil exports and calmed energy markets is gone. It lasted weeks, not months. The Strait of Hormuz, through which roughly one-fifth of globally traded oil flows, is an active conflict zone again, and the supply-risk channel that central banks and energy traders had just begun to set aside has reopened.
The physical, financial, and monetary consequences of this escalation are moving simultaneously and in the same direction. Here is what the collapse of the ceasefire actually means for oil prices, inflation, and the Fed’s next move.
The ceasefire that lasted weeks, not months
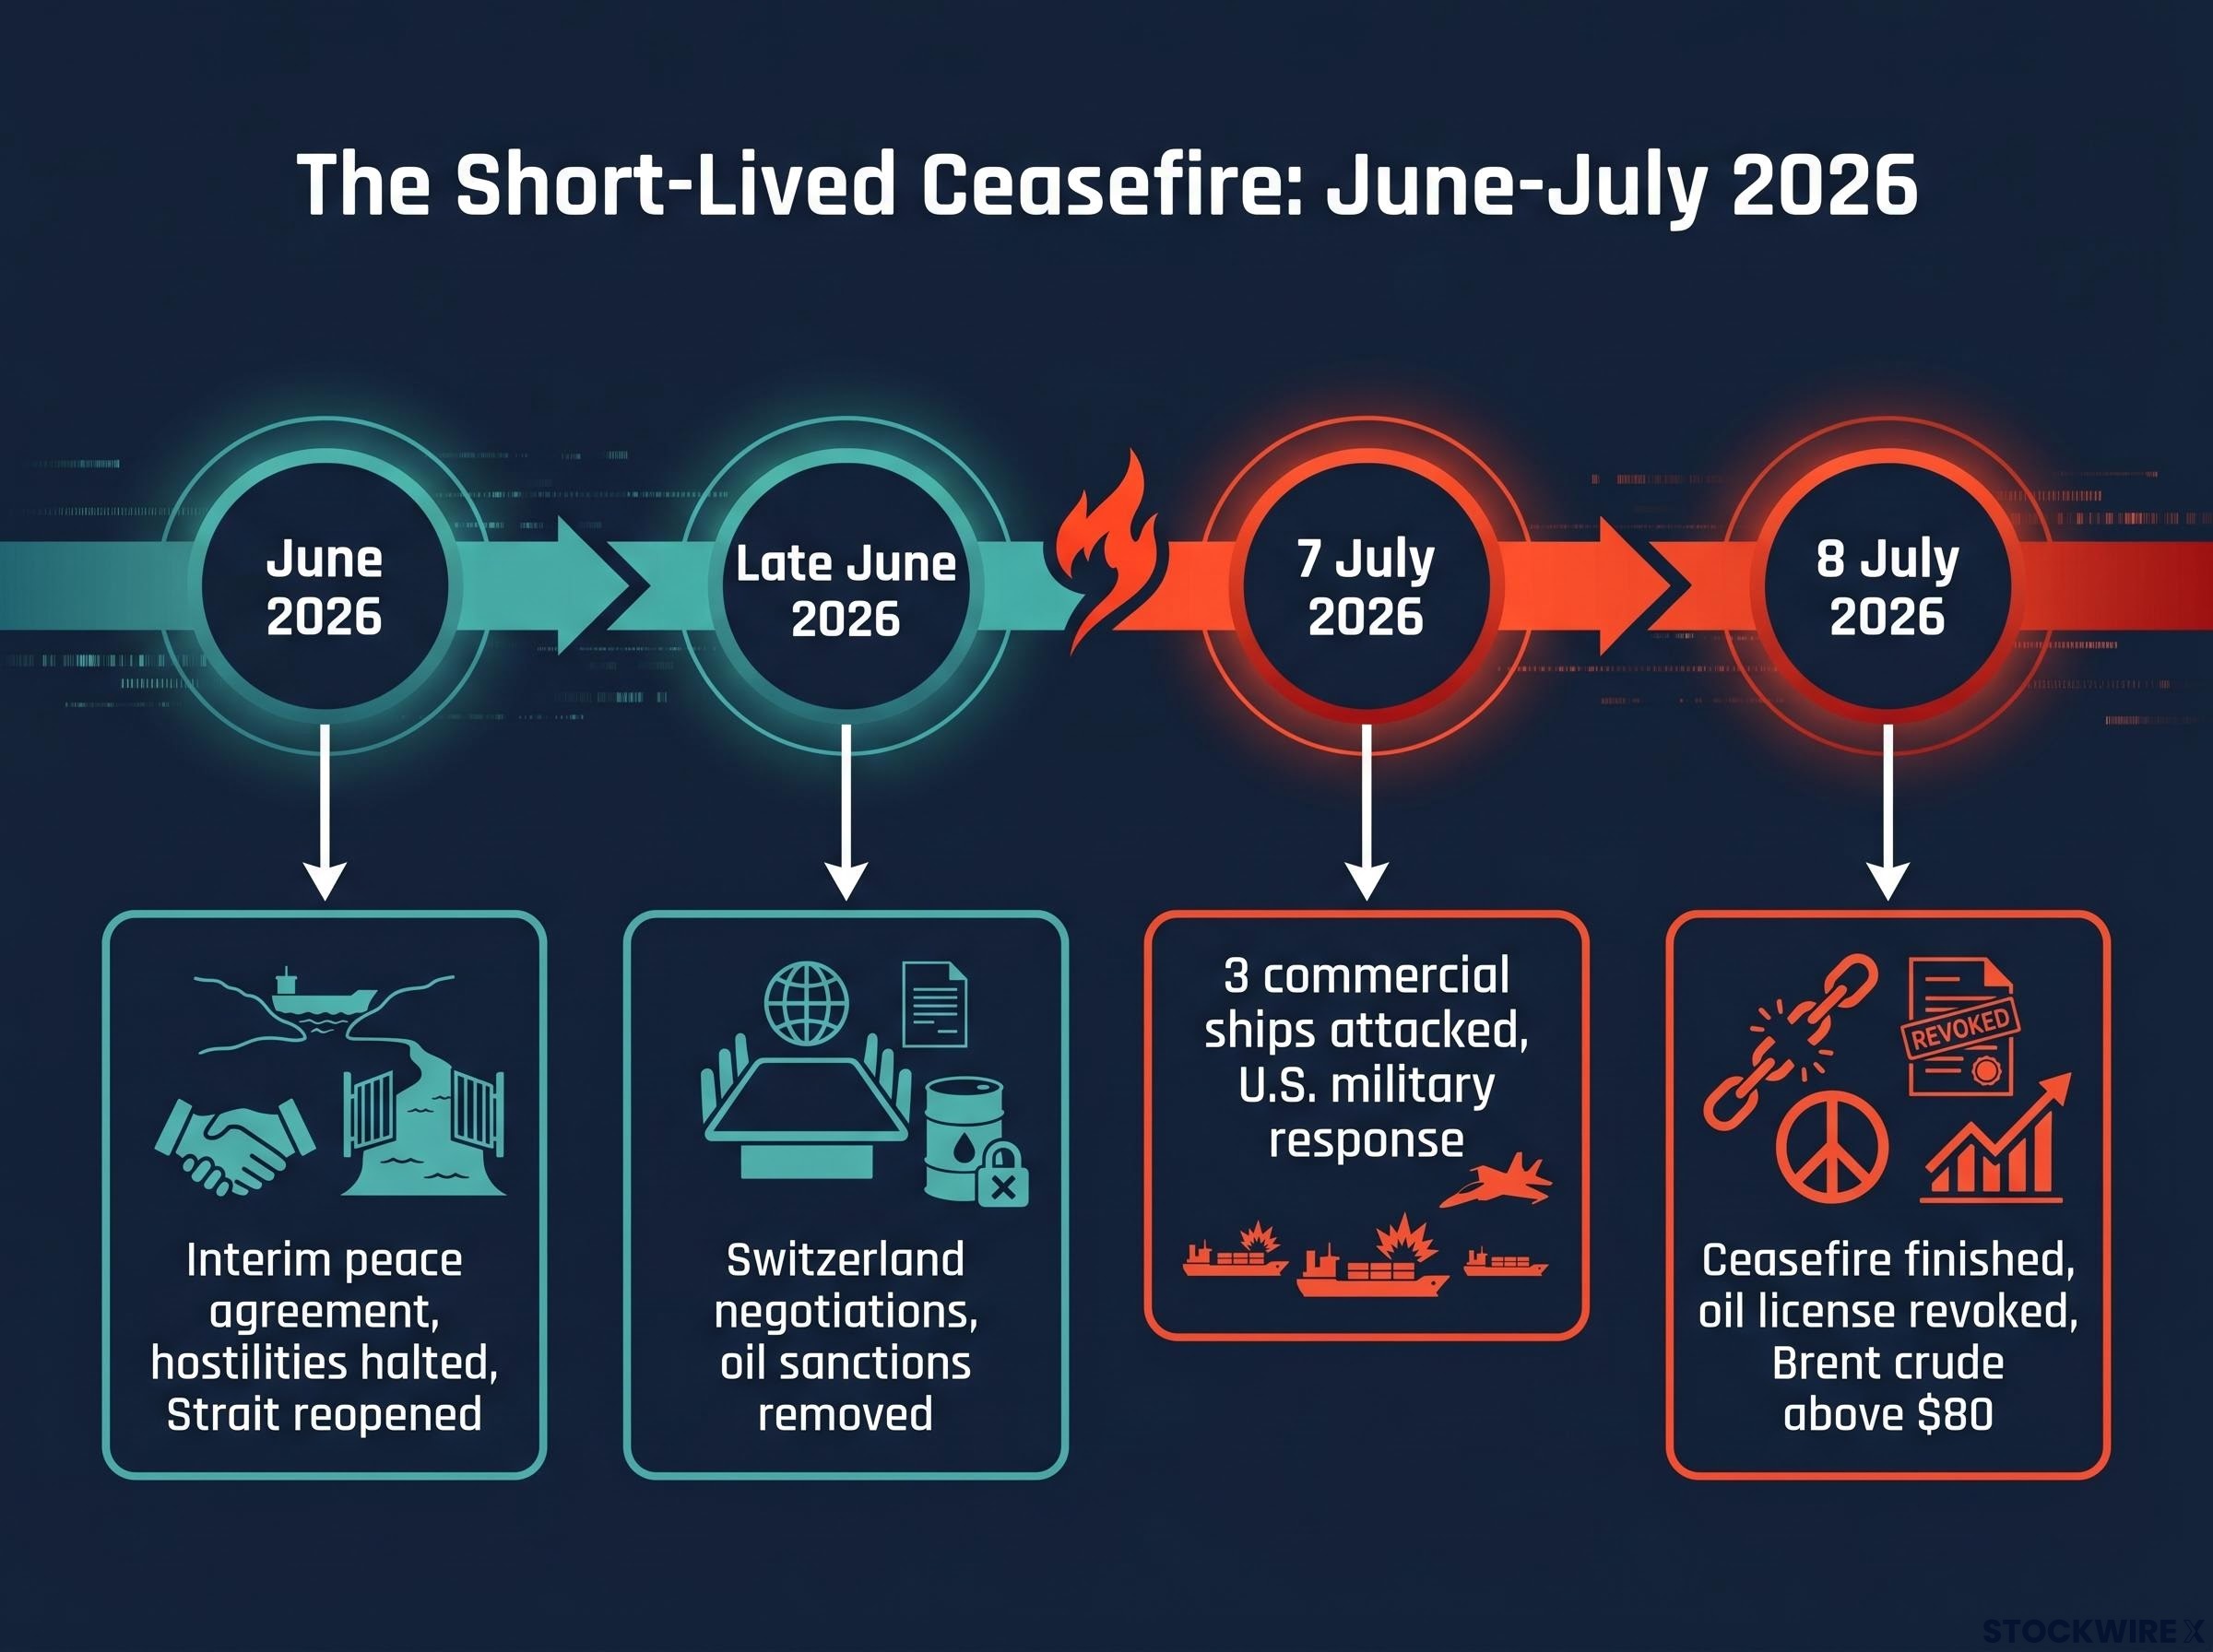
The diplomatic arc was short enough to fit on a single timeline, and that brevity tells you how fragile the relief always was.
- June 2026 (Fed rate decision day): Washington and Tehran concluded an interim peace agreement that brought hostilities to a halt and reopened transit through the Strait of Hormuz. Within days, oil prices retreated to levels seen before the conflict began.
- Late June 2026: Subsequent negotiations convened in Switzerland. Sanctions on Iranian oil exports were removed as part of the concessions agreed, and both governments entered into further technical-level talks.
- 7 July 2026: Iran’s forces struck three commercial ships operating in and around the Strait of Hormuz, triggering a large-scale U.S. military response.
- 8 July 2026: President Trump announced that the ceasefire was finished, describing engagement with Tehran as a “waste of time,” while also indicating he did not foresee a return to full-scale war. The U.S. revoked the licence that had allowed Iranian oil sales under the ceasefire terms.
The agreement had progressed far enough for sanctions to be lifted and Swiss follow-on talks to begin. That made the reversal sharper. The oil supply cushion created by the ceasefire was a contingent, politically fragile arrangement, not a structural improvement, and the market had been underpricing the reversal risk. That mispricing is now correcting in real time.
The Swiss talks collapse in late June 2026 had already signalled how fragile the diplomatic architecture was, with Tehran walking out after Trump publicly demanded Hezbollah concessions while negotiators were still at the table, reversing a brief period of limited Hormuz vessel movements that had briefly pushed Brent toward the $79-80 range.
When big ASX news breaks, our subscribers know first
Why the Strait of Hormuz is the world’s most consequential shipping lane
The Strait of Hormuz is the only maritime outlet for the Persian Gulf; a narrow corridor connecting six major oil and liquefied natural gas (LNG) producers to global markets.
Approximately one-fifth of all globally traded oil, plus a significant share of LNG exports, transits the Strait of Hormuz. This is based on long-standing EIA and industry estimates.
The producers whose exports depend on this single corridor include:
- Saudi Arabia
- United Arab Emirates
- Qatar
- Kuwait
- Iraq
- Iran
Bypass alternatives exist on paper but not at scale. Saudi and UAE pipelines to the Red Sea or Oman can handle only a fraction of typical Hormuz throughput. They are relief valves, not substitutes.
The absence of viable alternatives means that even a partial or temporary disruption to Hormuz routing translates into a supply tightening that bypasses normal market buffers. That asymmetry is what makes Brent’s move above $80 a rational response to geography, not an overreaction, and it is why the chokepoint logic extends beyond petrol prices to LNG costs, manufactured goods, and imported inflation for every economy that sources energy from the Gulf.
Three tankers, sixty targets, and a crude price crossing $80
The escalation was not abstract. It had vessel names, target coordinates, and a crude price that moved within hours.
According to U.S. Central Command (CENTCOM) statements dated 7-8 July 2026, three commercial vessels were attacked:
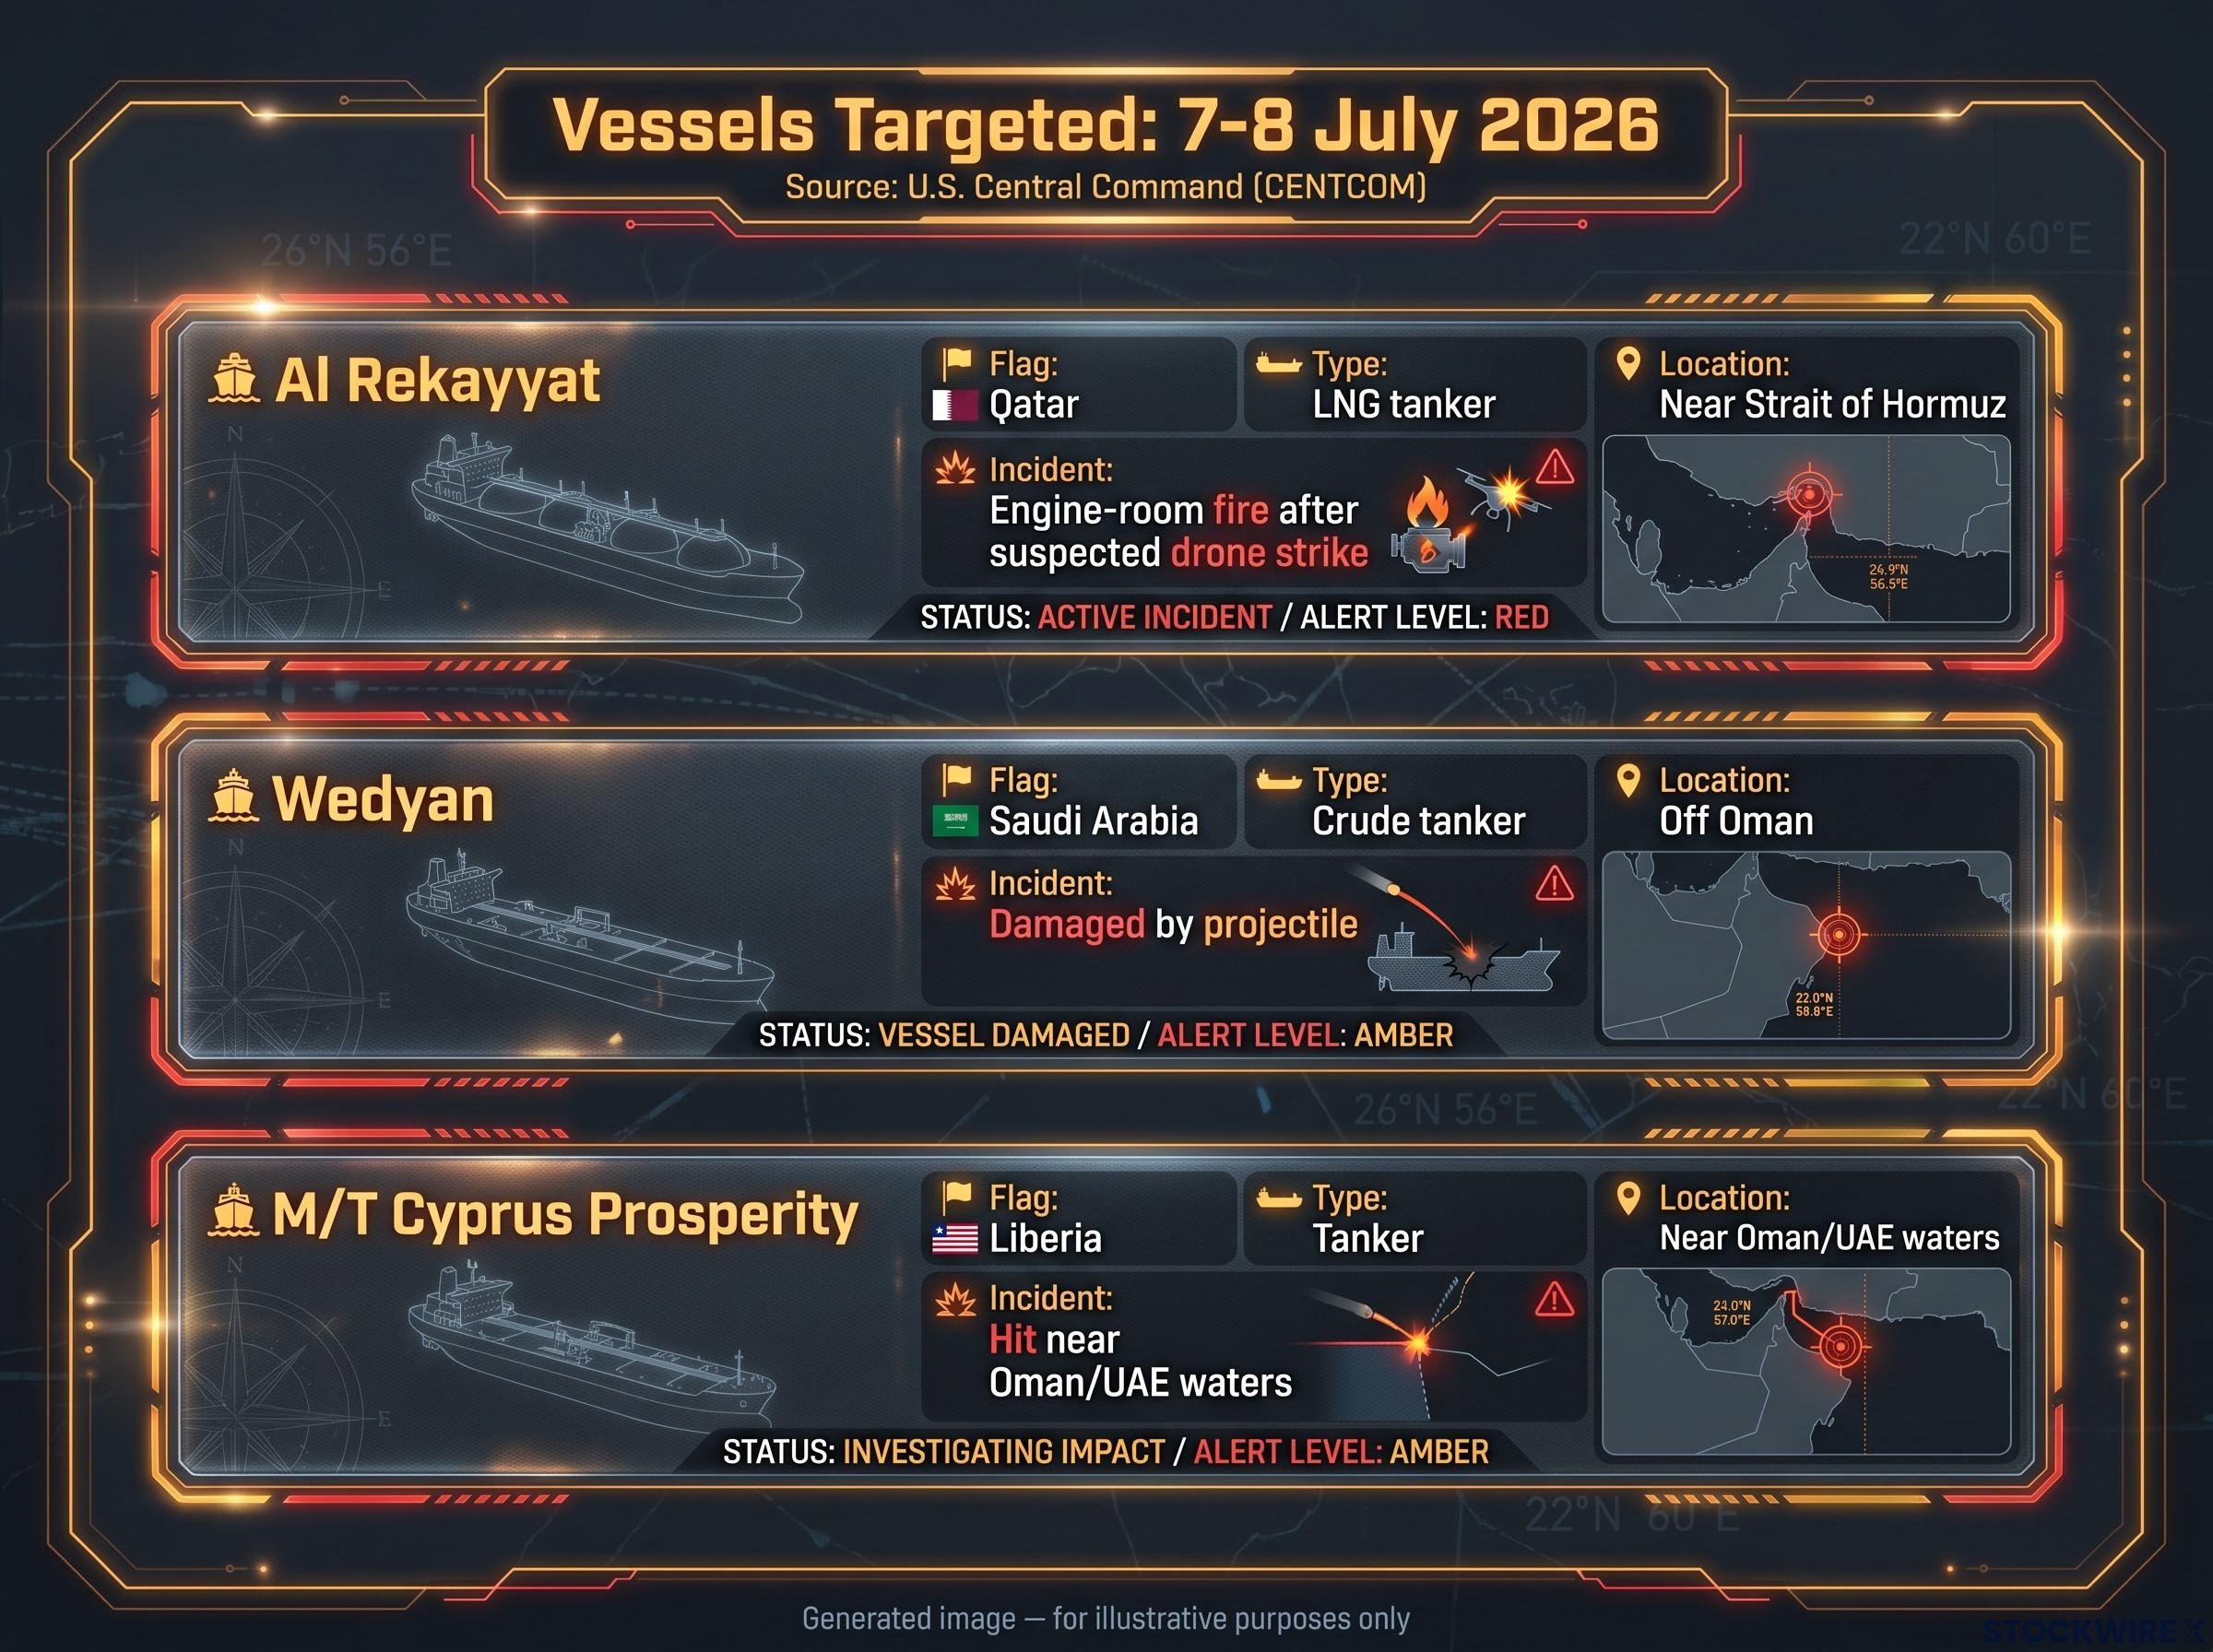
| Vessel | Flag | Type | Incident | Location |
|---|---|---|---|---|
| Al Rekayyat | Qatar | LNG tanker | Engine-room fire after suspected drone strike | Near Strait of Hormuz |
| Wedyan | Saudi Arabia | Crude tanker | Damaged by projectile | Off Oman |
| M/T Cyprus Prosperity | Liberia | Tanker | Hit near Oman/UAE waters | Near Oman/UAE |
The U.S. blamed Iran’s Islamic Revolutionary Guard Corps (IRGC), the branch of Iran’s military responsible for asymmetric operations, for all three attacks.
In response, U.S. forces struck 60-80 Iranian targets, including small boats, minelayers, air defences, missile and drone launch sites, and port and naval facilities at Sirik, Qeshm, Bandar Abbas, and surrounding areas. Iran claimed retaliatory drone and missile attacks against U.S. facilities in Bahrain and Kuwait, including the Fifth Fleet base and Ali Al Salem Air Base.
CENTCOM described the IRGC attacks as “unwarranted, dangerous” violations of the ceasefire and freedom of navigation.
Brent crude briefly exceeded $80 per barrel on 8 July 2026, according to Investing.com reporting by Anuron Mitra. The naming of specific vessels and specific target sites is not just military detail. It tells you the Strait is now an environment where every voyage carries a calculable probability of kinetic damage, and insurers and shippers are repricing that probability right now.
The Hormuz risk premium had already proved structural rather than transient in prior phases of the conflict, with VLCC daily hire rates tracking around $110,000 per day and the IEA projecting a two-year supply chain recovery timeline even under a best-case diplomatic resolution, both signals that the market’s initial response to the July 7 attacks is repricing a persistent condition rather than a temporary one.
How an oil shock becomes an inflation problem
The path from a tanker attack in the Gulf to higher prices at the checkout runs through a clear sequence:
- Crude prices rise. Higher Brent lifts gasoline, diesel, and heating fuel costs. This feeds directly into headline CPI, the broadest measure of consumer price inflation, typically within one to three months.
- Transport and logistics costs climb. Elevated fuel costs raise the price of moving goods by road, rail, sea, and air. Food, manufactured products, and services all absorb the increase.
- Inflation expectations shift. If businesses and households come to expect sustained higher energy costs, they adjust wages and prices upward, making inflation stickier and harder for central banks to reverse.
The ceasefire had briefly removed a key inflation risk by pushing oil prices back toward pre-conflict levels. The loss of the Iranian oil export licence re-tightens the supply side that had just been loosened.
Federal Reserve research on oil price shocks finds that crude price increases transmit into headline consumer price inflation within one to three months, with the pass-through effect persistent enough to alter central bank rate expectations when shocks are sustained rather than transient.
What this means for the Federal Reserve’s rate path
The Fed’s disinflation story depended partly on a stable or declining energy price backdrop. That backdrop has changed.
A prolonged period of elevated oil prices, or a clear shock to inflation expectations, tends to make the Fed reluctant to cut rates even when the real economy slows. The June 2026 rate decision had coincided with the ceasefire signing, and the dual relief in energy prices and monetary policy expectations is now unwinding simultaneously.
For anyone who had been anticipating near-term Fed rate cuts, this escalation directly extends the timeline. The cost of borrowing, mortgage rates, and broader financial conditions are set to stay tighter for longer than the pre-July outlook suggested.
Who else gets caught in the crossfire: Europe, Asia, and emerging markets
This is not a U.S.-only story. The supply shock radiates outward through three distinct channels:
- Europe: Still rebuilding energy security after the loss of Russian pipeline gas, Europe is acutely sensitive to higher global LNG prices driven by Hormuz risk. This slows the European Central Bank’s (ECB) disinflation timeline and makes aggressive rate cuts harder to justify.
- Asia: Japan, South Korea, China, and India are among the largest importers of Gulf crude and LNG transiting Hormuz. A prolonged disruption worsens trade balances, pressures domestic inflation, and forces difficult choices between growth support and price stability.
- Emerging markets: Higher oil prices combined with a potentially more hawkish Fed can strengthen the U.S. dollar. For oil-importing countries with large dollar-denominated debts, this creates a compounding burden: more expensive energy and a more expensive currency in which to service that debt.
Investors tracking the broader portfolio implications will find our dedicated guide to Hormuz-driven asset repricing, which covers how the oil shock is transmitting through equities, fixed income, and currencies across Asian, European, and emerging markets, along with the four indicators analysts are using to distinguish a transient spike from a structural repricing.
If you are investing or living outside the United States, the Hormuz escalation is a direct financial exposure, not a distant foreign-policy story.
What needs to happen before the risk premium comes back off
The outcome here is genuinely uncertain. Trump has declared the ceasefire over and called Iran a “waste of time,” but also suggested he does not expect full-scale war. That ambiguity is itself a source of market volatility.
Rather than watching the Brent spot price in isolation, these are the variables that will signal whether this is a transient spike or a sustained inflation driver:
- Military trajectory. Do U.S.-Iran strikes wind down after this round, or does Iran continue retaliating against shipping and U.S. regional bases? Escalation means duration; de-escalation means transience.
- Shipping and insurance signals. Changes in war-risk premiums from Lloyd’s market participants, insurer guidance, and commercial routing decisions are a leading indicator of how much physical disruption the industry is pricing in.
- OPEC+ response. Whether Saudi Arabia, the UAE, and other producers signal increased output or supply rerouting to offset Iranian export losses could set a price ceiling.
- U.S. policy clarity. Any clarification from the White House or Pentagon on red lines, end-goals, or openness to renewed talks. Fed communication on whether it views the energy shock as a material change to the inflation outlook also matters.
If fighting stabilises and Hormuz flows continue largely uninterrupted, the oil and inflation shock may remain transient. If attacks on shipping persist or escalate, the Strait becomes a sustained global inflation driver that central banks can only react to, not prevent.
For readers wanting to model the three scenarios now facing energy markets and central banks, our full explainer on the oil-inflation divergence maps out the de-escalation, stalemate, and escalation price paths through late 2026, including the specific Brent levels and CPI outcomes associated with each.
This article is for informational purposes only and should not be considered financial advice. Investors should conduct their own research and consult with financial professionals before making investment decisions. These statements are speculative and subject to change based on market developments and geopolitical conditions.