Fed Holds Rates but Committee Splits 9-9 on What Comes Next
14 hrs ago

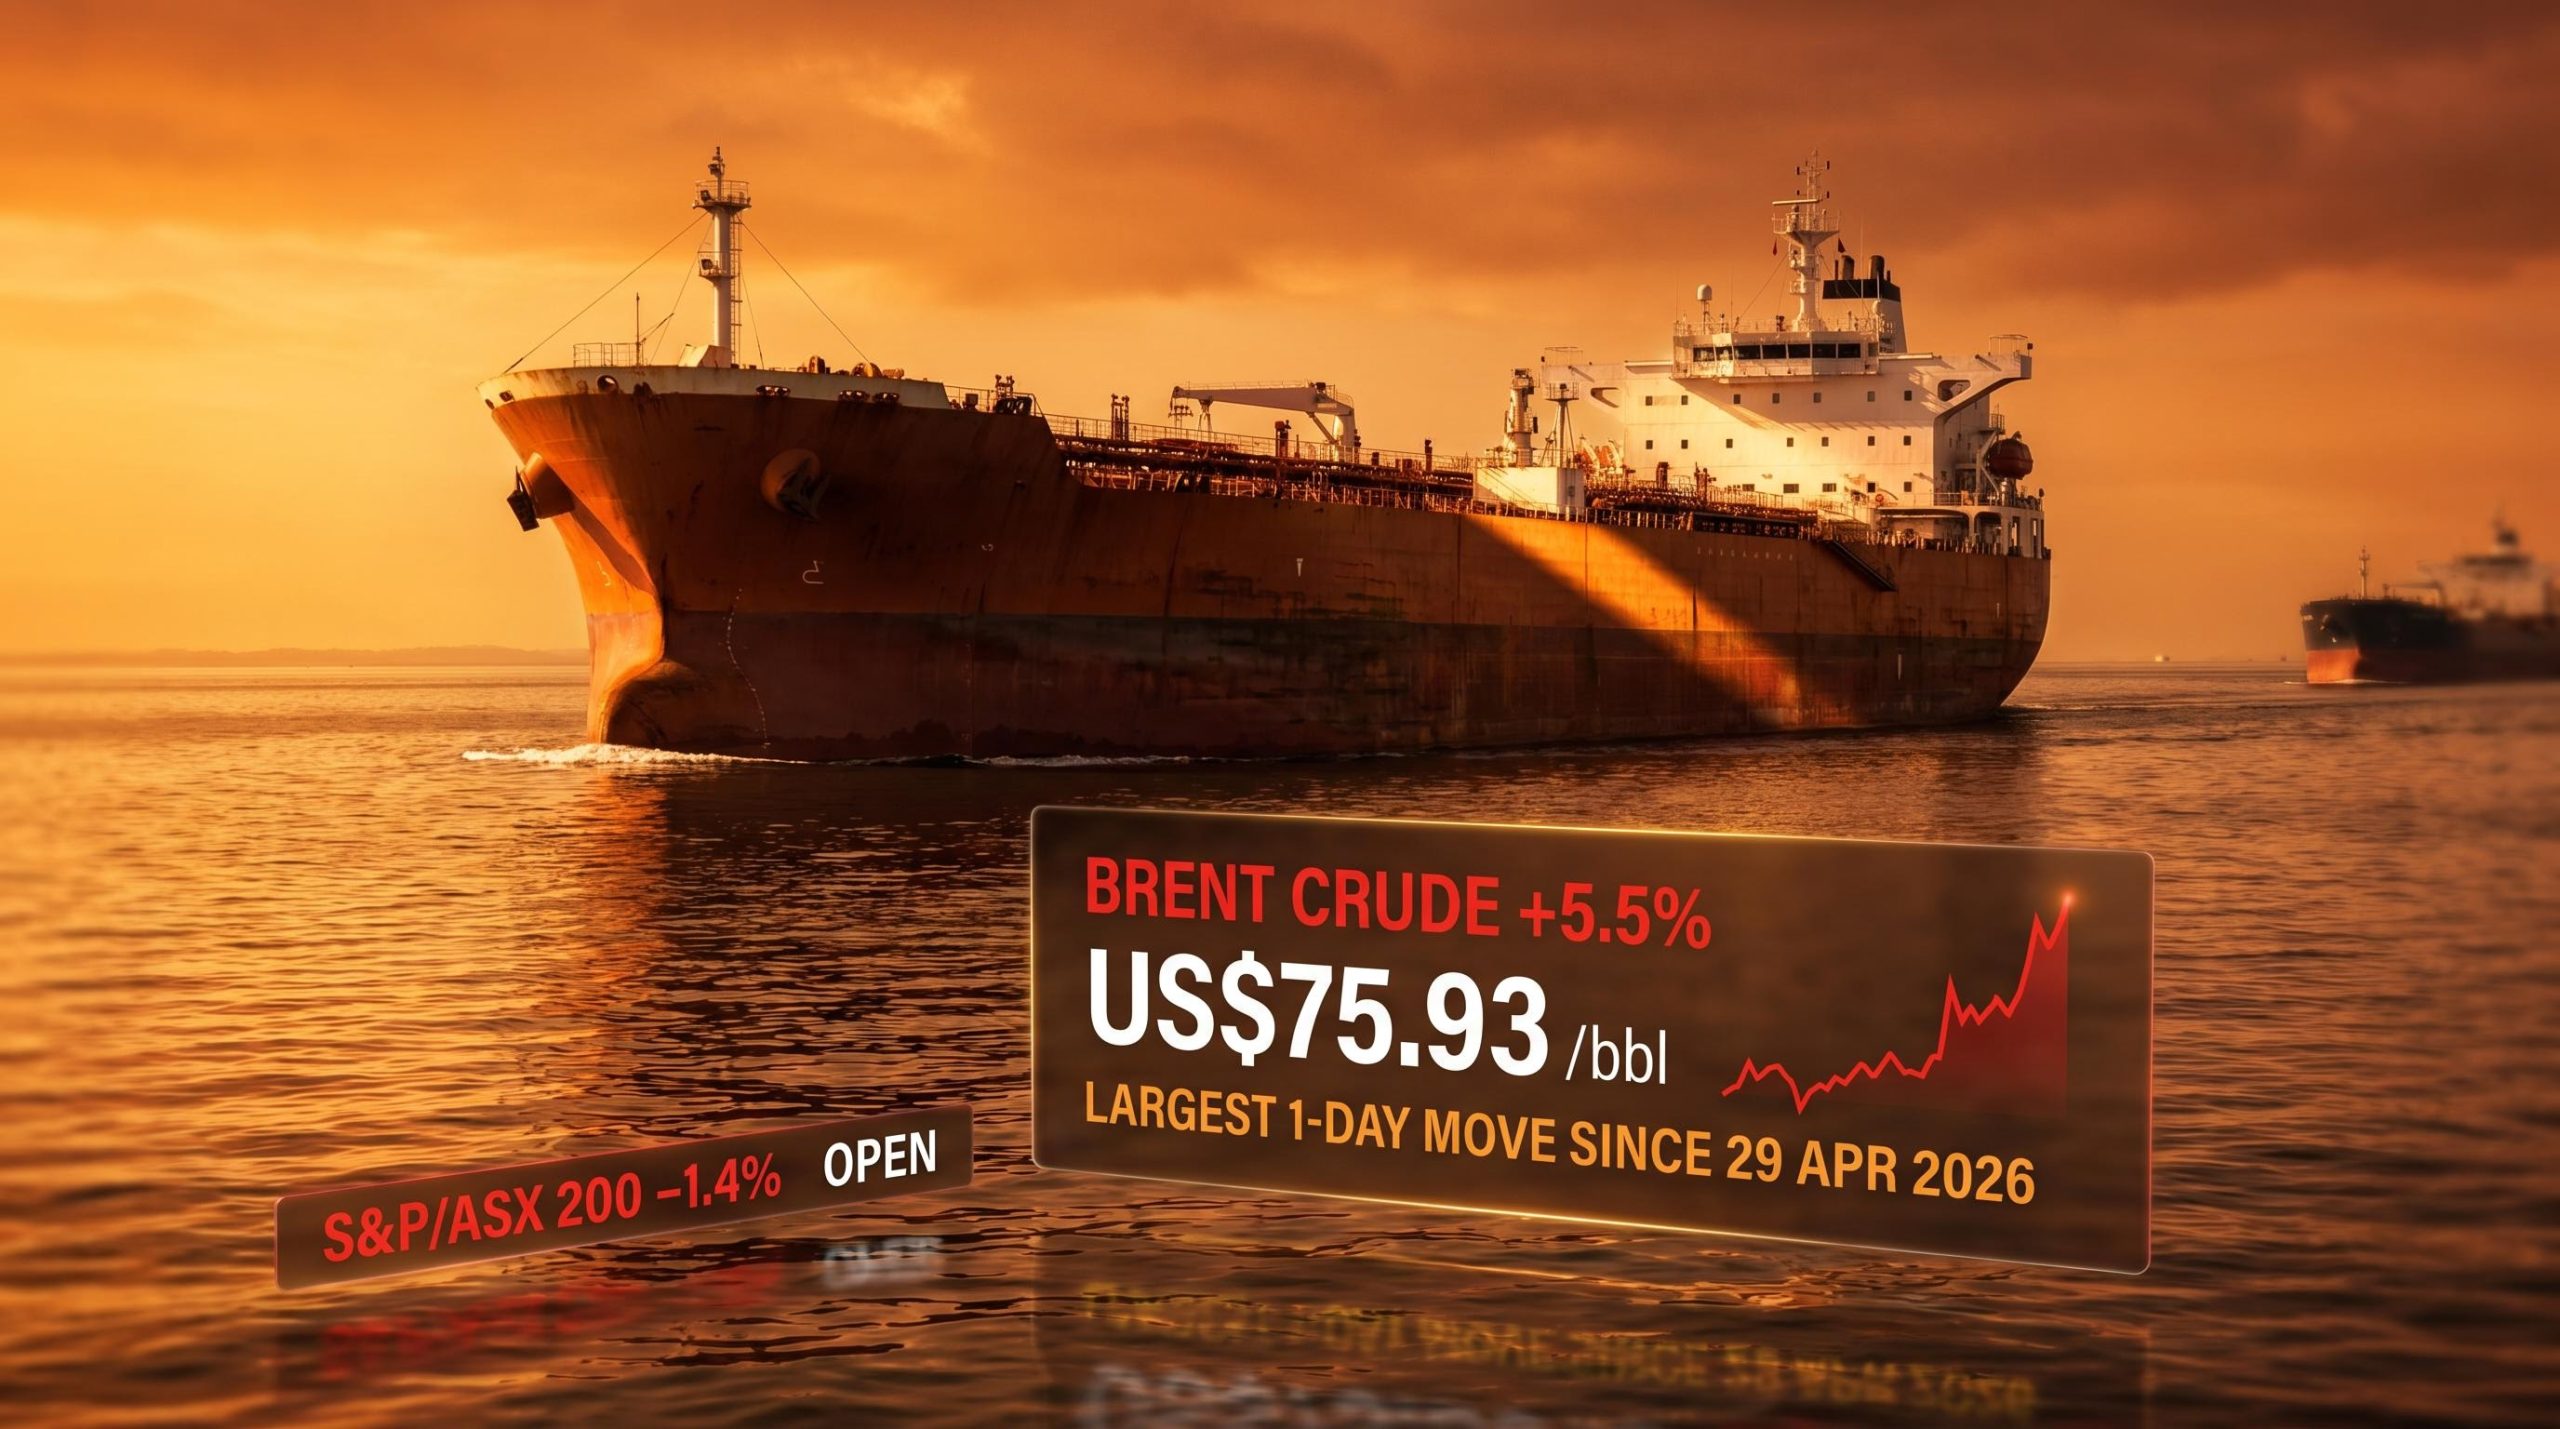
Brent crude jumped 5.5% on Wednesday 8 July 2026, closing at US$75.93 per barrel as Iran’s attacks on commercial shipping in the Strait of Hormuz coincided with Washington cancelling Tehran’s oil-sales waiver. This combination is not a routine market fluctuation. It marks the largest one-day move in the oil price since 29 April 2026, arriving after months in which investors had largely priced the February ceasefire as durable.
The S&P/ASX 200 opened with losses reaching 1.4% on Wednesday before recovering ground throughout the session, finishing approximately 0.5% lower at the close. Sector rotations are already underway. The strategic backdrop looks superficially similar to February’s conflict trade, but almost every valuation detail that matters has shifted underneath it. The waiver revocation and the tanker incidents happened simultaneously, which is what separates this session from earlier flare-ups.
Here is how to read what the market is telling you today, which sectors are actually in a different position than they were in February, and what to watch over the next 48-72 hours before making any moves.
Wednesday’s session did not hinge on a single headline. Three distinct escalations landed at the same time, and their convergence is what made the market’s reaction qualitatively different from earlier Hormuz flare-ups during the ceasefire period.
Iran’s assertion of strait transit authority, communicated to the IMO on Wednesday, mirrors the sovereignty demand that collapsed negotiations in late May 2026, when Tehran’s insistence on permanent control over Hormuz passage was the sole structural sticking point that sent Brent down nearly 5% in a single session.
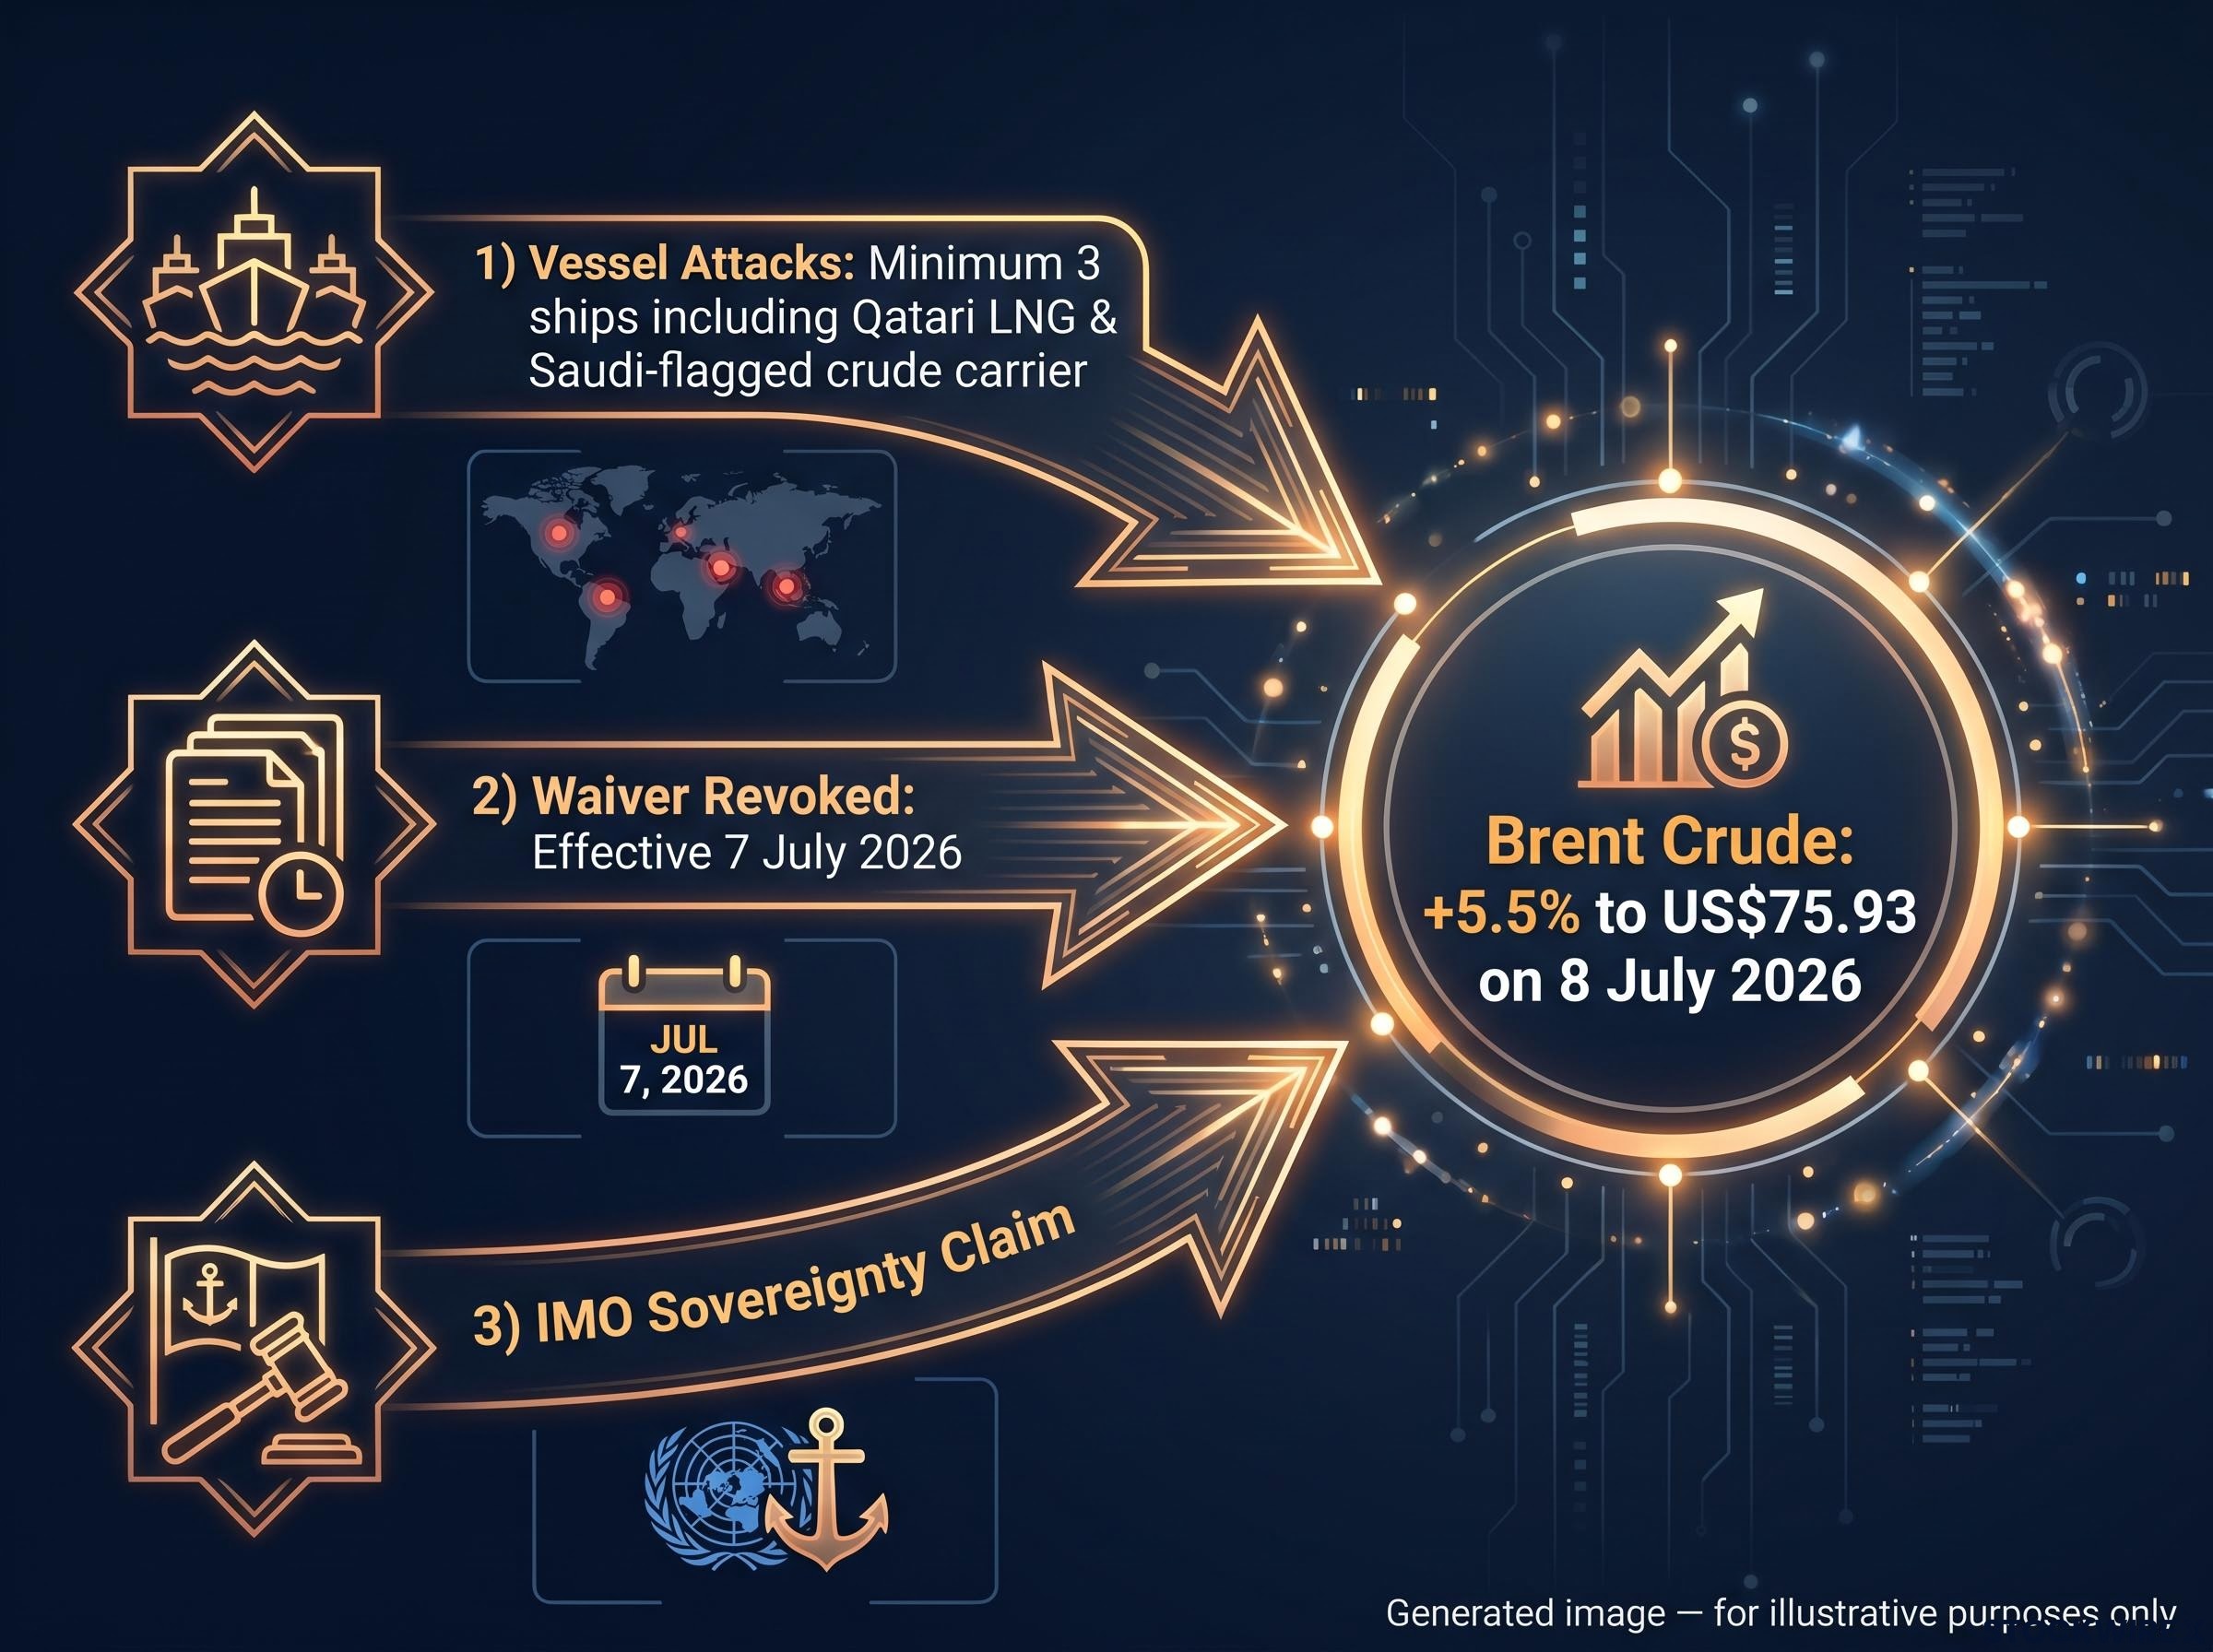
Brent crude reached US$75.93 per barrel on Wednesday, a 5.5% single-session gain, the strongest move since 29 April 2026.
The interim agreement signed last month between the US and Iran left fundamental disputes unresolved, among them the question of strait transit fees and the future of Iran’s nuclear programme. The 60-day framework for reaching a permanent settlement is now under direct pressure following Wednesday’s events. Physical vessel attacks landing alongside a formal sanctions escalation in the same session is what transforms this from a volatility event into a structural risk repricing. That distinction matters before interpreting every sector move that followed.
The S&P/ASX 200 dropped as much as 1.4% at the open, then spent the rest of the session recovering to close down approximately 0.5%. Read that pattern carefully. It is not resilience.
Energy-linked names and defensives moved in the opposite direction to miners and growth-sensitive stocks during the session. That divergence tells you the market was rotating, not recovering. Participants cut risk at the open but lacked conviction to sustain full de-risking into the close because the duration and severity of the shipping disruption remain genuinely unknown.
This pattern, a sharp open drop followed by a partial recovery, is characteristic of events where the macro signal is clear but the timeline is not. It contrasts with the February 2026 conflict period, when a clearer directional trend emerged more quickly. A 0.5% close after a 1.4% low is not the market shrugging this off; it is investors waiting for confirmation of whether the shipping disruption is a single incident or a sustained pattern before committing capital in either direction.
The Strait of Hormuz is the world’s most significant oil and LNG chokepoint. A substantial share of global crude supply transits the strait daily, and there is no fast alternative route of equivalent scale. The only viable reroute, the Cape of Good Hope, adds weeks of voyage time and materially higher freight costs.
Oil futures markets price expected future supply, not current supply. That is the mechanism that makes geopolitical tail risk in a chokepoint produce immediate price responses even before a single barrel is actually delayed. Three transmission channels work simultaneously:
EIA scenario modelling placed Brent well above US$100 per barrel if the Strait of Hormuz were fully closed, anchoring the upper bound of the price corridor.
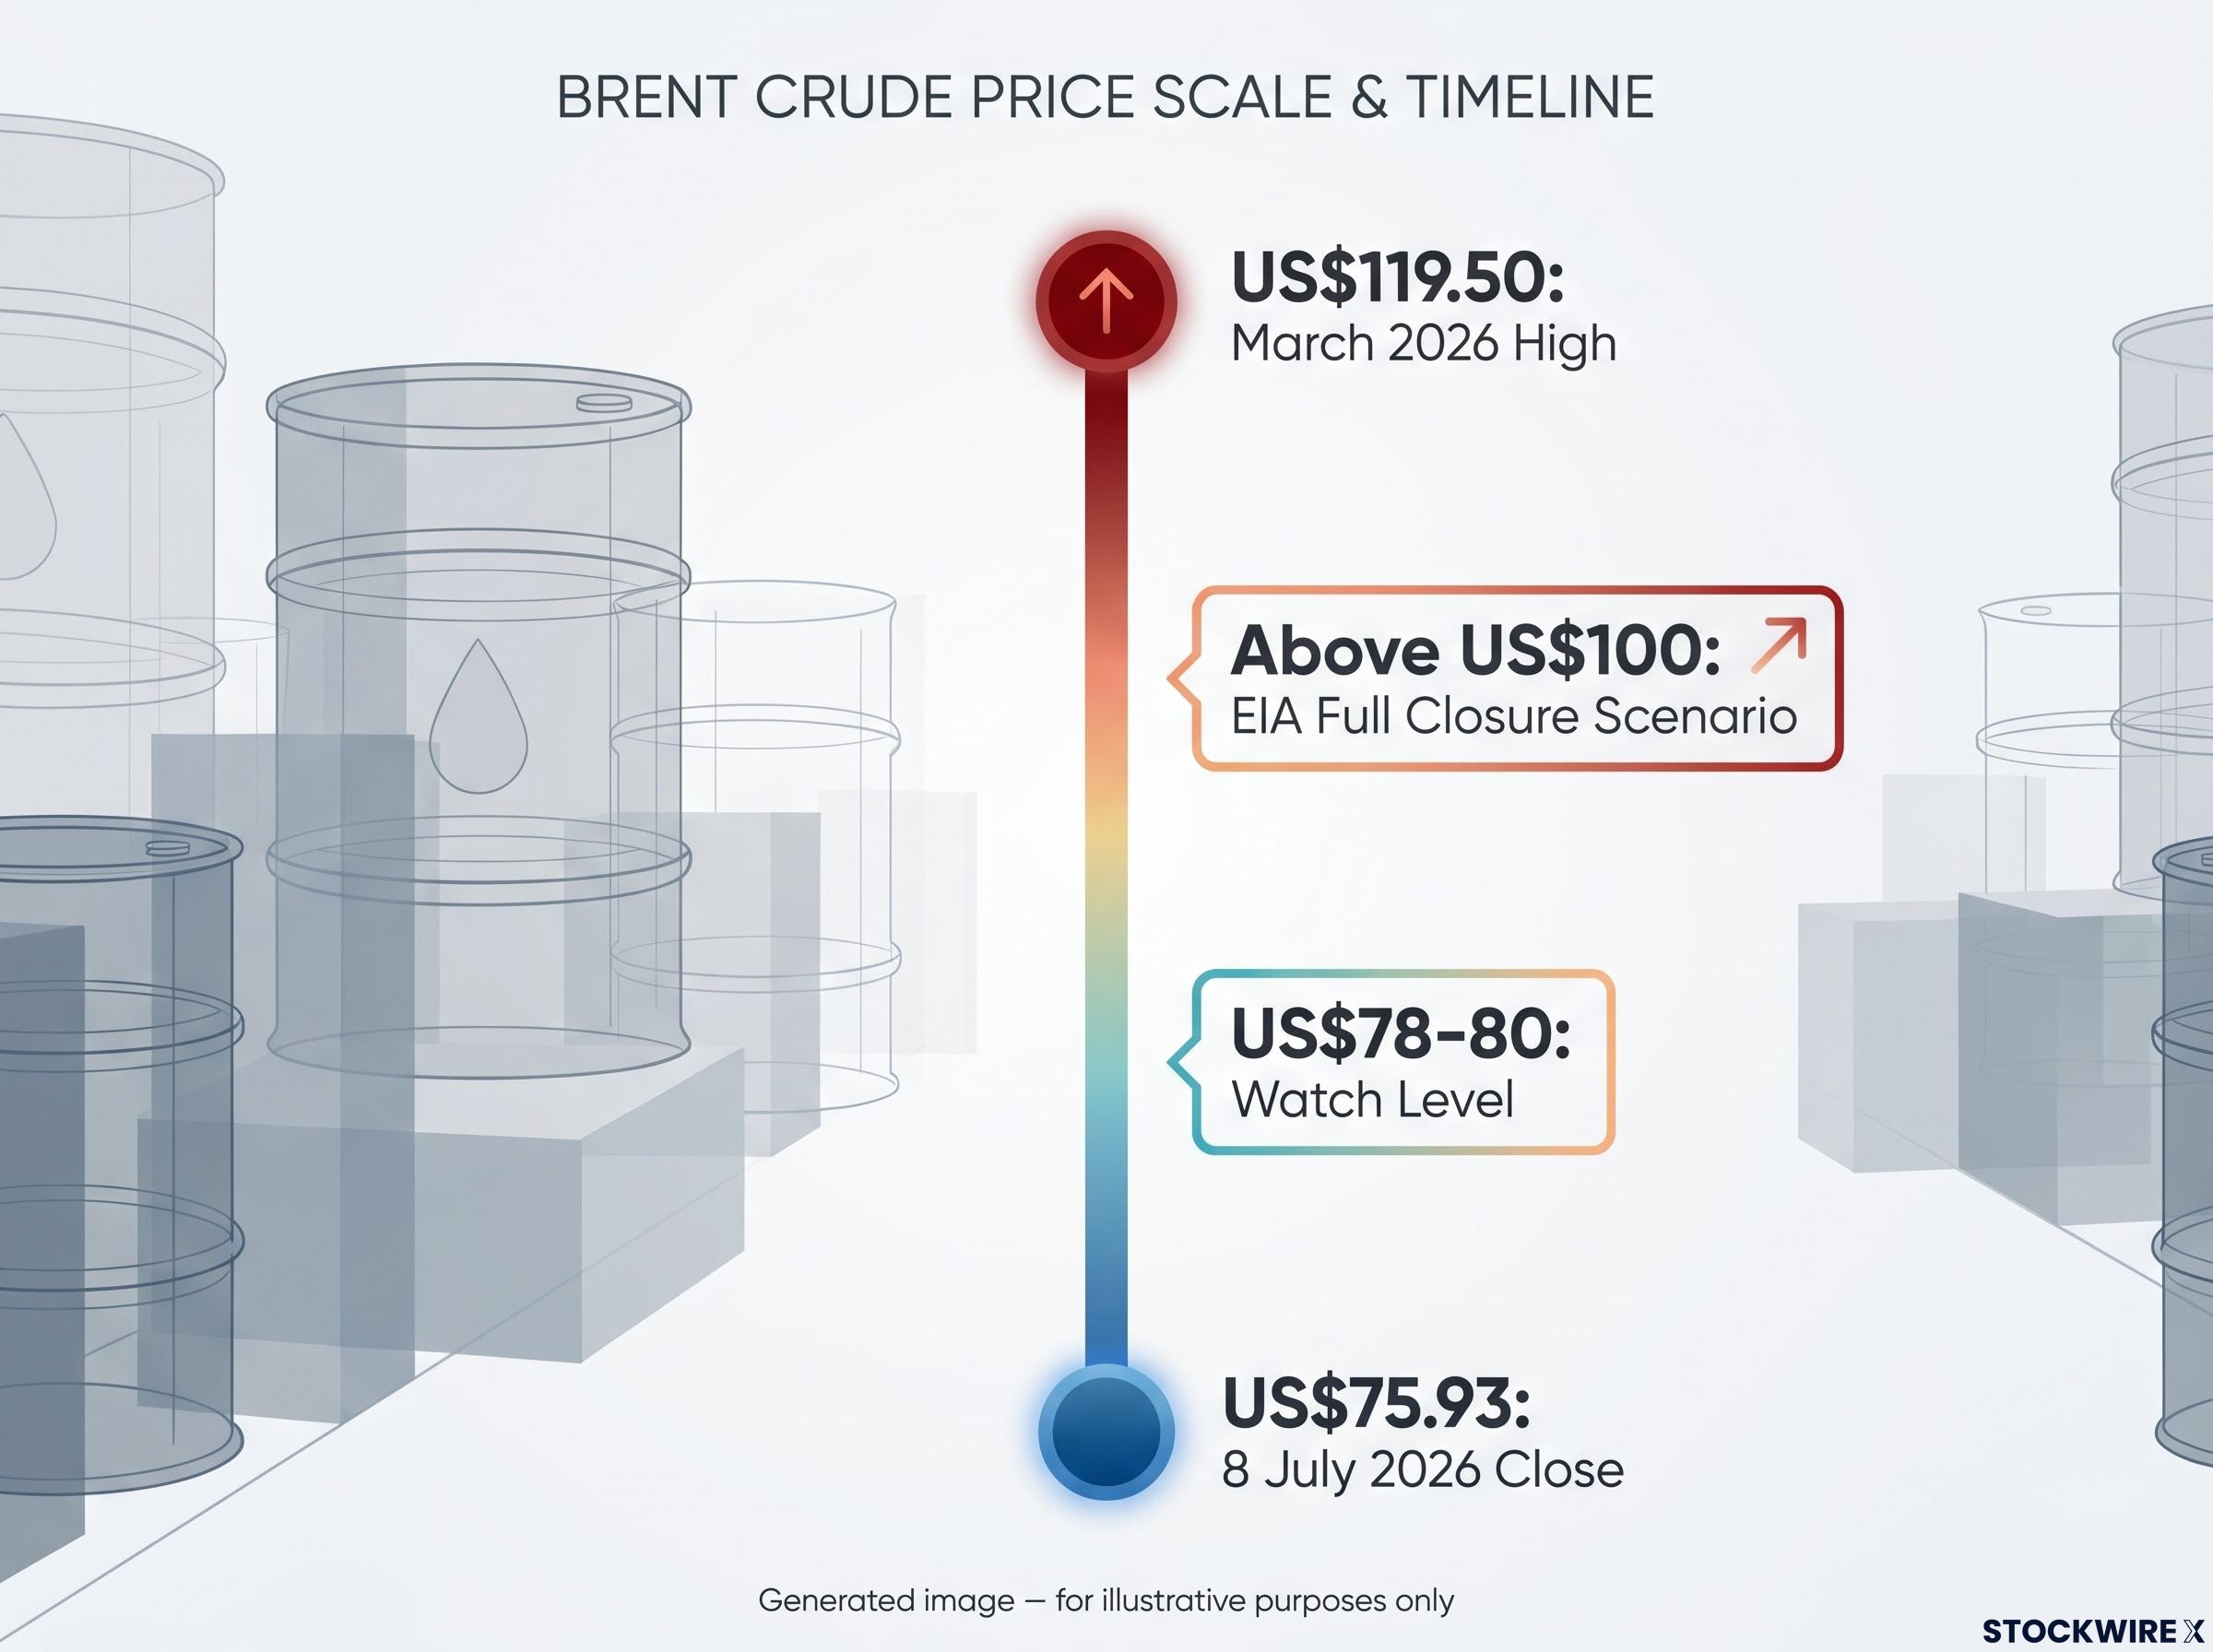
The gap between US$75.93 today and that above-US$100 full-closure scenario is the market’s current estimate of how likely actual sustained disruption is. That gap is what you should be watching narrow or widen over the next week. Current mid-70s pricing reflects a partial risk premium, not a worst-case outcome.
The same broad directional signals are present: energy names under pressure from supply risk, cyclicals facing headwinds, defensives holding relative ground. However, the valuations from which each sector enters this episode have moved considerably, and that changes what any rotation is likely to deliver.
The February-March episode established the baseline: a Hormuz supply disruption of sustained severity sent Brent from around $70 per barrel to above $110 in under three months, with EIA modelling placing peak Gulf production shut-ins at nearly 10.8 million barrels per day, a scale that no alternative pipeline infrastructure could offset.
| Sector | February 2026 starting condition | July 2026 starting condition | Implication for new positions |
|---|---|---|---|
| Energy | Cheap, under-owned, with Brent near pre-conflict lows | Brent sitting at US$75.93, well off the March high of US$119.50, but carried by several months of sector outperformance | Upside is real but the asymmetry is smaller; tactical over broad exposure |
| Defensives | Reasonably valued, offering a clear rotation destination | Valuations stretched after a sustained period of strong gains stretching back to early 2026 | Still dampen volatility, but forward return profile has compressed |
| Miners/Resources | Fully priced cyclicals, vulnerable to de-rating | Significant losses in recent weeks have left valuations materially lower than earlier in the year | Less incremental downside, but no catalyst without improving demand data |
There is also a reduced-surprise effect at work. After February-March, physical markets and financial traders built contingency plans, hedges, and rerouting assumptions. That preparation typically dampens second-round shock magnitude.
The broad direction of the February trade remains valid. Even so, the pace and scale of any rotation this time around is likely to be more modest and less linear.
The investor who tries to execute the February playbook mechanically in July is likely to find slower returns even if the directional calls are eventually correct, because the market has already moved part of the way toward those outcomes.
Rather than waiting passively for headlines, track these four signals over the next two to three days. Each one tells you something specific about whether the oil risk premium is temporary or structural.
The specific Brent price level at which you check in over the next 48 hours tells you more about whether this event has changed the structural oil story than any single headline, because price aggregates the collective judgment of every informed participant in the market.
The Hormuz risk premium does not decompress quickly even when diplomatic signals improve: war-risk insurance withdrawal effectively closed the strait to standard commercial traffic in May 2026 even when physical passage remained technically possible, and VLCC hire rates tracking $110,000 per day provided a real-time physical market signal that moved faster than crude futures.
The three major sector calls look different in July than they did in February, and price discipline is what separates a considered position from a reactive one.
The volatility overlay matters beyond sector rotation. Elevated oil is a key input into inflation expectations and central bank path assumptions. The ripple effects extend into broader market risk premia, particularly for an ASX whose commodity-heavy index composition amplifies global risk sentiment.
Elevated oil is a key input into inflation expectations and central bank path assumptions. RBA analysis of higher global energy prices documents the direct and indirect channels through which crude price shifts flow into Australian CPI, a transmission mechanism that amplifies the policy implications of any sustained Hormuz premium for domestic rate expectations.
If Hormuz disruption becomes sustained and tangible (rerouting confirmed, additional US sanctions), the balance shifts toward a more forceful and persistent premium, changing the calculus on all three sector calls.
This article is for informational purposes only and should not be considered financial advice. Investors should conduct their own research and consult with financial professionals before making investment decisions.
The directional logic of the oil price spike is coherent and the sector implications are real. But starting conditions mean the magnitude and duration of any rotation depend entirely on whether shipping disruption moves from risk to reality.
The monitoring framework above is your practical bridge. The 60-day diplomatic window for cementing a permanent settlement is the timeline to hold in mind. The US$78-80 Brent level on heavy volume is the price signal that distinguishes a temporary shock from a structural premium repricing. And the Cape of Good Hope rerouting signal is the real-economy confirmation that carries more weight than any analyst call.
If sustained rerouting begins, further US sanctions land, or the ceasefire talks break down, this becomes a different market. If none of those materialise within the next week, the spike fades and the mid-70s become a ceiling rather than a floor. That is the binary to track, not a prediction, but a framework for reading the next several days of Hormuz headlines as a live probability signal rather than noise.
For investors wanting to stress-test whether current sector positioning reflects durable structural logic or recency bias, our deep-dive into ASX sector rotation patterns examines how operating leverage and mean reversion mechanics produced 150-229% gains in beaten-down names while last year’s leaders lost more than 59%, with practical criteria for distinguishing cyclical recovery candidates from permanent decliners.
Three escalations landed simultaneously: Iran attacked at least three commercial ships near the Strait of Hormuz, Washington cancelled Iran's oil-export waiver effective 7 July 2026, and Iran formally asserted sovereignty over strait transit to the IMO. Their convergence in a single session is what drove Brent up 5.5% to US$75.93, the largest one-day move since 29 April 2026.
The Strait of Hormuz is the world's most important oil and LNG chokepoint, with no fast alternative route of equivalent scale; the only viable reroute via the Cape of Good Hope adds weeks of voyage time. Oil futures price expected future supply rather than current supply, so any credible threat to strait transit immediately reprices risk premiums across near-term contracts even before a single barrel is physically delayed.
The S&P/ASX 200 fell as much as 1.4% at the open before recovering to close approximately 0.5% lower, a pattern that reflects sector rotation rather than resilience: energy-linked names and defensives moved opposite to miners and growth-sensitive stocks as investors cut risk at the open but held back from full de-risking given uncertainty over the duration of the shipping disruption.
The directional signals are similar but starting valuations have shifted considerably: energy names are no longer cheap and under-owned, defensives have months of outperformance priced in, and miners have already sold off materially. That means any rotation is likely to be slower and less linear than February's, even if the directional calls eventually prove correct.
The key price signal is whether Brent pushes through US$78-80 on heavy volume, which would indicate traders are pricing a durable disruption rather than a temporary shock; a fade back to the low 70s points to a spike without follow-through. Beyond price, watch for confirmed tanker rerouting via the Cape of Good Hope, diplomatic signals from Tehran and Washington, and any additional US sanctions beyond the waiver revocation.