Waiting just one year before starting a 30-year investing horizon carries a terminal price tag of around $28,000. That is close to eight times the $3,600 in contributions you avoided by delaying. The asymmetry is not intuitive, and it is not small.
Most investors spend their energy on the selection problem: which fund, which asset class, which allocation split. The research on long-term compounding tells a different story. The calendar is the dominant variable. How early the clock starts, and whether it keeps running, determines more of your terminal wealth than what you buy once you are invested.
Here are the specific numbers behind two timing decisions, stopping contributions too early and starting too late, that shape your final balance more than any individual investment choice. The calculations are straightforward. The dollar figures they produce are not.
How 30 years of consistent contributions actually play out
The base case uses four assumptions:
- Monthly contribution: $300 ($3,600 per year)
- Real (after-inflation) return: 7% per year
- Time horizon: 30 years
- Total personal capital invested: $108,000
Over three decades, that $108,000 of personal capital grows to approximately $366,000. The remaining $258,000, more than twice what you put in, comes from compounding.
Compounding equity returns on diversified portfolios have averaged approximately 7% in real terms since 1802, which is why the 7% assumption used here is not optimistic but historically central; the second decade of any such investment generates nearly double the dollar gains of the first decade on the same initial capital.
That split is the foundational tension. The $258,000 in compounding gains is not spread evenly across the 30 years. Almost nothing interesting happens in the first decade. The growth is back-loaded, concentrated in the final stretch, which is exactly what makes the timing mistakes so expensive.
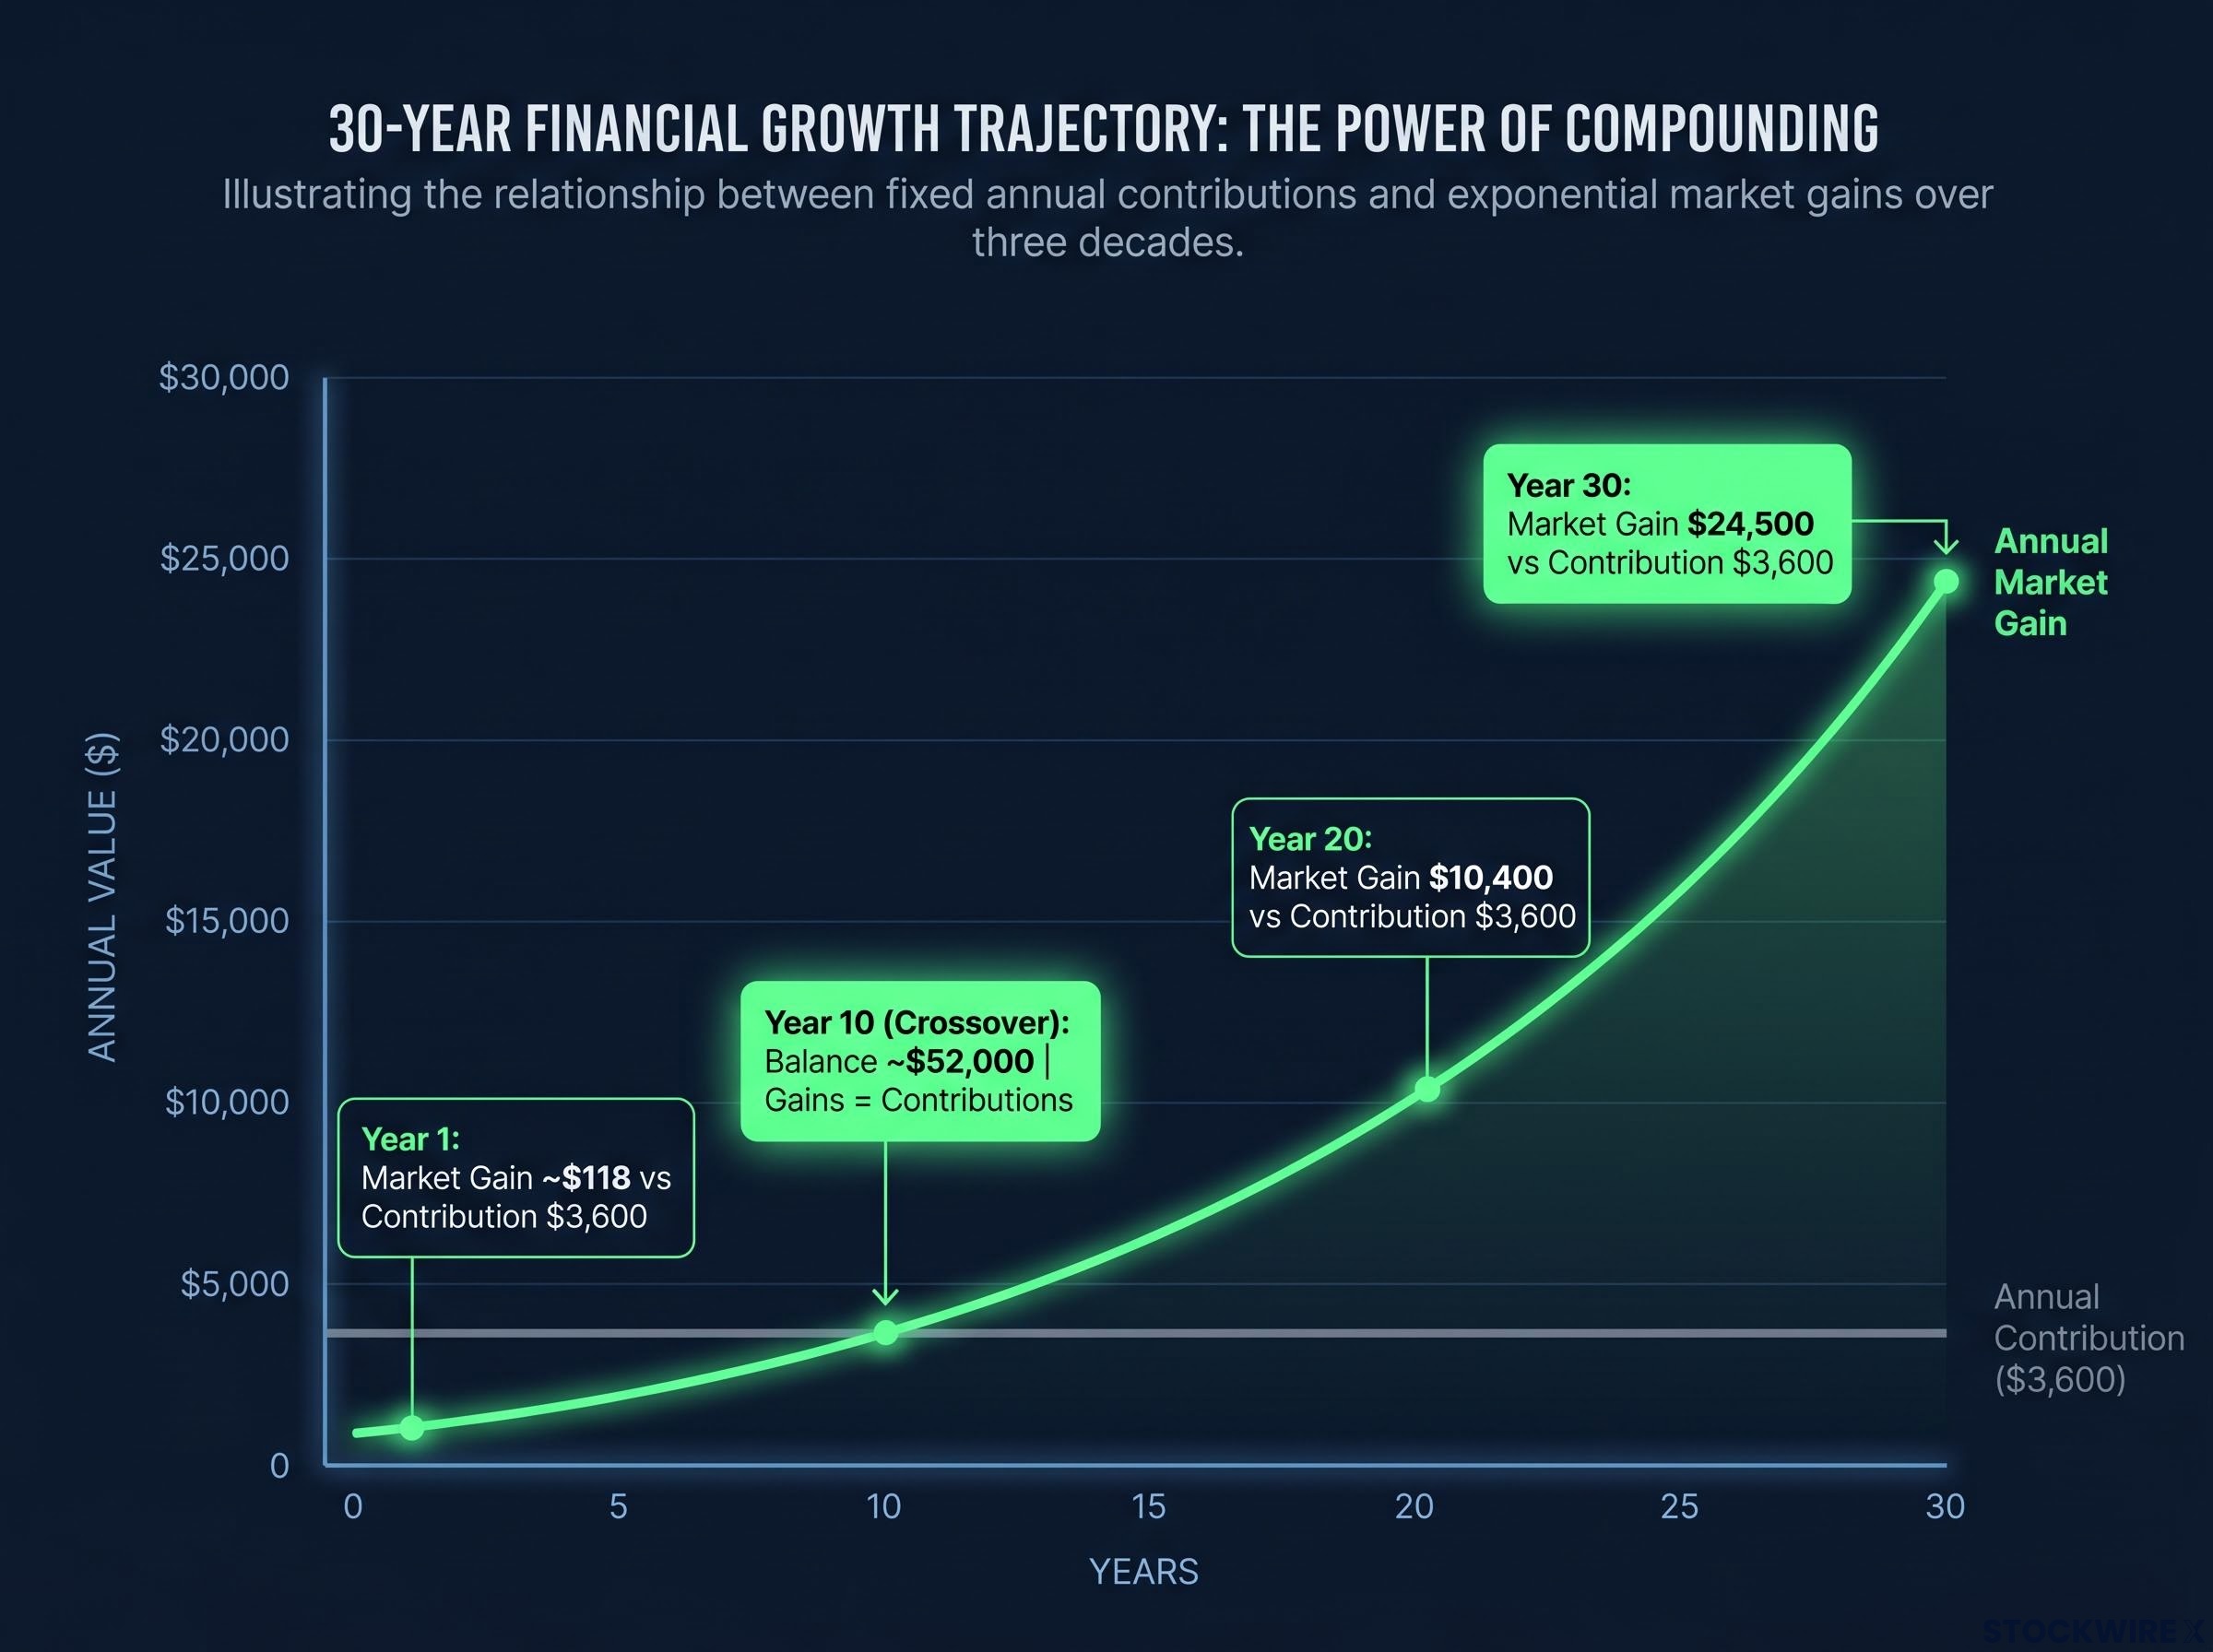
By year 30, the annual market gain on the account reaches approximately $24,500, which is close to seven times that year’s $3,600 personal contribution, and more than 200 times the market gain of roughly $118 recorded in year one.
That single comparison captures the entire shape of the problem. Every year of participation in the final phase is disproportionately valuable, and every year missed from that phase is disproportionately costly.
When big ASX news breaks, our subscribers know first
When annual market gains begin to outpace what you contribute each year
There is a specific balance at which annual market gains first equal annual contributions. This is the crossover point, the moment the account shifts from being primarily driven by deposits to being primarily driven by compounding on the existing base.
Dividing the annual contribution by the return rate gives you the figure directly. With $3,600 contributed each year and a 7% return, that crossover balance works out to approximately $51,400. In this scenario, the account reaches that level around year 10, at roughly $52,000.
Before year 10, most of the annual increase in value comes from new money deposited. After year 10, most of the annual increase comes from market growth on the accumulating base. The crossover is not a milestone to celebrate and coast from. It is the opening of the most powerful phase, and misreading it as a finish line is the setup for the first major mistake.
What the numbers look like after the crossover fires
| Year | Balance | Annual market gain | Annual contribution |
|---|---|---|---|
| 15 | $95,000 | $6,300 | $3,600 |
| 20 | $156,000 | $10,400 | $3,600 |
| 25 | $243,000 | $17,000 | $3,600 |
| 30 | $366,000 | $24,500 | $3,600 |
At year 20, market gains are running at roughly $10,400, approaching three times the annual contribution of $3,600. The contribution stays at $3,600. The market gain keeps climbing. The decade between year 10 and year 20 is where the account’s character changes from a savings vehicle into a compounding engine. Choosing to stop at year 10 means choosing to miss precisely that transformation.
Stopping at year 10 costs $156,000 in terminal wealth
Here is what happens when an investor reaches the crossover, decides “the account can grow itself now,” and stops contributing.
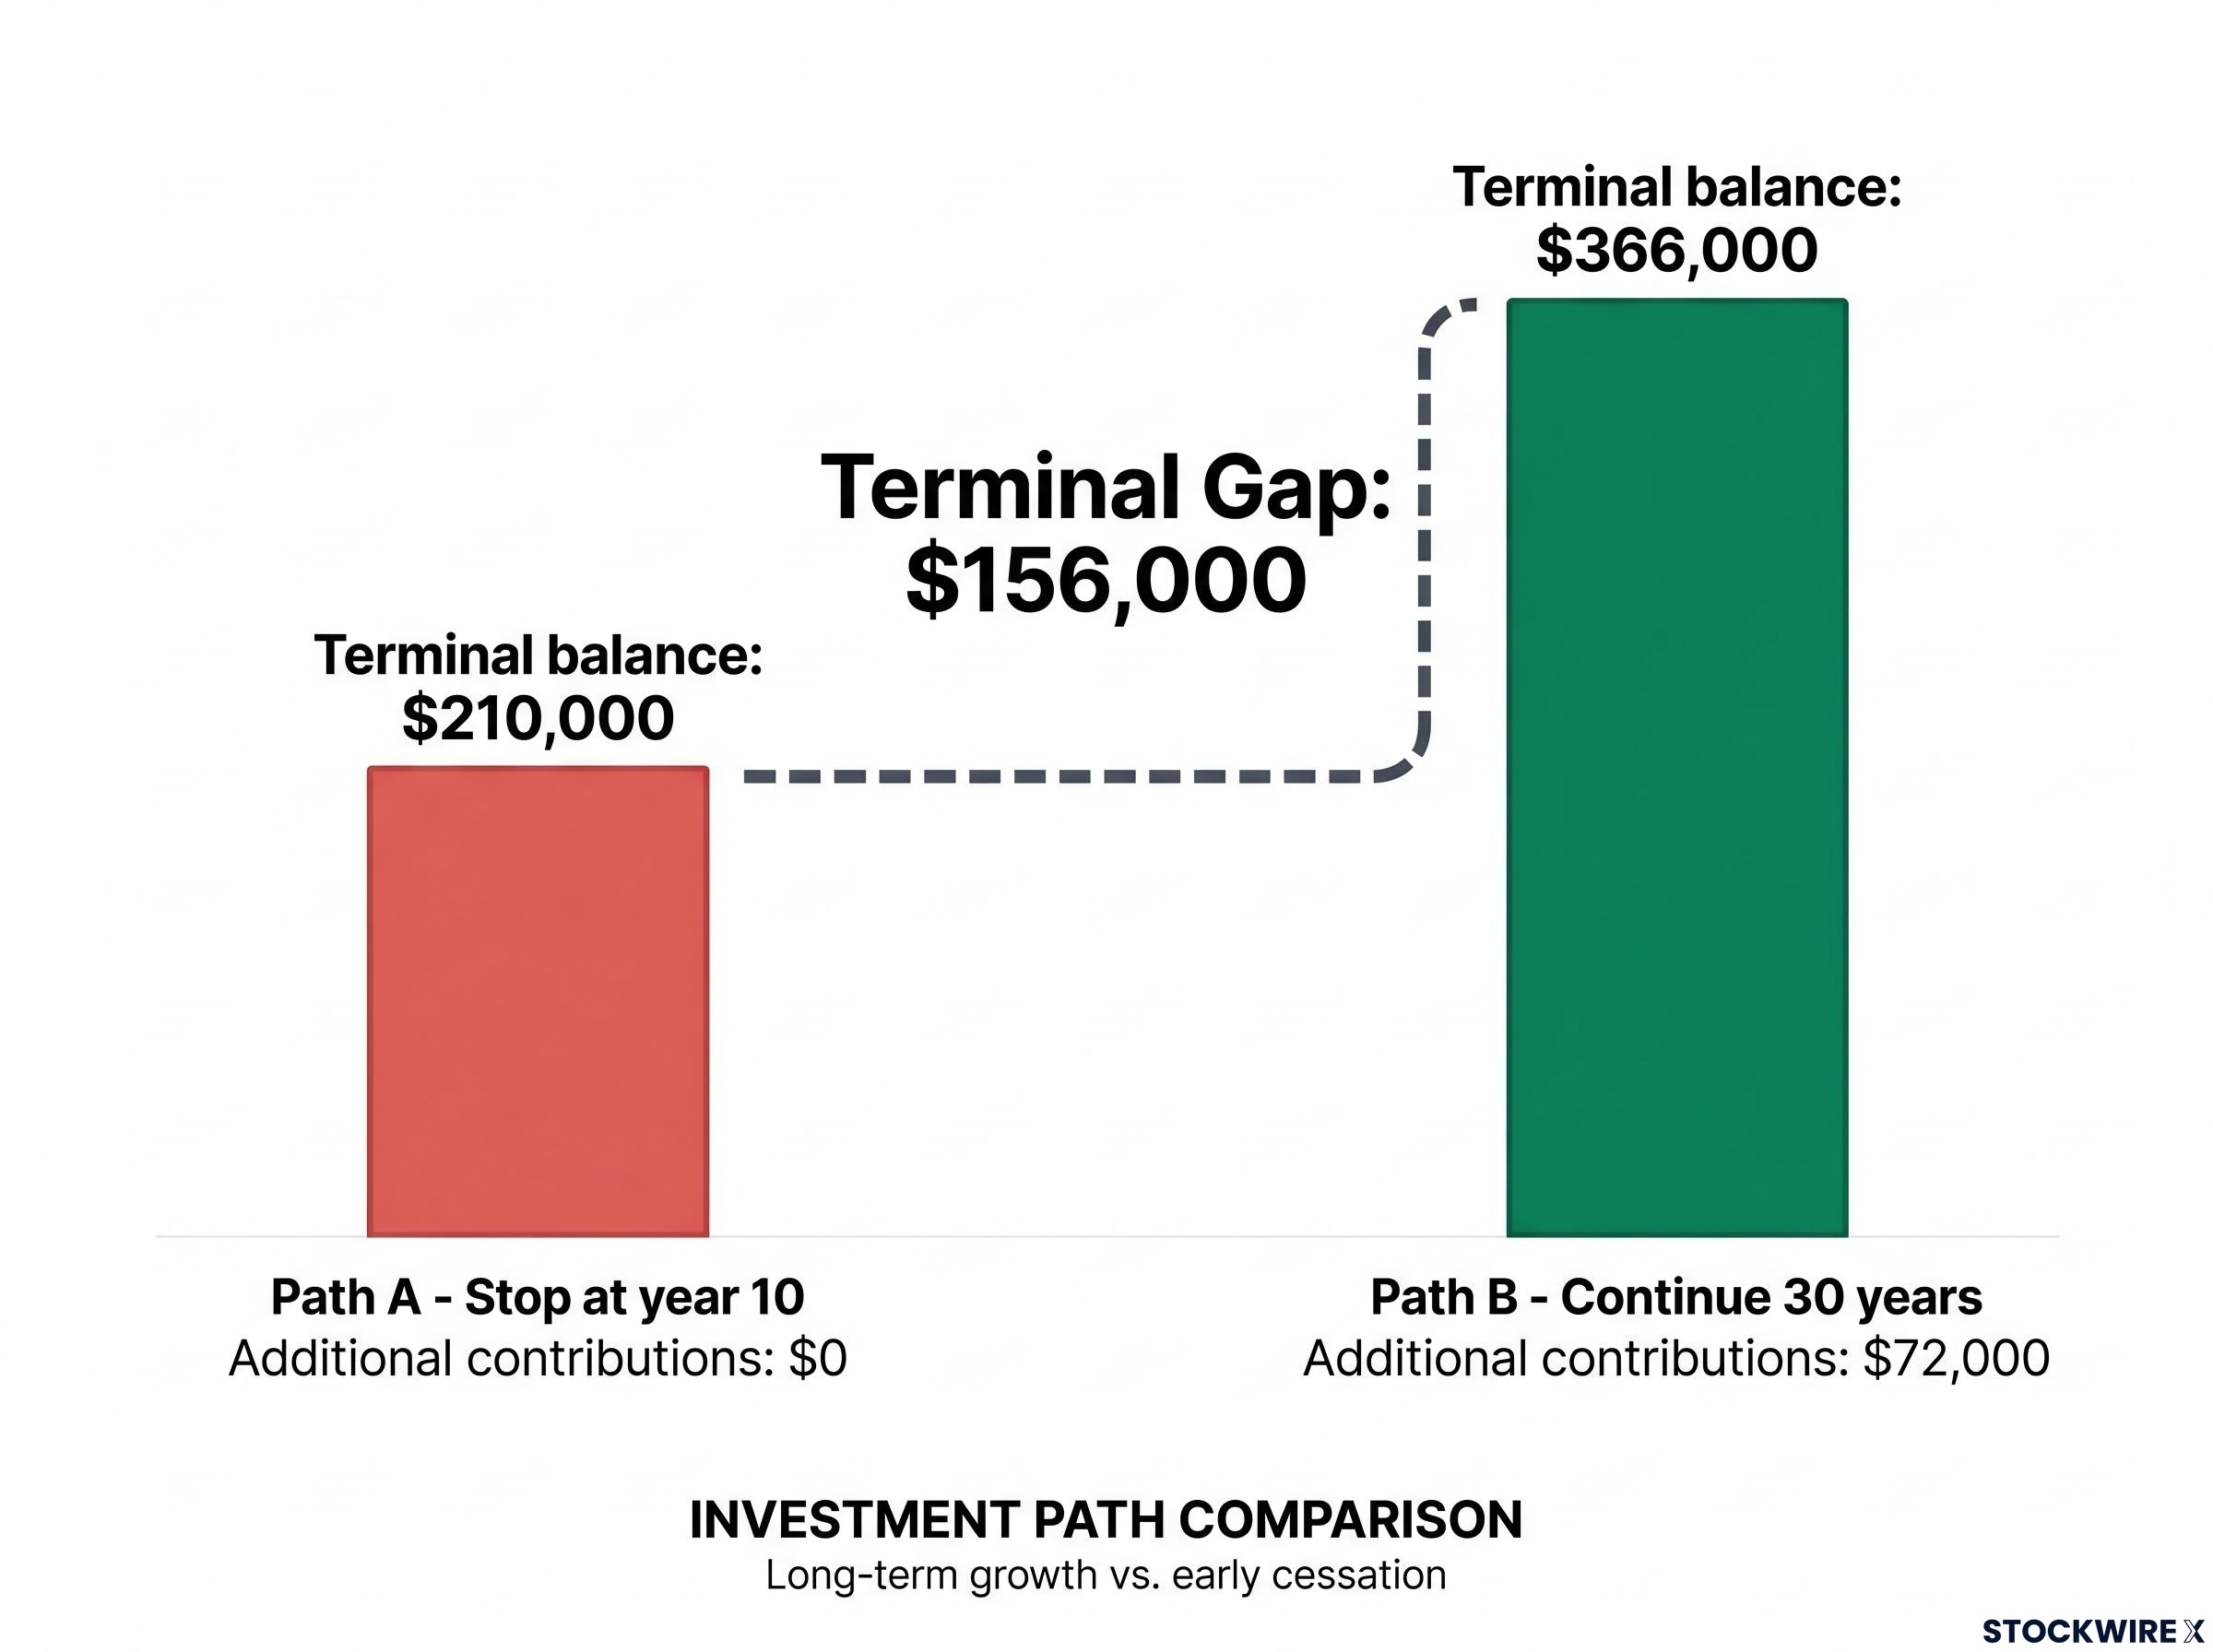
Path A: Stop contributing at year 10. Leave the $52,000 balance invested. It compounds at 7% for 20 more years with no additional deposits. Terminal balance at year 30: approximately $210,000.
Path B: Continue contributing $300 per month through the full 30 years. Terminal balance: approximately $366,000.
| Metric | Path A (stop at year 10) | Path B (continue 30 years) |
|---|---|---|
| Year 10 balance | $52,000 | $52,000 |
| Additional contributions made | $0 | $72,000 |
| Terminal balance at year 30 | $210,000 | $366,000 |
| Terminal gap | $156,000 | |
An investor who halts contributions at year 10 arrives at year 30 roughly $156,000 worse off than one who simply continued. The two portfolios held identical investments throughout. The difference came entirely from staying the course.
The $156,000 gap is not the cost of the missed contributions themselves, which total $72,000 in nominal terms over 20 years. It is the cost of those contributions not being present during the account’s peak compounding phase. The gap widens every year after stopping and never closes, because the missing deposits are absent from the highest-growth years of the account’s life.
Starting one year late costs nearly eight times the skipped contribution
The second mistake is quieter, easier to rationalise, and dollar for dollar even more punishing.
Forgoing $3,600 of contributions in year one strips those dollars of their full 30-year compounding runway. By the end of the horizon, that single skipped year translates to a loss of roughly $28,000, close to 8x the amount not invested. The short-term saving evaporates into a far larger long-term cost.
The cost of delaying a start is not linear: a five-year postponement on $100 monthly contributions at 7% erases roughly $20,400 from the terminal balance, a gap that cannot be closed by contributing more later because the compounding years themselves are non-recoverable.
The late-starter comparison makes the problem concrete. A 43-year-old contributing $600 per month for 15 years ends with approximately $190,000. A 28-year-old contributing $300 per month, half the monthly outlay, for 25 years reaches approximately $243,000. More money for fewer years could not match less money for more years.
| Metric | Early starter | Late starter | Catch-up required |
|---|---|---|---|
| Monthly contribution | $300 | $600 | $600 |
| Years contributing | 30 | 15 | 22 |
| Total personal capital | $108,000 | $108,000 | $155,000 |
| Terminal balance | $366,000 | $190,000 | $366,000 |
Replicating the early starter’s 30-year outcome requires the late starter to contribute roughly $600 per month across approximately 22 years, committing around $155,000 of personal capital against the early starter’s $108,000. The compounding model rewards time invested, and there is no mechanism to buy back years already elapsed.
Two specific timing decisions carry more weight than any allocation call:
- Start as early as possible. Even a single year’s delay has a disproportionate, permanent cost over multi-decade horizons.
- Persist well beyond the crossover point. The moment annual market gains exceed annual contributions is not a finish line. It is the start of the most valuable phase.
“I’ll start next year and contribute more” is a mathematical trade that almost always loses.
How fees, lower returns, and early withdrawals amplify both mistakes
The base case uses clean assumptions. Real portfolios have friction, and each source of friction does not simply add to the cost of timing errors. It compounds them.
Three frictions matter most:
- Fees: A 1% annual expense ratio reduces the 30-year terminal balance by approximately $65,000
- Lower returns: A 5% real return drops the terminal balance to approximately $250,000 and pushes the crossover to years 12-14
- Early withdrawals: Cashing out at year 12 (approximately $67,000) captures almost none of the acceleration between years 15 and 30
The compounding cost of fees
A 1% annual expense ratio on a 7% gross return leaves 6% net. Over 30 years, the terminal balance drops from approximately $366,000 to approximately $301,000, representing a drag of around $65,000, which amounts to close to 17% of the final pot.
Fees also delay the crossover. The crossover balance is effectively higher and reached later in the timeline. An investor who stops contributing at “around year 10” in a fee-burdened account is stopping even earlier in the true compounding arc than the base case implies.
What lower returns do to the crossover timeline
Dropping the assumed real return from 7% to 5% reduces the 30-year terminal balance to roughly $250,000 and pushes the crossover balance up from around $51,400 to closer to $72,000, with that threshold arriving somewhere in years 12-14 rather than at year 10. Annual returns are not smooth or consistent, though long-term averages in broad indices tend to stabilise the crossover dynamic.
What this means for you: investors tempted to stop at a fixed year 10 are stopping progressively earlier relative to their actual crossover point as returns fall.
Why early withdrawals are irreversible, not just inconvenient
Pausing contributions is recoverable. Withdrawing the base is not. Unlike stopping deposits, a withdrawal shrinks the balance itself, permanently lowering all subsequent compounding. There is no recovery path that restores the lost timeline.
Market timing costs operate on the same back-loaded compounding logic: missing just 10 of the S&P 500’s best trading days over a decade can reduce a $272,000 portfolio to $153,000, because the best recovery days cluster immediately after the worst drawdowns and are structurally impossible to capture while out of the market.
An investor needing funds at year 12 would exit at approximately $67,000, early in the growth curve and well before peak compounding. Restarting later means beginning from a smaller base with fewer years remaining. The damage compounds across each dimension: an investor who starts late, stops early, pays 1% in fees, and takes an early withdrawal does not suffer additive damage. They suffer compounding damage.
What the calendar decides that contribution size cannot override
The two mistakes waste time in different ways. Stopping early wastes the peak phase you already built. Starting late wastes the foundation that makes the peak possible. Both are more expensive than any individual investment decision you are likely to face.
If you are somewhere in the middle of a long investment horizon, and most readers are, the question to ask is where you sit relative to the crossover. If you have not reached it yet, urgency matters most: the clock is still building the base. If you have passed it, persistence matters most: the compounding engine is running, and your job is to keep feeding it.
Three supporting rules protect the timeline:
- Keep costs low. A 1% annual fee costs more than 17% of terminal wealth over 30 years.
- Avoid tapping long-term investments for short-term needs. Early withdrawals permanently destroy the base on which future compounding operates.
- If starting late, recalibrate honestly. Accept the need for higher and more sustained contributions. There is no shortcut that fully replaces lost time, but calibrated expectation and higher sustained contribution is the right response, not abandonment.
Late starts cannot be fully remedied. The honest answer is that some of the gap is permanent. What you can control is whether the remaining years are used at full capacity.
For readers wanting to see how the passive compounding framework compares against active trading strategies over the same horizon, our deep-dive into the 30-year passive investing verdict models identical $1,000 monthly contributions across day trading, swing trading, and passive index investing, with terminal balances that illustrate the full opportunity cost of active approaches.
This article is for informational purposes only and should not be considered financial advice. Investors should conduct their own research and consult with financial professionals before making investment decisions. Past performance does not guarantee future results. Financial projections are subject to market conditions and various risk factors.