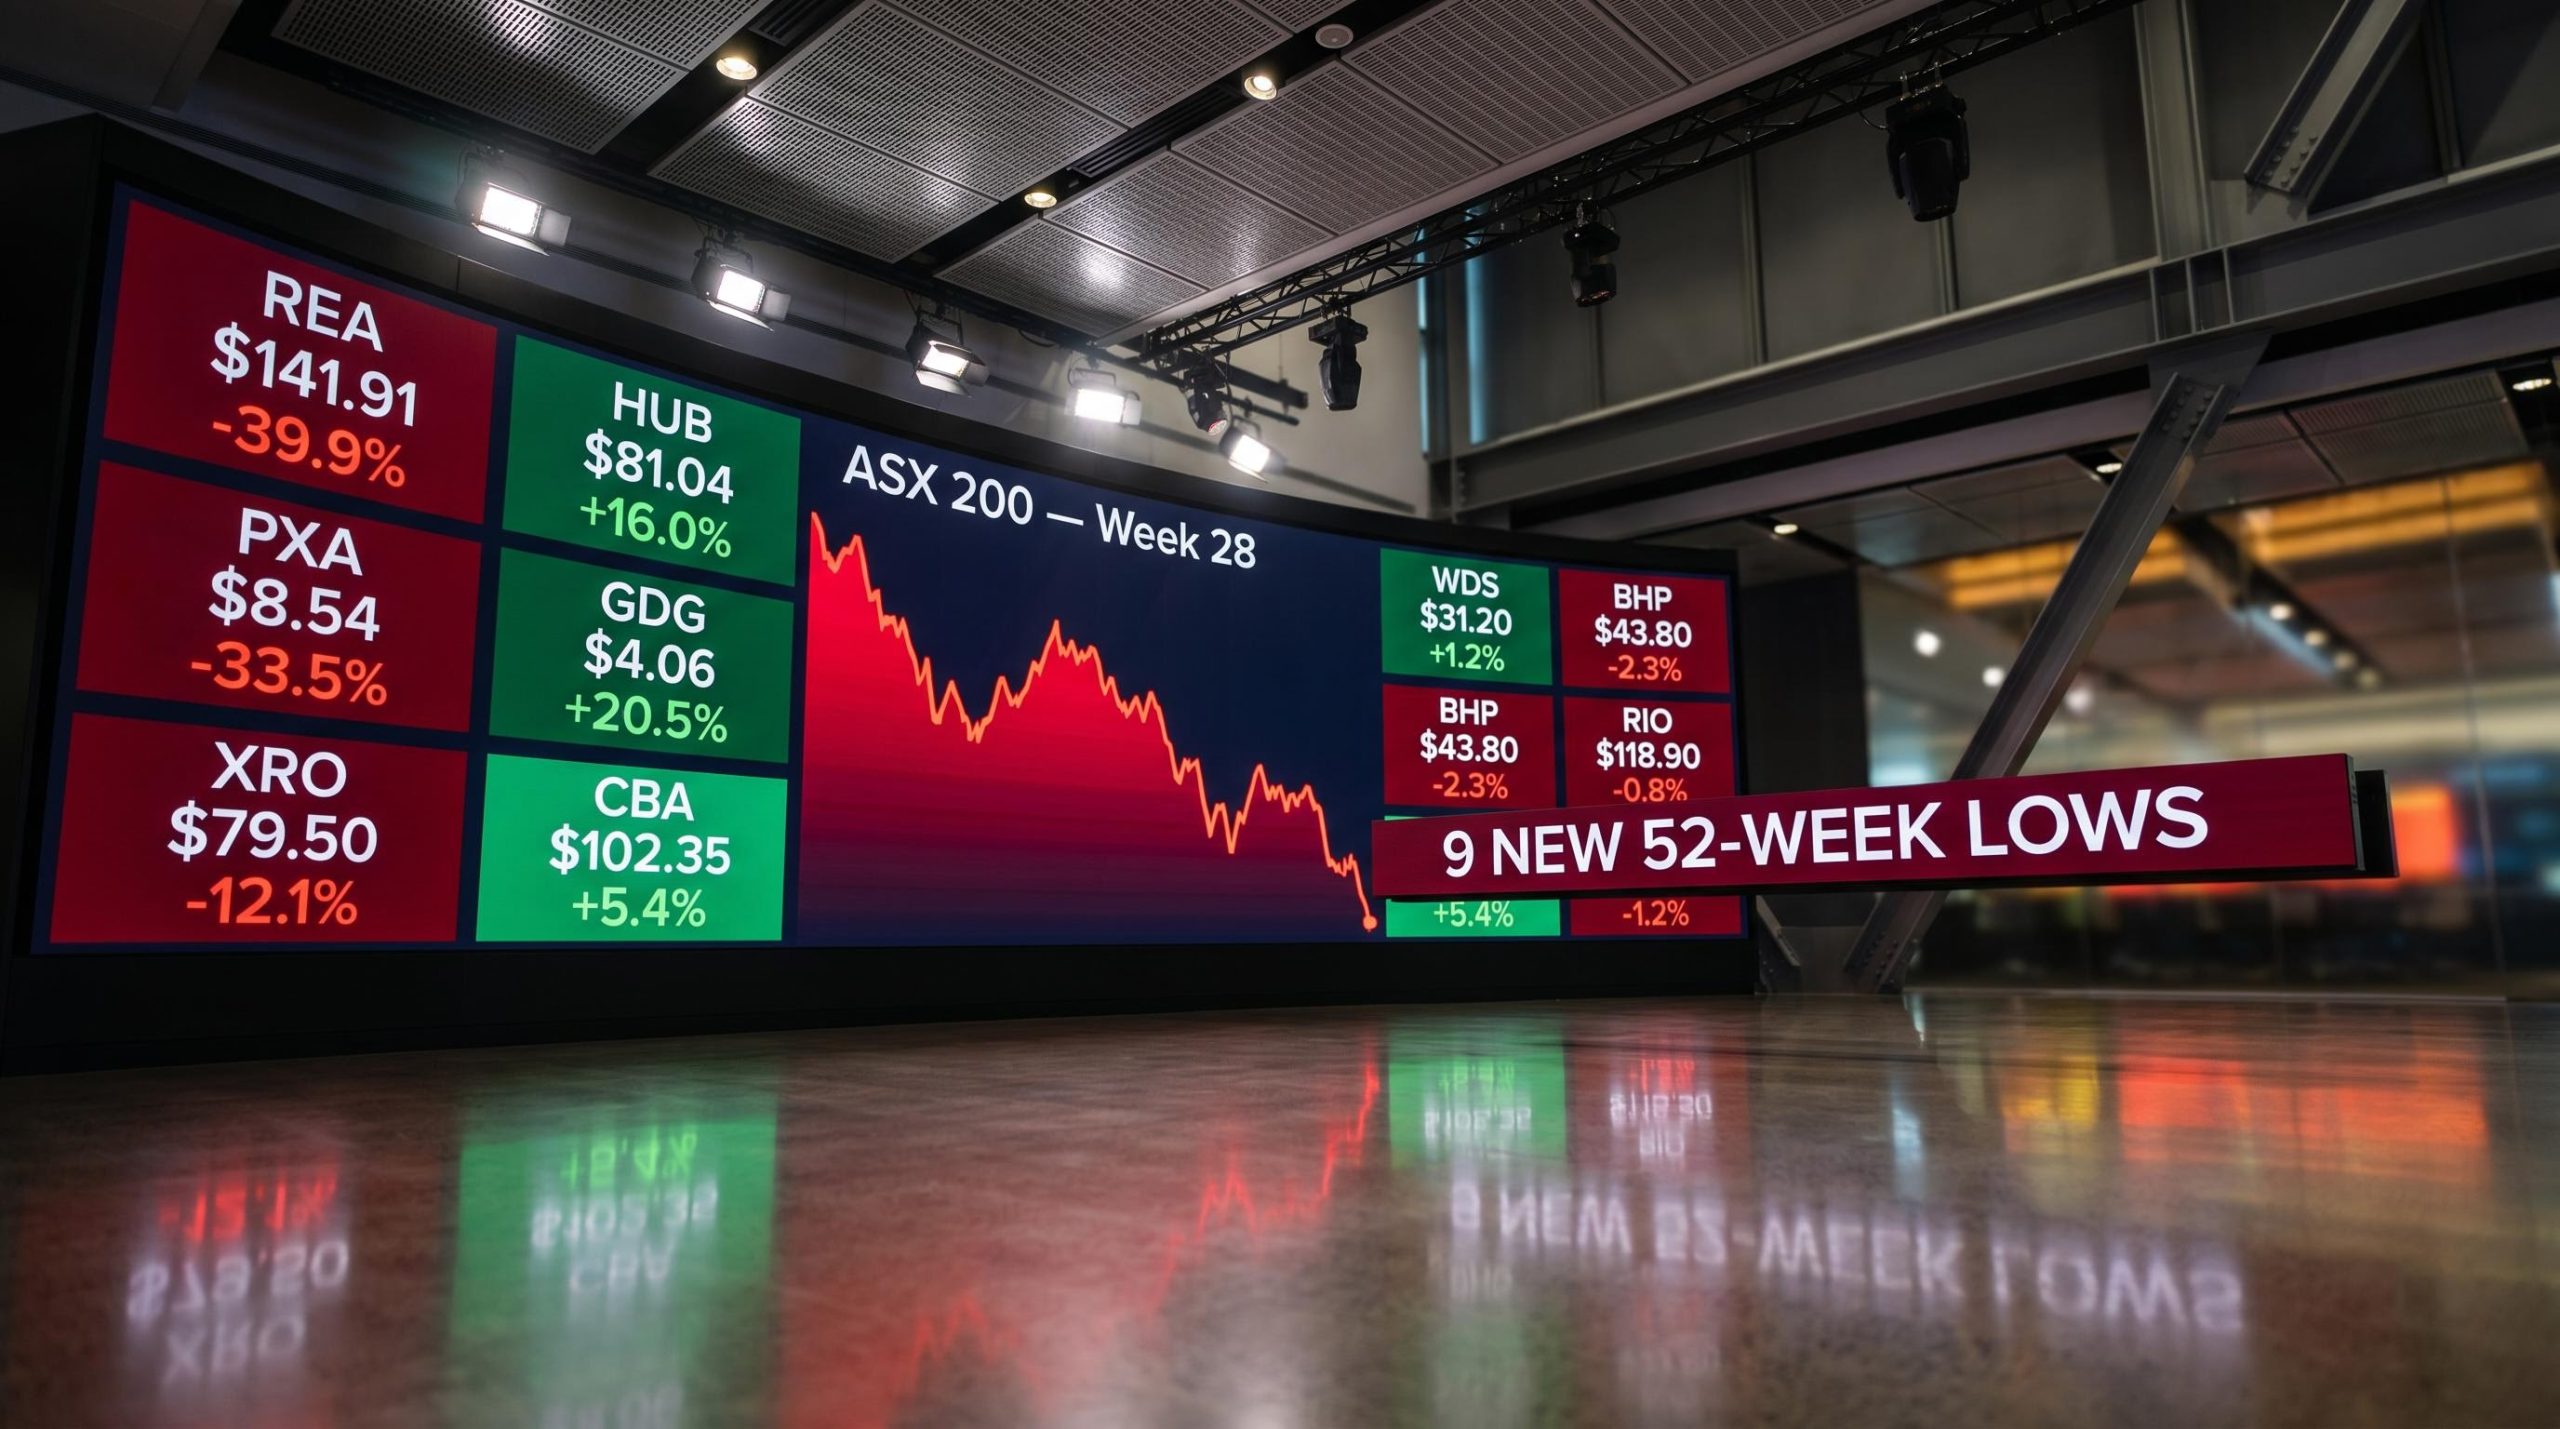
Nine ASX 200 stocks hit new 52-week lows last week. Six of them finished the week higher. That combination sounds like good news, but for most of these stocks, it almost certainly is not.
The week ending 3 July 2026 produced a striking divergence: Generation Development Group surged 20.5%, Hub24 jumped 16.0%, and REA Group added 6.3%, yet all three simultaneously printed new annual lows. This is the pattern of a market where sharp short-term moves are happening inside longer, unresolved downtrends. The S&P/ASX 200 has largely traded sideways in 2026, clawing back losses from an April drawdown without managing to establish a clear upward trend. In that environment, stocks still making new lows are exhibiting clear relative weakness that one good week does not fix.
Here is every stock on the list, the sectors under pressure, and a practical framework for deciding which of these bounces deserves a second look and which you can set aside.
Nine ASX 200 stocks that printed new annual lows in Week 28
| Stock | Ticker | Sector | Close Price | Weekly Return |
|---|---|---|---|---|
| REA Group | REA | Communication Services | $141.91 | +6.3% (1-yr: -39.9%) |
| Pexa Group | PXA | Real Estate | $8.54 | -16.4% (1-yr: -33.5%) |
| Karoon Energy | KAR | Energy | $1.40 | +10.7% (1-yr: -27.7%) |
| Austal | ASB | Industrials | $4.19 | +2.0% (1-yr: -26.9%) |
| Pantoro Gold | PNR | Materials | $2.39 | -0.4% (1-yr: -26.7%) |
| Generation Development Group | GDG | Financials | $4.06 | +20.5% (1-yr: -20.6%) |
| Elders | ELD | Consumer Staples | $5.30 | +5.6% (1-yr: -17.1%) |
| Hub24 | HUB | Financials | $81.04 | +16.0% (1-yr: -15.5%) |
| Origin Energy | ORG | Utilities | $10.36 | -5.5% (1-yr: -9.4%) |
1. REA Group (REA)
Closed at $141.91, up 6.3% for the week, down 39.9% over the past year. A 6% bounce barely registers against a nearly 40% annual decline. Communication Services recorded zero new 52-week highs during Week 28, confirming no sector-level recovery to support the move.
2. Pexa Group (PXA)
Pexa is the only stock on this list combining a new 52-week low with a large weekly decline of 16.4%. This is not a bounce inside a hole. This is ongoing, accelerating selling pressure with no sign of a floor.
Closed at $8.54, down 16.4% for the week, down 33.5% over the past year. Real Estate produced zero new highs during the week.
3. Karoon Energy (KAR)
Closed at $1.40, up 10.7% for the week, down 27.7% over the past year. A strong weekly pop, but the Energy sector recorded zero new 52-week highs in Week 28. No sector-level confirmation backs the bounce.
4. Austal (ASB)
Closed at $4.19, up 2.0% for the week, down 26.9% over the past year. A modest uptick with no identifiable catalyst. This looks like a continuation of a grinding downtrend rather than an inflection point.
5. Pantoro Gold (PNR)
Closed at $2.39, down 0.4% for the week, down 26.7% over the past year. Making new lows in a broadly supportive gold price environment is a telling signal. When the commodity tailwind is there and the stock still cannot catch a bid, the issue is company-specific, not macro.
6. Generation Development Group (GDG)
Closed at $4.06, up 20.5% for the week, down 20.6% over the past year. The largest weekly gain on the entire list, consistent with an intra-week capitulation-and-recovery pattern. Financials produced three new 52-week highs in the same week, making a catalyst-backed move here more plausible than in uniformly weak sectors.
7. Elders (ELD)
Closed at $5.30, up 5.6% for the week, down 17.1% over the past year. Agricultural exposure places Elders in a distinct sub-segment facing headwinds that the broader Consumer Staples category does not share. Staples showed two new highs and one new low during the week, reflecting internal dispersion.
8. Hub24 (HUB)
Closed at $81.04, up 16.0% for the week, down 15.5% over the past year. The shallowest annual decline on the list paired with the second-largest weekly gain, occurring in a sector simultaneously producing new 52-week highs. This is the most constructive combination of signals among all nine stocks.
9. Origin Energy (ORG)
Closed at $10.36, down 5.5% for the week, down 9.4% over the past year. Continued selling in a stock classified as defensive is incongruous. Utilities produced zero new 52-week highs during the week, reinforcing downside bias across the sector.
When big ASX news breaks, our subscribers know first
What a 52-week low actually tells you (and what it does not)
A 52-week low means a stock is trading at the worst price over the past year. That confirms relative underperformance versus the broader market, but on its own it says nothing about whether the stock is about to recover or continue falling.
The distinction that matters is whether a stock is cheap because it is temporarily out of favour, where the business itself is intact and the market has overreacted, or cheap because the business is structurally impaired, where the declining price accurately reflects deteriorating fundamentals. That is the core investor discipline when reading any 52-week low list.
ACFR research on 52-week low predictive power finds that nearness to annual lows carries independent predictive value for future returns, a finding that supports applying stock-by-stock scrutiny rather than treating every bounce from a new low as equivalent.
When you see a stock on this list, ask yourself:
- Is the broader market also falling, or is this stock declining while the index recovers?
- Does the stock’s sector show any offsetting strength, or is the entire sector weak?
- Is there an identifiable catalyst for a bounce, or is it purely technical?
- How deep is the annual drawdown, and does one strong week materially change the picture?
The ASX 200 being roughly flat year-to-date makes Week 28’s new lows a louder signal than usual. These nine stocks did not participate in the broader recovery from the April sell-off. That relative weakness matters when you are deciding where to allocate capital.
ASX breadth deterioration was already visible in early May 2026, when 22 index constituents hit fresh 52-week lows in a single week against a headline index loss of just 0.65%, a divergence that foreshadowed the concentrated sector stress still visible in Week 28.
Where sector pressure is concentrated, and where it is not
| Sector | New 52-Week Highs | New 52-Week Lows | Stocks at New Lows |
|---|---|---|---|
| Financials | 3 | 2 | HUB, GDG |
| Materials | 2 | 1 | PNR |
| Consumer Staples | 2 | 1 | ELD |
| Technology | 2 | 0 | |
| Industrials | 1 | 1 | ASB |
| Energy | 0 | 1 | KAR |
| Real Estate | 0 | 1 | PXA |
| Communication Services | 0 | 1 | REA |
| Utilities | 0 | 1 | ORG |
| Discretionary | 0 | 0 | |
| Health Care | 0 | 0 |
The pattern of zeros in the new highs column is the key finding. Energy, Real Estate, Communication Services, and Utilities each recorded one new low with zero new highs. If a stock bounces while its entire sector continues to produce new lows with no offsetting highs, that bounce is working against the grain of every other stock in the same group. That asymmetry should make you cautious about reading it as a trend change.
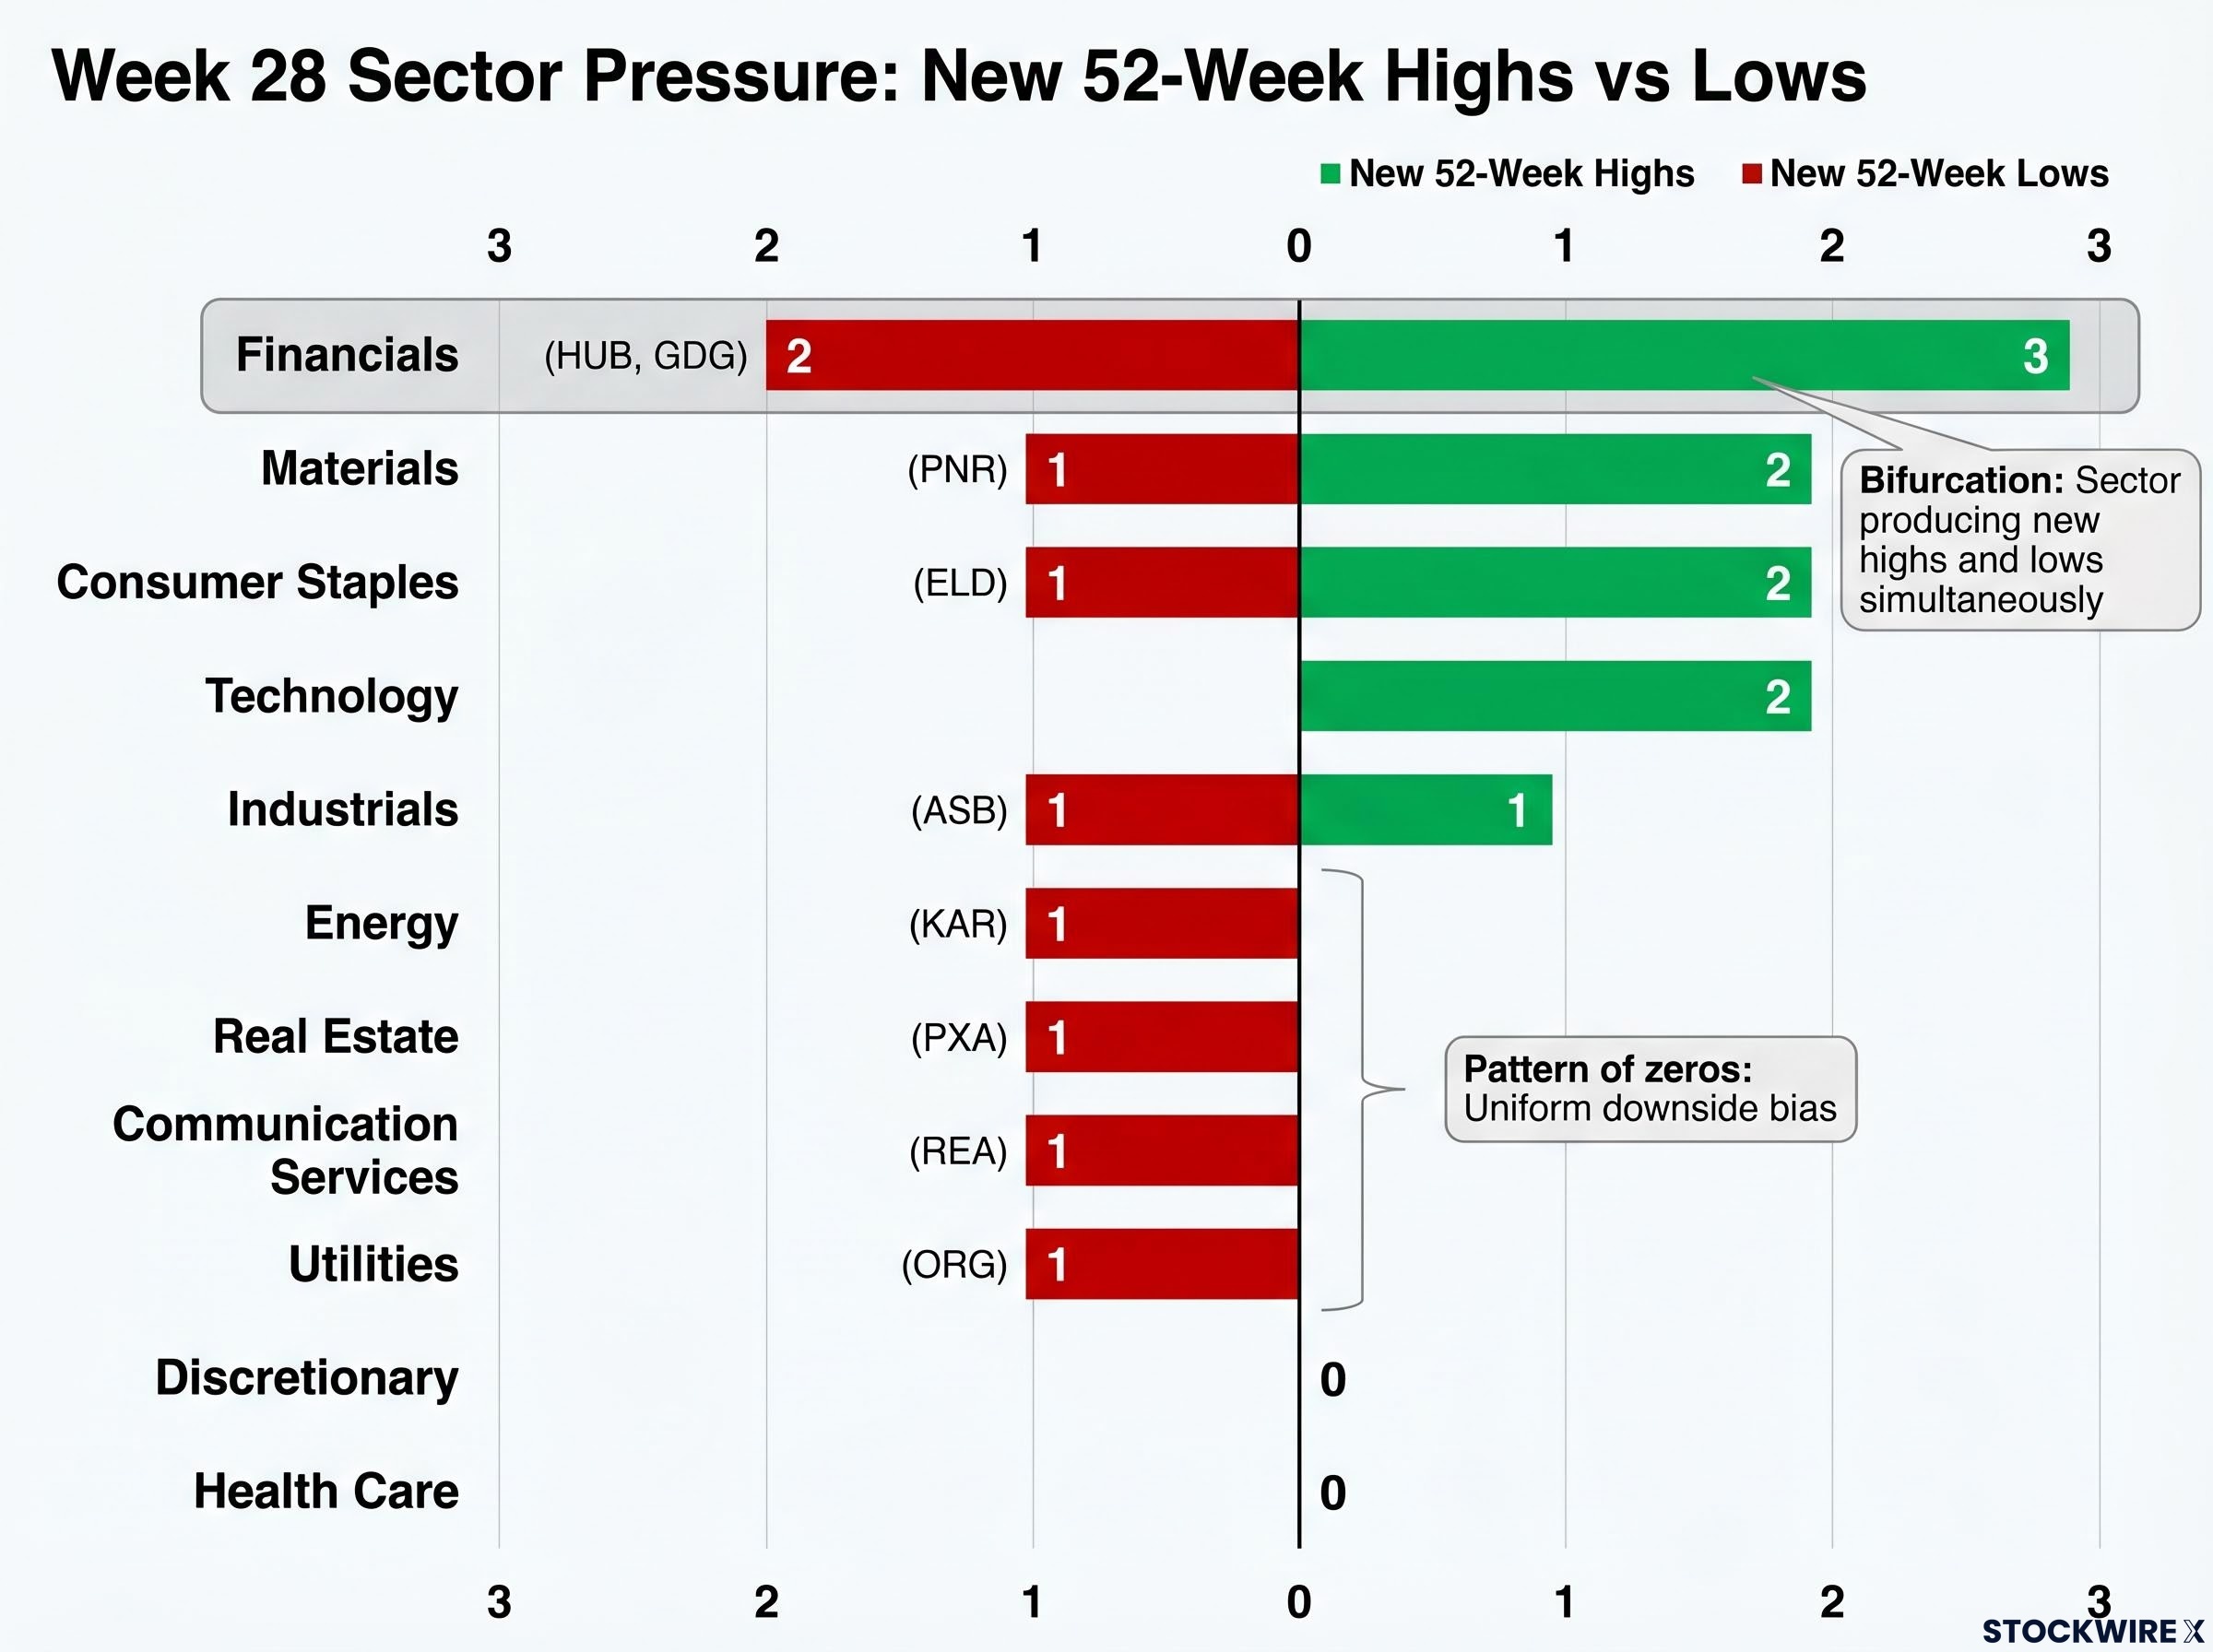
Financials stands apart. Three new 52-week highs and two new 52-week lows in the same sector during the same week. That bifurcation means Hub24 and GDG’s bounces are occurring inside a sector that simultaneously contains stocks making new highs, a far more constructive backdrop for a potential reversal than anything Energy or Real Estate offered.
Technology, Discretionary, and Health Care produced zero new lows. These previously pressured areas appear to have stabilised, no longer generating fresh annual lows even if they are not yet leading the market higher.
Dead-cat bounce or genuine reversal? Four signals to check
A dead-cat bounce is a brief recovery in a stock’s price after a large decline, followed by a resumption of the downtrend. The name comes from the uncomfortable idea that even a dead cat will bounce if it falls far enough. The question for every stock on this week’s list is whether its move is that kind of bounce or something more durable. Here are four criteria to check, starting with the most accessible.
The instinct toward buying the dip after a large weekly move is where most investors make their most expensive analytical error: the move looks like an entry point when it is actually a sentiment-driven bounce inside a structurally deteriorating asset.
- Sector context. You already have this from the table above. A bounce in a sector producing zero new highs (Energy, Real Estate, Communication Services, Utilities) lacks sector-level corroboration. A bounce in Financials, where three new highs appeared in the same week, has a more constructive backdrop.
- Catalyst quality. Weekly gains of 20.5% (GDG), 16.0% (HUB), and 10.7% (KAR) are more credible as early reversals if tied to identifiable fundamentals: earnings beats, guidance upgrades, or strategic developments. Without these, the moves are more likely short-covering, where traders who had bet against the stock buy shares to close their positions, pushing the price up temporarily.
- Drawdown depth. Stocks with one-year declines above 25% (REA at -39.9%, PXA at -33.5%, KAR at -27.7%, ASB at -26.9%, PNR at -26.7%) carry a statistically higher burden of proof that a single strong week signals a genuine turn. HUB (-15.5%) and GDG (-20.6%) sit in a more moderate range where catalyst-backed bounces could mark valuation repair rather than a dead-cat pattern.
- Price structure and volume. A strong weekly close near the top of the week’s range after setting a new low suggests buying conviction rather than indiscriminate selling exhaustion. High volume on the reversal week is more consistent with genuine demand entering. Low volume favours the dead-cat interpretation.
The core discipline: distinguish between “cheap because temporarily out of favour” and “cheap because structurally impaired.” This framework does not give you a definitive answer for each stock. It helps you decide which names justify spending time on deeper fundamental research and which you can set aside.
For investors wanting a repeatable framework to apply before committing capital to any of the names above, our dedicated guide to classifying any market selloff walks through the three-category test that separates irrational overreactions from temporary setbacks and structural disruptions.
The watch-list shortlist: two names that warrant closer attention
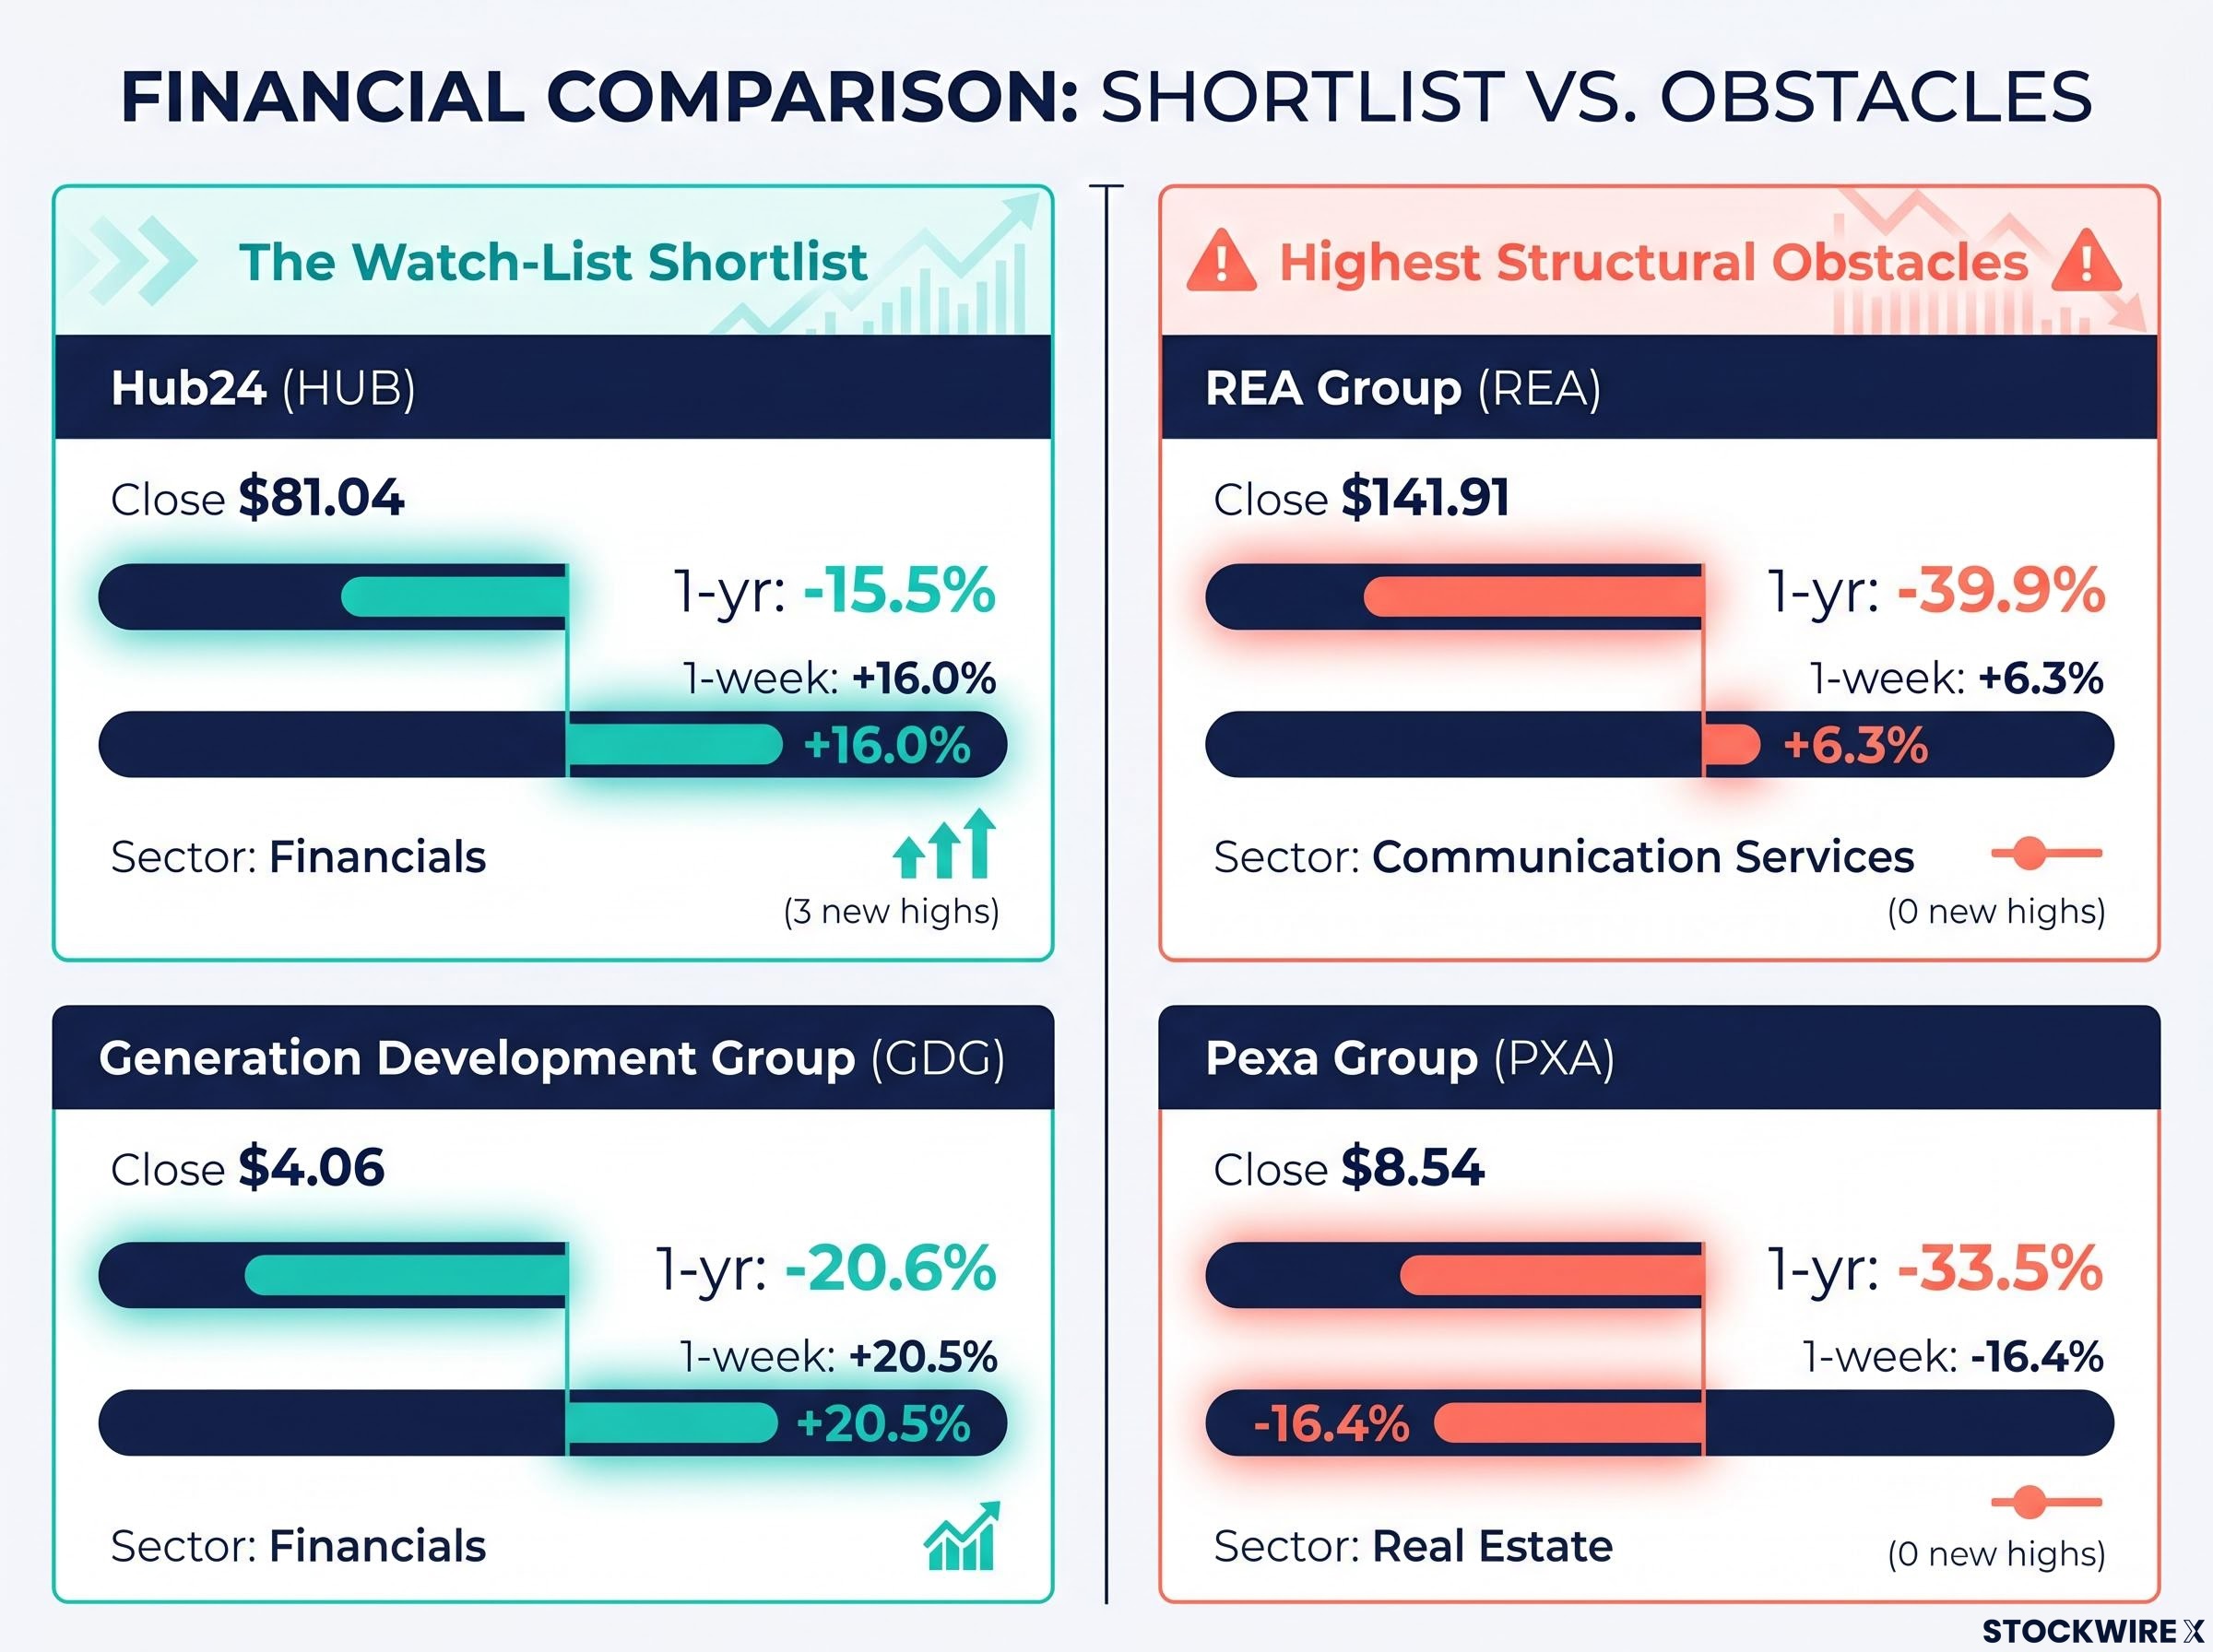
This is not a buy recommendation. It is an identification of the two stocks where the combination of moderate drawdown, large bounce, and sector context clears the bar for deeper fundamental research. The other seven names carry higher structural obstacles that one good week does not resolve.
Hub24 (HUB)
Hub24 presents the most constructive combination of signals on the entire list:
- Shallowest annual decline at -15.5%, meaning less ground to recover
- Second-largest weekly gain at +16.0%, showing material buying interest
- Financials sector produced three new 52-week highs in the same week, providing a supportive sector backdrop
What would need to be verified: whether the bounce is backed by a specific catalyst (earnings momentum, platform growth, or a strategic development) rather than purely technical short-covering. If the catalyst is there, this is the name on the list where a valuation gap could realistically begin to close.
Generation Development Group (GDG)
GDG posted the largest weekly gain on the list at +20.5%, consistent with an intra-week capitulation-and-recovery pattern where selling pressure exhausted itself and buyers stepped in:
- Annual decline of -20.6% sits in the moderate range, not the deep-drawdown category
- The +20.5% weekly move is the biggest reversal of all nine stocks
- Financials sector context is supportive, though not confirming on its own
The critical caveat: a move this large is only meaningful if tied to identifiable news. Without a specific catalyst, a 20% bounce inside a 20% hole is more likely noise than signal. Verify first.
By contrast, REA (-39.9%) and PXA (-33.5%) sit at the other end of the spectrum. Their structural obstacles to recovery are the highest on the list, and neither stock’s sector produced any offsetting strength during the week.
What Week 28’s lows tell you about where ASX 200 pressure is sitting right now
Nine stocks hitting new 52-week lows while the ASX 200 sits roughly flat year-to-date tells you something specific: the market’s unresolved problems are concentrated, not widespread. The stress is sitting in Energy, Real Estate, Communication Services, and Utilities, sectors that produced zero new highs alongside their new lows. The ASX 200 retraced its April losses and moved broadly sideways from there; these nine stocks were left behind throughout that process.
The sharp weekly bounces in several names are consistent with short-term exhaustion in individual stocks rather than a coordinated turn. Most of these moves remain unproven counter-trend rallies requiring stock-by-stock verification before any allocation decision.
Three takeaways from Week 28:
- Sector concentration matters more than individual bounces. Four sectors showed uniform downside bias with no internal offsetting strength. Bounces inside those sectors carry a higher burden of proof.
- Hub24 and GDG are the two names where deeper fundamental research is most likely to yield a useful answer, based on their combination of moderate drawdowns, large weekly gains, and a Financials sector that is simultaneously producing new highs.
- A 52-week low in a flat market is a louder signal than in a falling one. These stocks failed to participate in the recovery that lifted the rest of the index. That relative weakness is the most useful data point for your allocation decisions going forward.
For investors ready to act on any of these names, our full explainer on investing during a market pullback covers the personal audit of income stability, portfolio concentration, and capital horizon that should precede any deployment decision.
This article is for informational purposes only and should not be considered financial advice. Investors should conduct their own research and consult with financial professionals before making investment decisions. Past performance does not guarantee future results.