
Box CEO Aaron Levie ran a technology company for two decades. During that time, he watched his engineering team standardise on databases, cloud services, and storage vendors. If he had simply bought equity in those vendors, the portfolio would have matched major market indexes.
He was living inside the investment thesis the entire time. He never made the trade.
Most retail investors default to the same research loop: earnings calls, revenue multiples, analyst upgrades. All of those are outputs. Developer adoption is an input, and inputs move first. Engineers picking tools today are building the sticky, recurring revenue that analysts will trumpet in eighteen months’ time. The early signal has already done its work long before the initiation report hits anyone’s inbox.
Here is a practical framework for turning the tools you already use, or watch others use, into an earlier investment signal than conventional research typically provides. Whether you write code for a living or simply rely on software to do your job, this approach converts professional observation into a structured watchlist process you can start this week.
Why the tools engineers choose reveal what the market has not priced yet
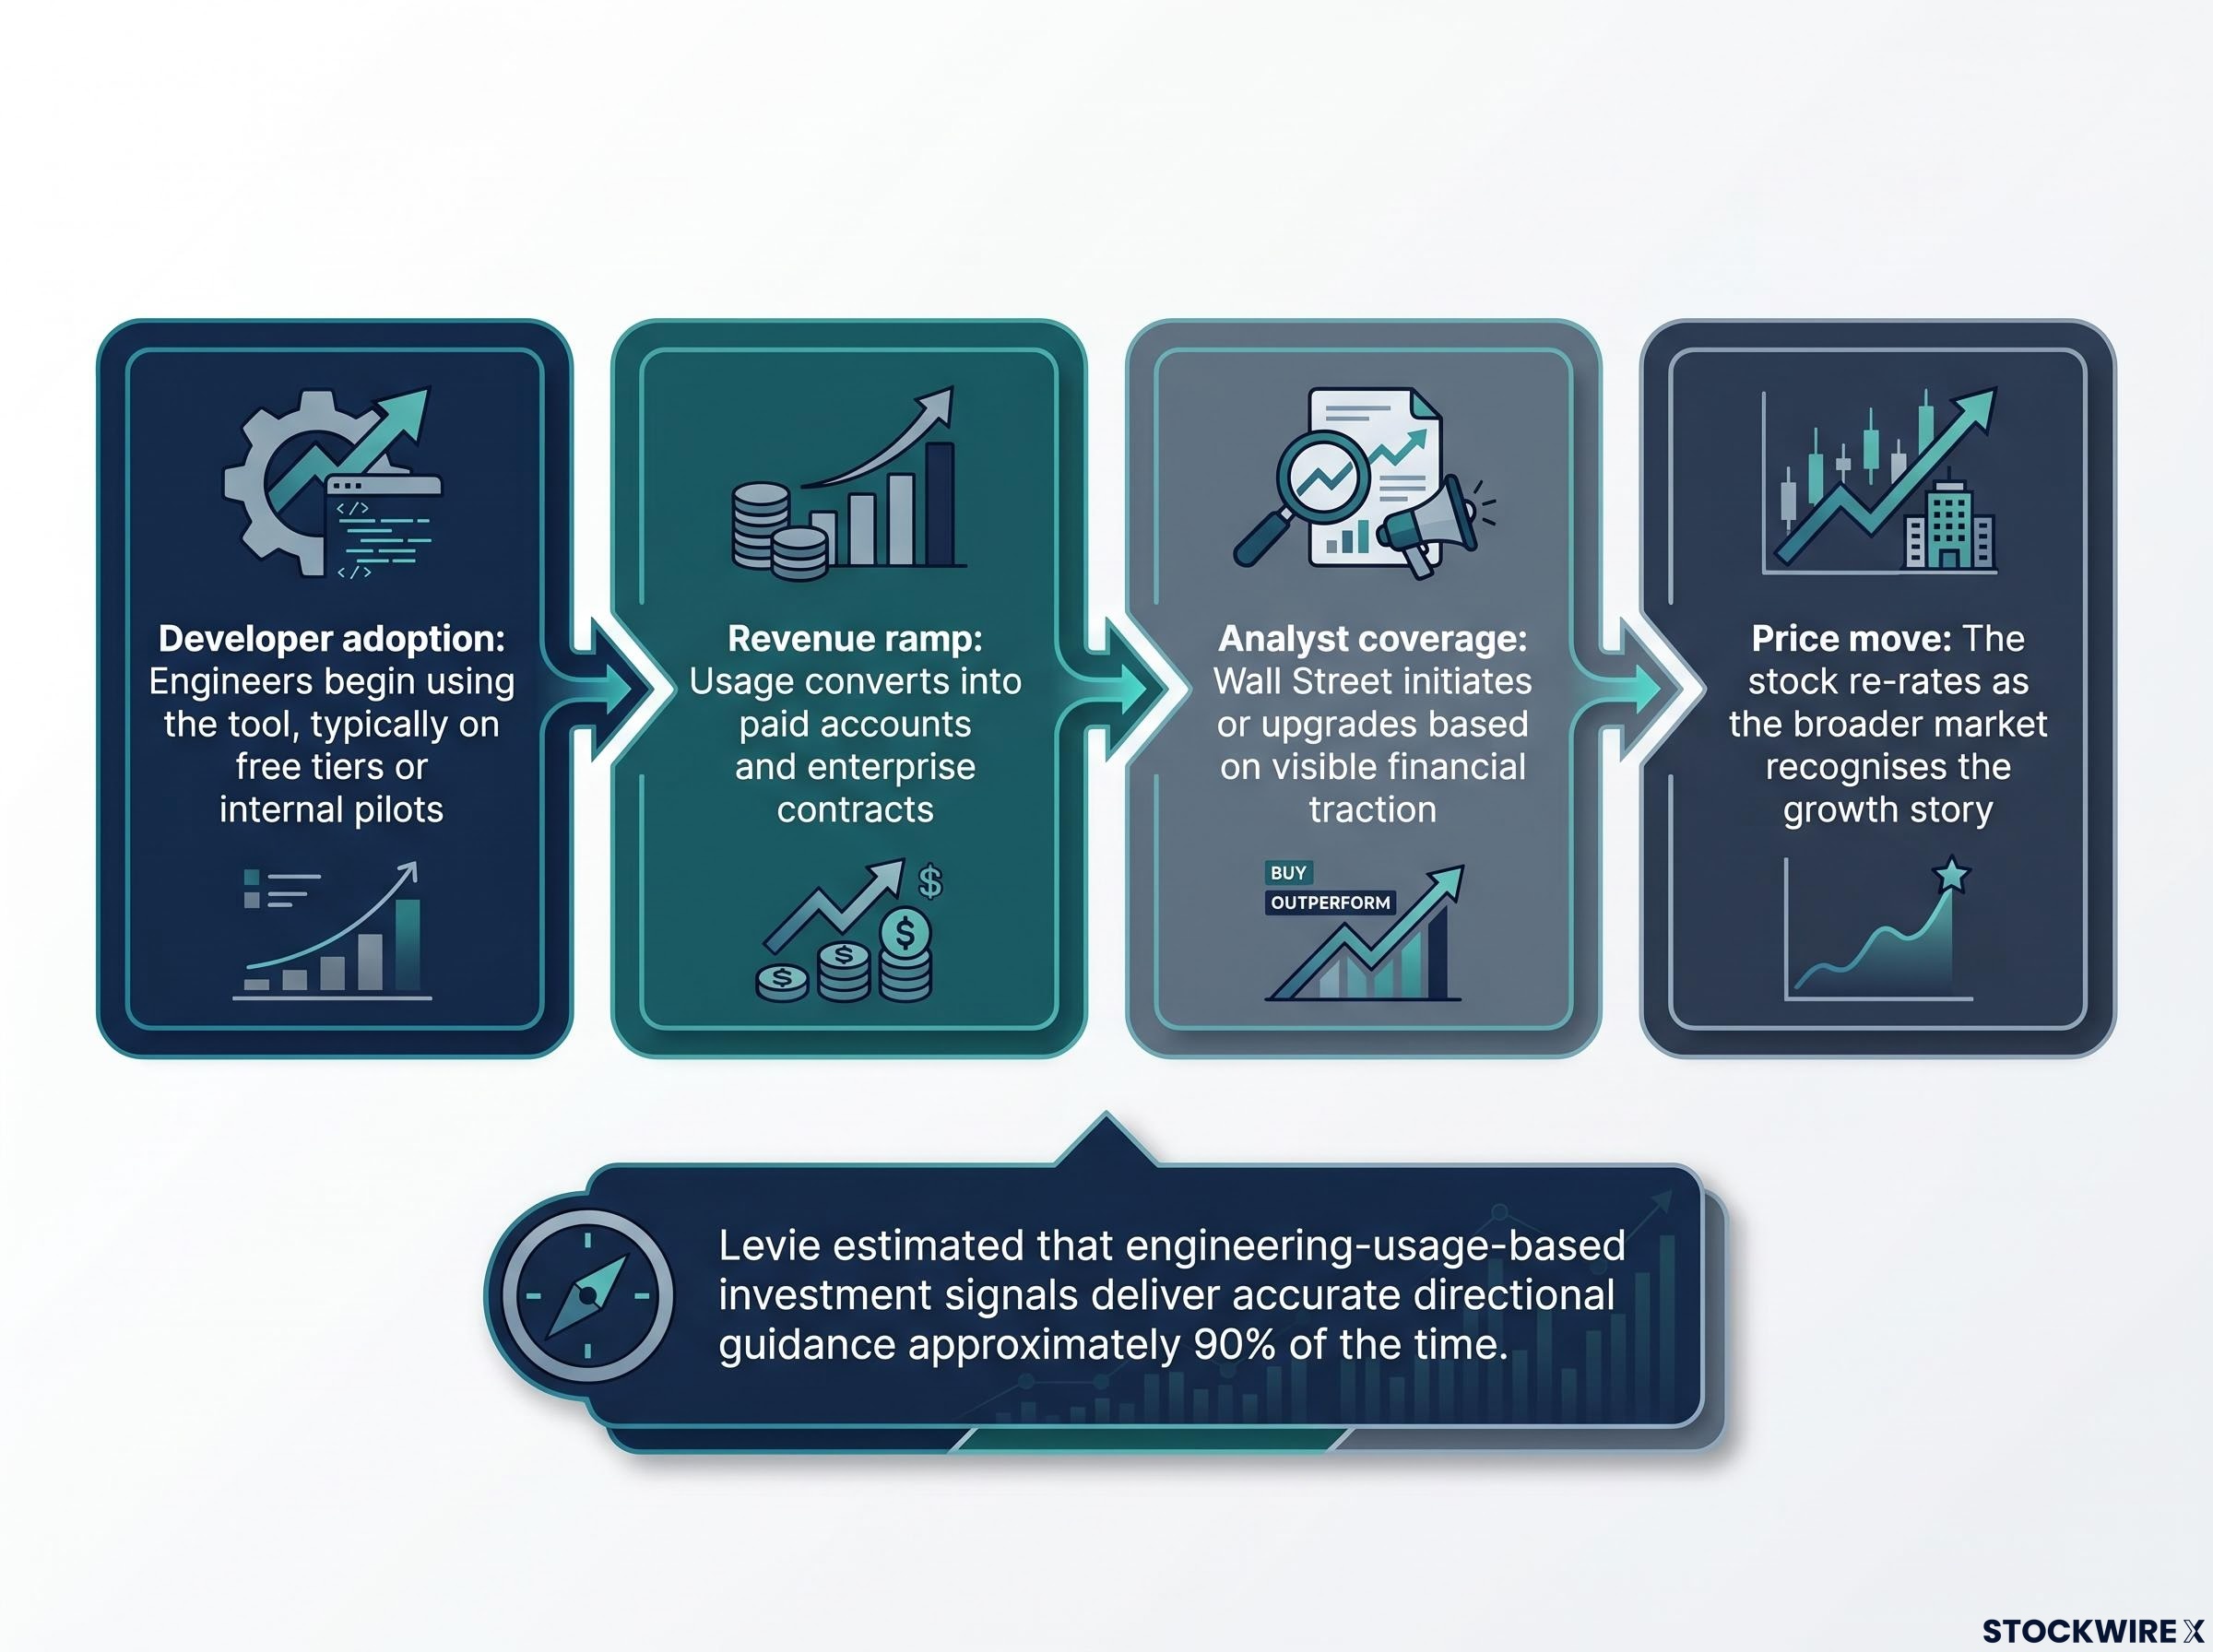
There is a predictable sequence at work, and it creates a structural timing advantage for those paying attention. Engineers settle on a tool. Usage scales. Revenue ramps. Analysts initiate coverage. The stock moves. Each stage follows the one before it with a lag, and most retail investors only arrive at the very last stage.
The reason the signal persists is switching costs. Once a team commits to a database, a CI/CD platform (a system that automates code testing and deployment), or a cloud provider, migrating away is painful: data migration, downtime risk, retraining, organisational overhead. That stickiness supports durable, recurring revenue for the vendor. It is structurally different from a one-off product sale.
Then the compounding effect takes over. When a tool becomes the default, it attracts integrations, tutorials, job market demand, and third-party plugins that make displacement progressively harder. The ecosystem itself becomes a moat.
The adoption-to-price sequence moves through four stages:
- Developer adoption: Engineers begin using the tool, typically on free tiers or internal pilots
- Revenue ramp: Usage converts into paid accounts and enterprise contracts
- Analyst coverage: Wall Street initiates or upgrades based on visible financial traction
- Price move: The stock re-rates as the broader market recognises the growth story
Levie estimated that engineering-usage-based investment signals deliver accurate directional guidance approximately 90% of the time.
He pointed to Seagate and Western Digital as storage vendors he relied on for years and acknowledged as missed investment opportunities. The implication is clear: an investor who only tracks earnings calls and analyst initiations is already behind the curve by the time a tool features prominently in those outputs. The engineer who noticed the adoption twelve months earlier held the stronger read.
When big ASX news breaks, our subscribers know first
You do not need to be an engineer to use this framework
One of Levie’s podcast co-hosts described an experience that makes this concrete. They ran an e-commerce business on Shopify. Every day, they watched the platform handle inventory, payments, shipping, and storefronts. They saw competitors adopting the same infrastructure. They noticed the dependency was deepening across an entire industry.
They invested in Shopify. The returns from the infrastructure bet ultimately exceeded the returns from the e-commerce business itself. The operator had better insight into Shopify’s durability than most analysts covering the stock from the outside, because the operator was living inside the product.
That story generalises. Anyone who relies professionally on software tools is already receiving adoption signals. You are simply not translating them into investment research yet.
Building the habit takes three steps:
- Identify your reliance. Which tools are indispensable to your daily work? Shopify, Snowflake, Datadog, Figma, whatever the stack looks like for your role.
- Observe peer adoption. Are competitors, colleagues, and adjacent industries converging on the same tools? That pattern is the signal.
- Map to a public company. Does a publicly traded company capture the economic value when that tool scales? If so, it belongs on your research list.
The Figma lesson: proximity is not the same as conviction
Levie had direct access to Figma at the seed stage. He met co-founder Dylan Field early. He passed on the investment because he could not grasp the full implications of real-time collaborative design in the cloud.
The lesson is not that the framework fails. It is that proximity to a tool is necessary but not sufficient. The investor must ask ecosystem questions, not just product questions. Did this tool change how an entire workflow category operates, or did it just improve one step? Levie saw Figma working well. He did not see Figma replacing an entire category of design collaboration. The ecosystem question is where the conviction lives.
Four sources where adoption signals are hiding in plain sight
Knowing the framework works is one step. Knowing exactly where to look is the step that makes it actionable. Four public sources provide the raw material, and each operates on a different timeline.
| Source | What to look for | What it signals | Lead or lag indicator |
|---|---|---|---|
| Stack Overflow Developer Survey | “Loved vs. dreaded” scores, “wanted” rankings, year-over-year trend | Retention, displacement risk, future adoption momentum | Leading |
| GitHub activity | Sustained star growth, contributor count, dependency appearances | Ecosystem depth, infrastructure entrenchment | Leading |
| Job postings (LinkedIn, Indeed) | Skill requirements appearing at banks, retailers, and healthcare firms | Technology deployed in enterprise production, with real budget behind it | Leading (strongest enterprise signal) |
| Developer communities (Hacker News, Reddit, Dev.to) | Production-use discussions, tutorial volume, practitioner sentiment | Community investment, real-world validation | Mixed (confirms or challenges other signals) |
The most important distinction is between leading and lagging sources. The Stack Overflow survey and GitHub activity catch adoption early. When a tool begins showing up in job postings, it signals the technology has moved into enterprise production environments where budgets are committed and switching costs are substantial.
Companies do not hire skills they do not intend to deploy. A tool appearing in job postings at banks and healthcare systems is a materially different signal than the same tool trending on GitHub: the former tells you the technology has crossed into enterprise production, where budget commitments and switching costs are largest.
Industry analyst reports from firms like Gartner and Forrester sit at the other end of the timeline. They are useful for confirming that a technology has progressed from interesting to standard, but by the time a tool features heavily in those reports, most of the timing edge for an early investor has already gone. Use them as validation, not discovery.
From adoption signal to investable thesis: a three-step filter
Spotting adoption is the beginning. Converting it into an investable thesis requires three filters, each building on the one before it.
- Map the technology to the company that captures the economic value. For each tool with strong adoption signals, ask: who gets paid when usage scales? A cloud database with developer traction maps to the managed cloud service provider. A design tool with seat-based pricing maps to the SaaS company selling subscriptions. An open-source project with enterprise momentum maps to the company selling commercial features or managed hosting. Watch out for tools owned by large platforms. React is used everywhere, yet it contributes negligibly to Meta’s overall revenue given the parent company’s size. The adoption story there simply does not move the stock.
- Verify the monetisation model. Developer enthusiasm alone does not produce shareholder returns. The company needs a credible scaling mechanism: usage-based pricing, seat-based SaaS, open core with paid enterprise features, or cloud infrastructure services. The question to probe is whether budget decision-makers, the CTOs and CFOs, have endorsed the tool with organisational spending, or whether it is only loved by individual developers without formal budget commitment.
- Apply standard financial filters. This is where the adoption signal hands off to conventional analysis.
Applying standard financial discipline to tech stack candidates
Once a company passes the adoption and monetisation screens, evaluate it like any other investment candidate. Revenue growth rate relative to valuation matters. The competitive environment matters, including the risk that a major cloud provider builds a managed alternative. Cash burn and runway matter for earlier-stage companies. Margin structure tells you whether the business can sustain its growth economics.
A correct adoption thesis purchased at an extreme valuation still produces a poor result. Many 2020-2021 cloud and software winners suffered severe drawdowns despite continued operational strength, confirming that entry price matters independently of how strong the underlying adoption signal is.
The tech stack signal identifies what to research first. It does not tell you what to buy at any price. That distinction is the difference between a framework and a gamble.
The thematic investing evaluation process applies five diagnostic questions across problem size, realistic addressable market, competitive durability, valuation, and moat quality, with AI application-layer companies scoring well on problem relevance but carrying meaningful multiple compression risk if adoption rates disappoint.
Where this framework breaks and what to do about it
Every investment framework has failure modes. This one has four, and knowing them in advance is what makes the approach trustworthy rather than reckless.
- Is this beloved tool actually a business? Many open-source tools are critical to developers’ daily work yet bring in little revenue for those who maintain them. Without a credible path to monetisation, strong developer sentiment will not translate into stock returns. Ask: are there paying enterprise customers, or is the user base made up entirely of free-tier accounts?
- Can a cloud provider replicate this and redirect the value? AWS, Azure, and GCP frequently launch managed versions of widely used open-source tools. Before committing to a company in the open-source-adjacent space, ask whether a major cloud provider has already built a competing offering or could do so with little effort.
- Has adoption plateaued before reaching mainstream scale? Some technologies build strong early momentum, then stall. Rival tools emerge, incumbents bundle similar features, or the addressable use case proves narrower than it first appeared. Ask: is adoption still growing, or has the pace levelled off across the past two survey cycles?
- Is the valuation already pricing in perfection? At a 30x revenue multiple, a correct thesis still needs years of flawless execution just to break even. Ask: does the current share price leave meaningful room for the adoption story to play out, or is the best-case outcome already baked in?
The cloud cannibalisation risk deserves specific attention: when a major cloud provider offers a managed version of an open-source tool, the original commercial entity can lose its value capture even as the underlying technology’s adoption grows. The adoption signal stays correct, but the investment return migrates to a different company.
The cloud cannibalisation risk is most acute in open-source-adjacent categories, where AWS, Azure, and GCP can replicate a popular tool as a managed service and redirect the economic value to their own platforms, even as the underlying technology’s developer adoption continues to grow.
The most dangerous failure mode is valuation risk, because it can invalidate an otherwise correct thesis entirely. Levie referenced SanDisk as a storage investment that returned approximately 3,000% over roughly two years when the adoption signal was correct and the entry price was reasonable. That kind of return illustrates the upside, but it also illustrates why discipline at the entry point matters: the same adoption thesis at a dramatically different price produces a dramatically different outcome.
A four-week starting routine for building your tech stack watchlist
You do not need new tools or paid subscriptions to begin. The signal sources are public, and the routine takes a few hours per week.
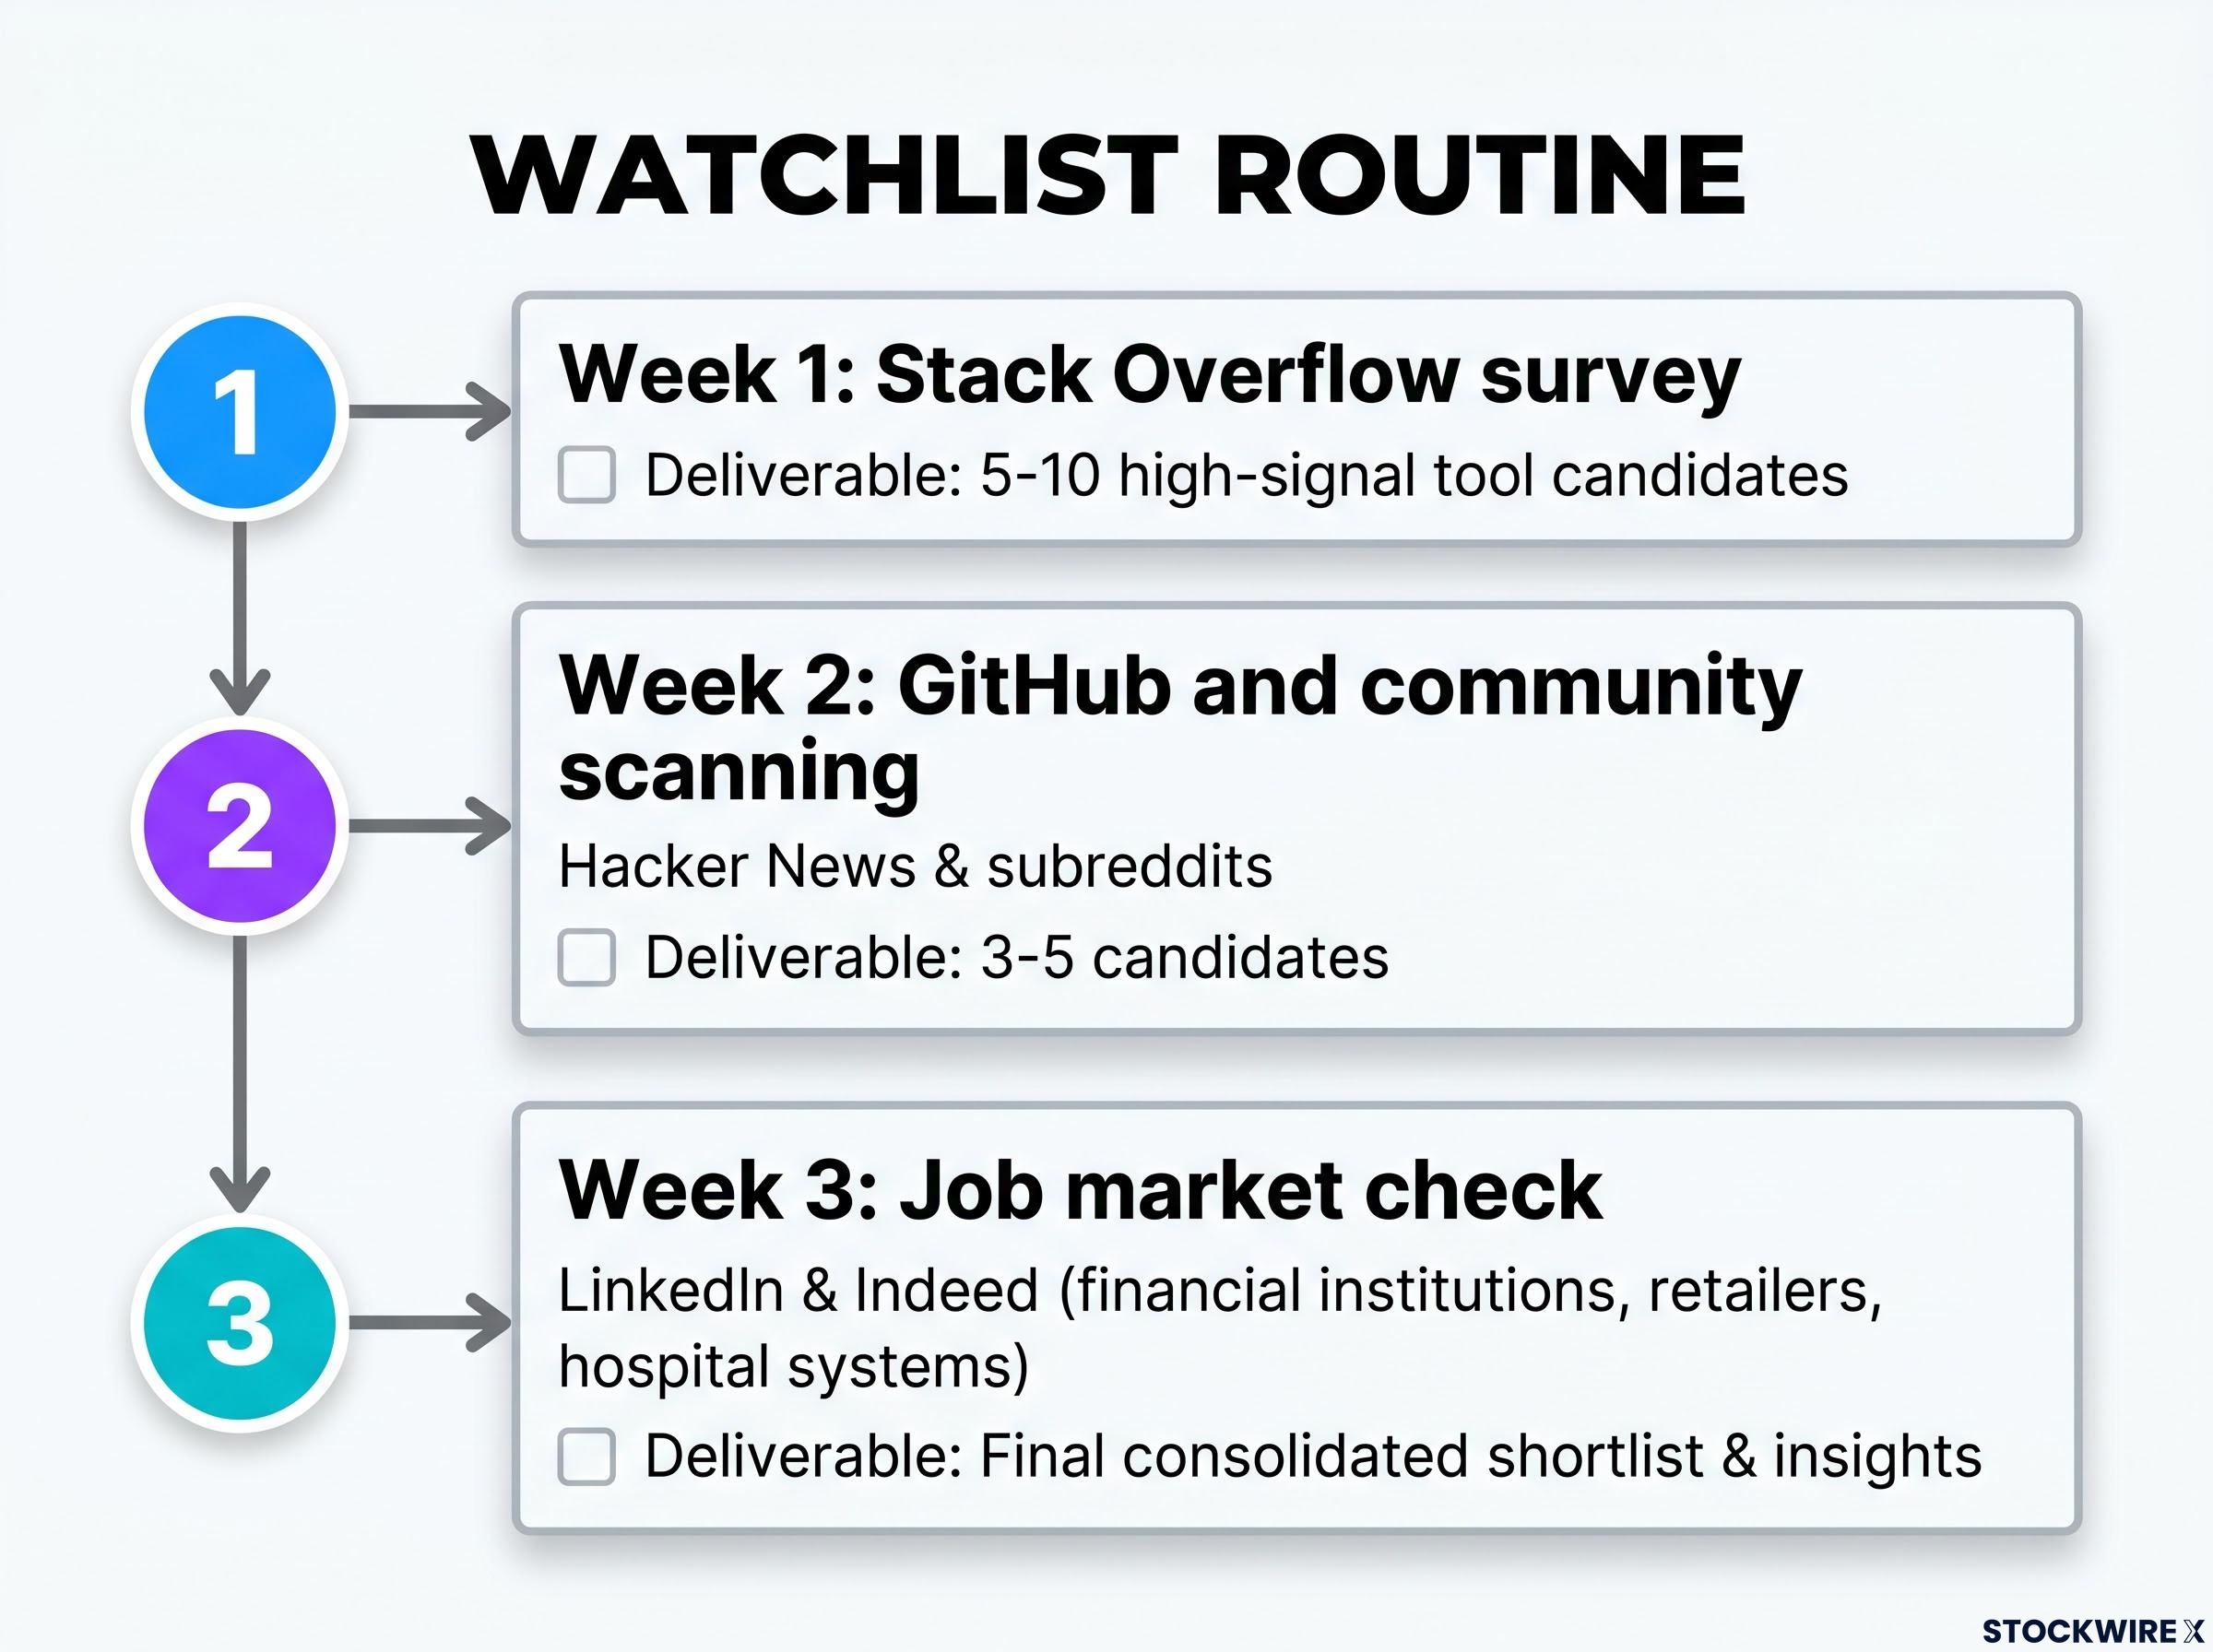
- Week 1: Stack Overflow survey. Read the latest technology sections. Identify tools with high “loved” scores, rising professional use, and strong “want to learn” interest. Map each to a potential investable company. Your deliverable: a list of 5-10 high-signal tool candidates with company mappings.
- Week 2: GitHub and community scanning. Explore GitHub Trending for the technologies you identified. Read practitioner discussions on Hacker News and relevant subreddits about real-world production usage. Your deliverable: a refined short list of 3-5 candidates validated by community evidence of production deployment.
- Week 3: Job market check. Search LinkedIn and Indeed for roles mentioning the technologies on your short list. Note which industries and geographies are hiring. When a tool starts appearing in job postings at financial institutions, retailers, and hospital systems rather than just startups, that shift into regulated, established sectors is where the enterprise signal is strongest. Your deliverable: a short list filtered by enterprise adoption evidence.
Making the “infrastructure behind my workflow” habit permanent
After the initial three weeks, the framework shifts from a research project to an ongoing professional practice. Whenever a tool becomes indispensable in your work, run the three-step filter: map it to a company, check the monetisation model, apply the financial filters. If it passes, add it to your watchlist.
Revisit your watchlist names alongside quarterly earnings reports and updated adoption data. You are tracking whether the adoption signal is translating into the financial metrics that should follow it: revenue growth, customer count expansion, margin improvement.
This habit is most powerful for professionals in non-technical industries. If you work in finance, healthcare, logistics, or retail, the tools becoming standard in your workflow may not yet be on any analyst’s radar. That gap is your timing advantage, and it compounds the longer you maintain the practice.
For investors ready to act on the AI thesis identified through this framework, our dedicated guide to AI infrastructure stock allocation covers the 50/40/10 layer structure, with worked allocation percentages across hardware, cloud, and software.
What this approach gives you that conventional research cannot
The core edge here is consistent and repeatable: developer adoption precedes revenue growth, revenue growth precedes analyst coverage, and analyst coverage precedes the price moves that most investors notice. Tracking Stack Overflow and GitHub puts you one to two stages ahead of the investor who is waiting for the initiation note.
The framework also works in reverse. The “dreaded” scores in Stack Overflow flag tools whose financials may still look solid but whose adoption is eroding underneath. Those are potential short candidates, or at minimum, positions to avoid. The negative signal is as valuable as the positive one.
The AI infrastructure constraints that matter most in 2026, power grid interconnection timelines, cooling density thresholds, and data centre capacity, represent the binding bottlenecks where the adoption-to-price sequence is already playing out for developers standardising on specific compute layers.
The categories where this framework is likely most powerful in the near term are AI development platforms, observability tooling, and the infrastructure layer beneath the current generation of AI applications. Developers are already standardising on specific tools in these categories. The financial recognition will follow.
This is not a replacement for financial discipline. It is a screening and timing advantage that sits upstream of conventional analysis. The combination of ground-level adoption awareness with valuation rigour creates an information edge that neither input produces alone.
You are not trying to outsmart the entire market. You are converting something you already have, firsthand knowledge of what tools are becoming mission-critical in your professional world, into a systematic earlier signal than most investors ever access.
This article is for informational purposes only and should not be considered financial advice. Investors should conduct their own research and consult with financial professionals before making investment decisions. Past performance does not guarantee future results.
—