Gold Surges 2% as Jobs Miss Snaps Five-Week Losing Streak
3 hrs ago
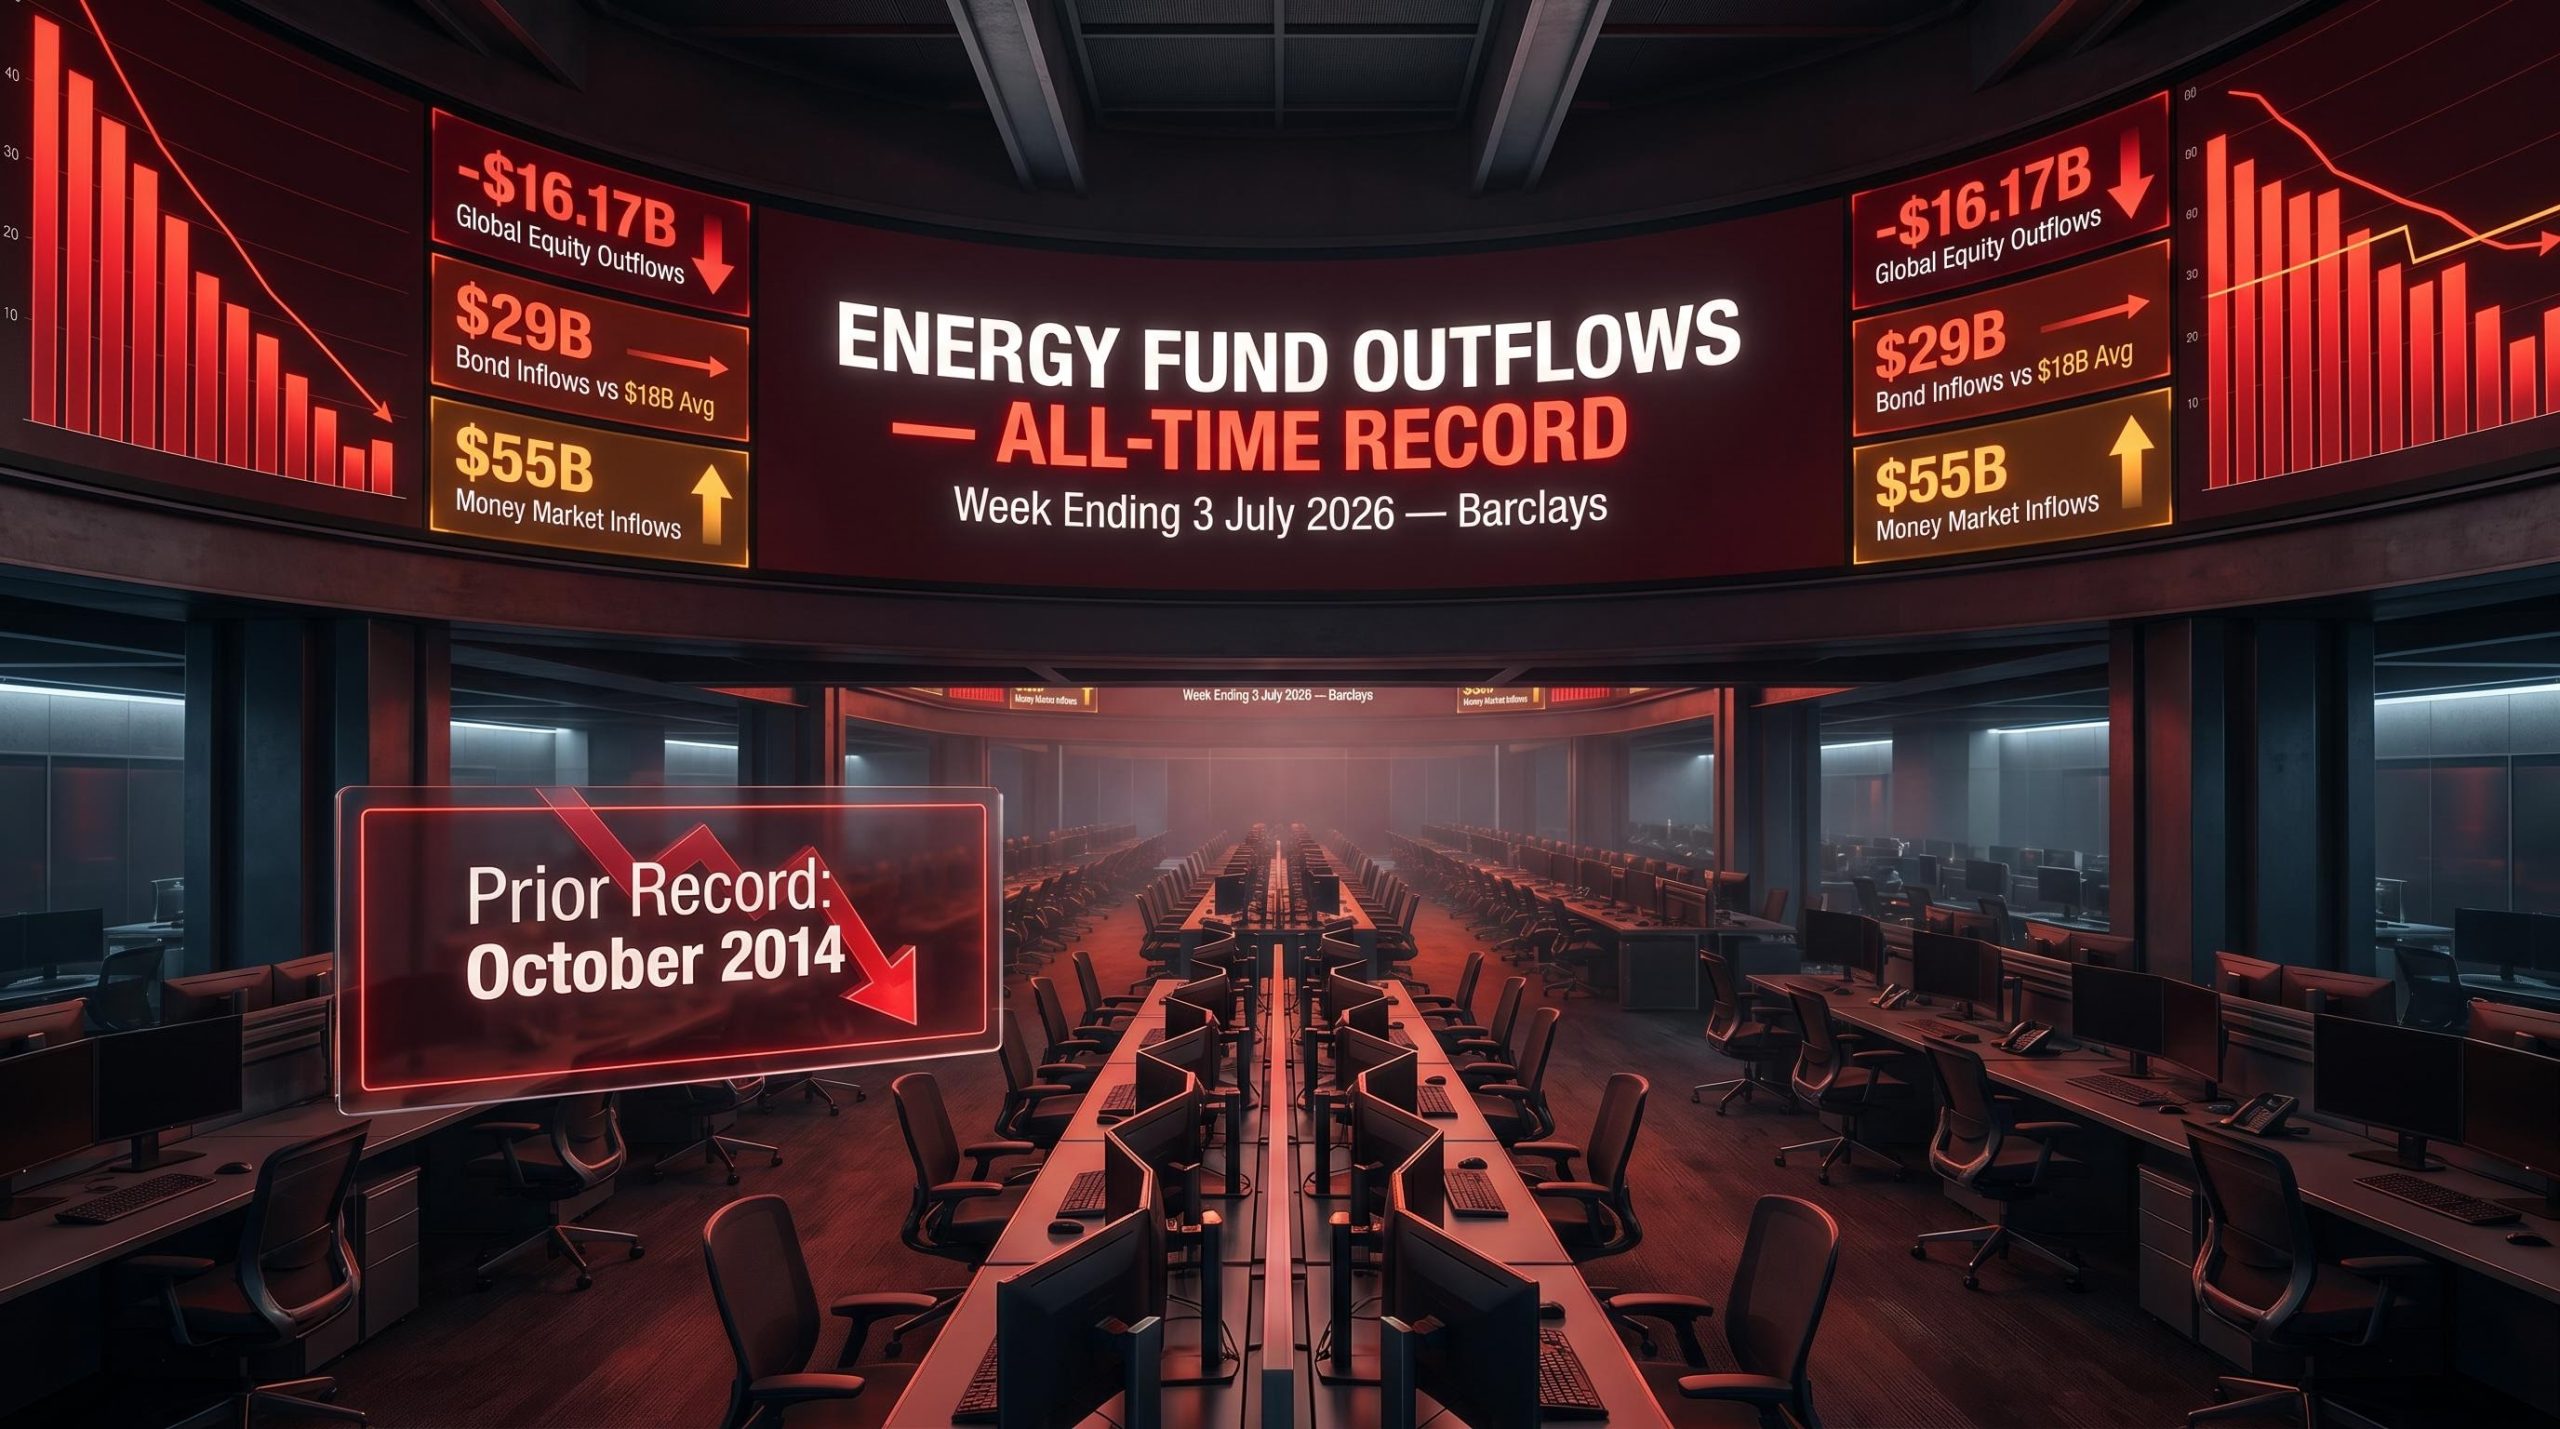
Energy sector funds just recorded their largest single-week outflow in history, surpassing a record that had stood since October 2014. The data, published by Barclays for the week ending approximately 3 July 2026, left no room for ambiguity about the direction of institutional sentiment.
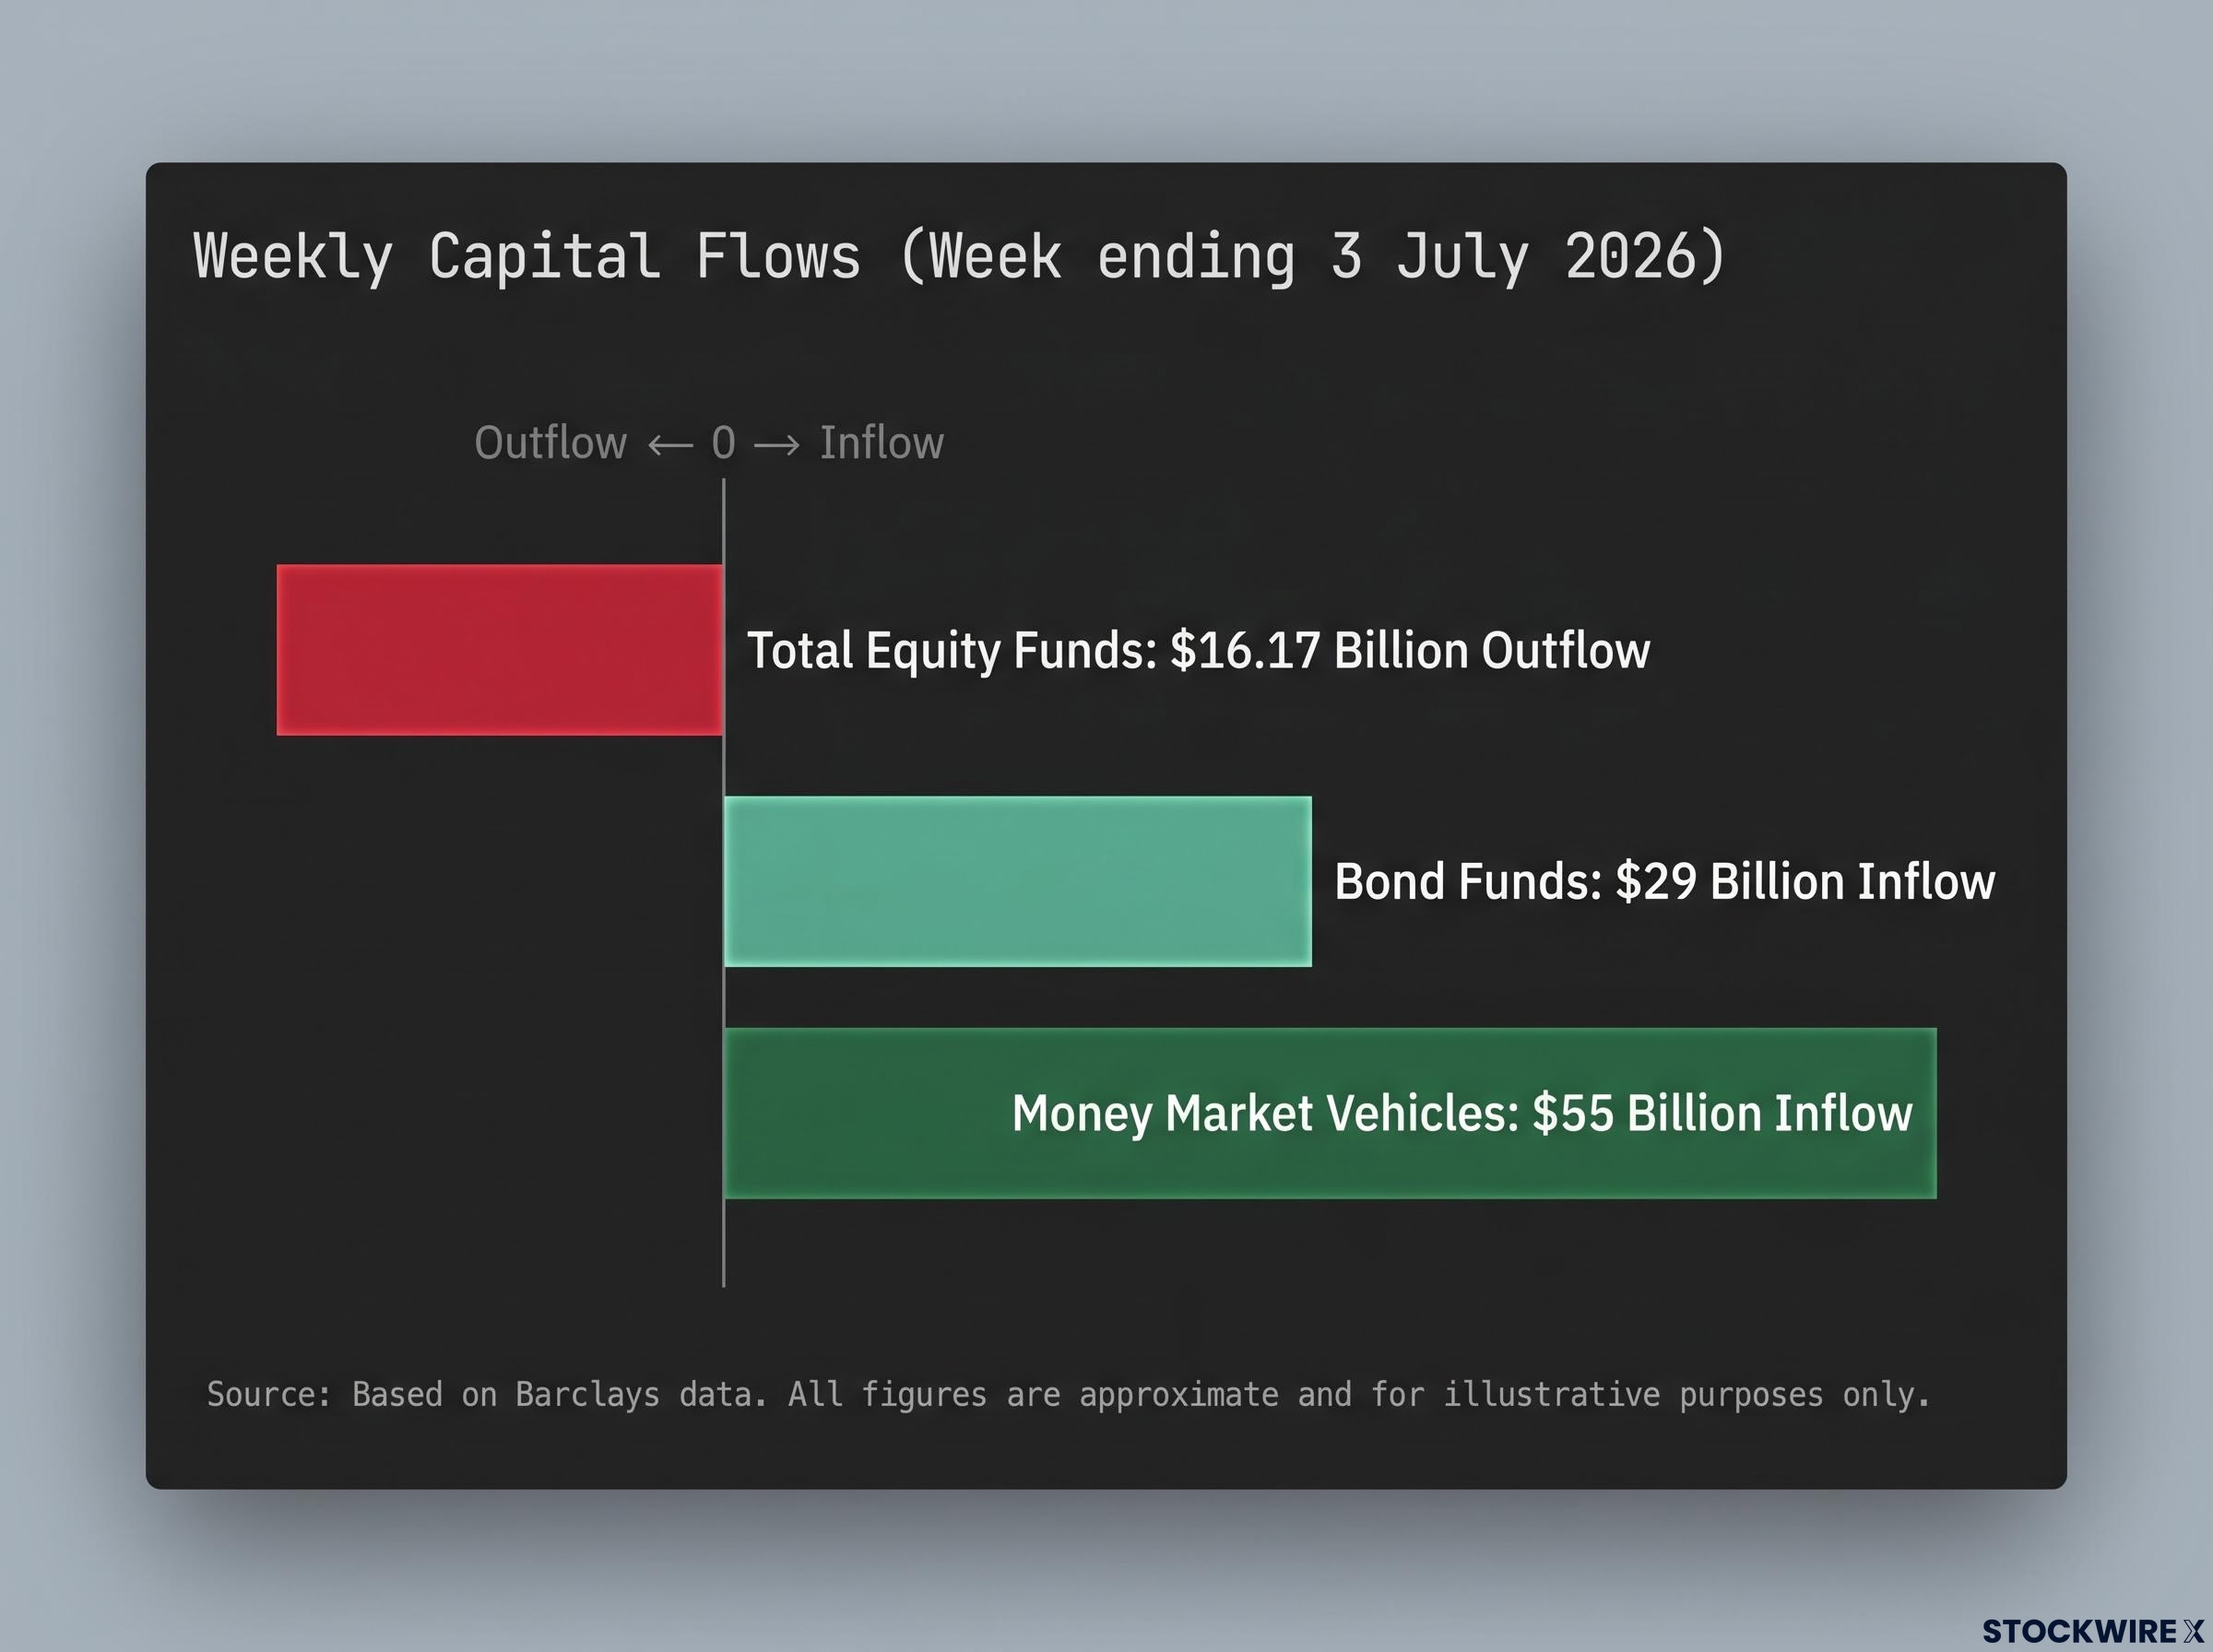
In the same week, equity funds bled capital across every major geography simultaneously. U.S., European, and emerging-market funds all posted redemptions, while fixed income vehicles drew in approximately $29 billion and money market funds collected roughly $55 billion, figures that sat comfortably above what recent weekly averages would suggest. This was a week where capital movement told a clearer story than any commentary could.
Here is what that movement tells you about where professional investors think risk sits right now, and what it may signal for the second half of 2026.
Barclays confirmed that weekly energy fund redemptions reached a level never previously recorded, clearing the prior low-water mark from October 2014 by a meaningful margin, with outflows concentrated in U.S.-domiciled energy vehicles.
Record breaker: For the week ending approximately 3 July 2026, weekly withdrawals from energy sector funds reached an all-time high, exceeding the prior worst reading set during the October 2014 period, according to Barclays data.
The scale matters because it separates this week from ordinary sector rotation. When outflows hit an all-time record, the behaviour behind the numbers shifts. This is not tactical trimming by managers adjusting allocations at the margin. Record-level redemptions typically reflect urgency-driven selling, where large institutional players are exiting positions rather than sizing them down.
Whether that marks a cyclical bottom or the opening phase of a longer structural derating is the question the data cannot yet answer. Extreme outflows have historically preceded both outcomes. Until weekly flows stabilise, the signal remains ambiguous, and the volatility around energy names should be expected to persist even if underlying commodity prices hold.
If you hold energy exposure, the distinction between capitulation and structural exit is the one worth watching most closely.
Weekly fund flow data tracks the net movement of capital into and out of investment vehicles across institutional and retail channels. It covers three broad categories:
These figures, compiled weekly by providers such as Barclays, give a real-time read on where investors are directing capital, which in turn reveals their current risk appetite and conviction levels.
Weekly fund flow readings from earlier in 2026 showed a barbell pattern forming well before this week’s record: bond inflows ran for 56 consecutive weeks through late May, while a single-week technology surge to $9.0 billion pushed a contrarian sell indicator to its activation threshold, a sequence that foreshadowed the broad equity caution now visible in the data.
The year-to-date context sharpens the picture. Barclays data shows that cumulative equity fund inflows through approximately 3 July 2026 reached $516.10 billion, while net inflows into fixed income vehicles over the same period totalled $480 billion. Against that backdrop of substantial prior optimism, this week’s defensive acceleration carries more weight, not less.
Fund flows are a sentiment indicator, not a price predictor. They show you where investors are putting capital right now, which tells you about conviction and risk tolerance. They do not tell you where prices will go next.
What makes a weekly reading meaningful is its extremity. Incremental moves in either direction are noise. Record-breaking readings, like this week’s energy outflows, tend to carry genuine signal about a shift in positioning.
For a second straight week, global equity fund outflows intensified, per Barclays, with U.S. funds leading the selling and European and emerging-market funds each extending their own outflow streaks. Total equity fund outflows reached approximately $16.17 billion, with domestic equity fund redemptions accounting for roughly $13.28 billion and world equity funds contributing approximately $2.89 billion.
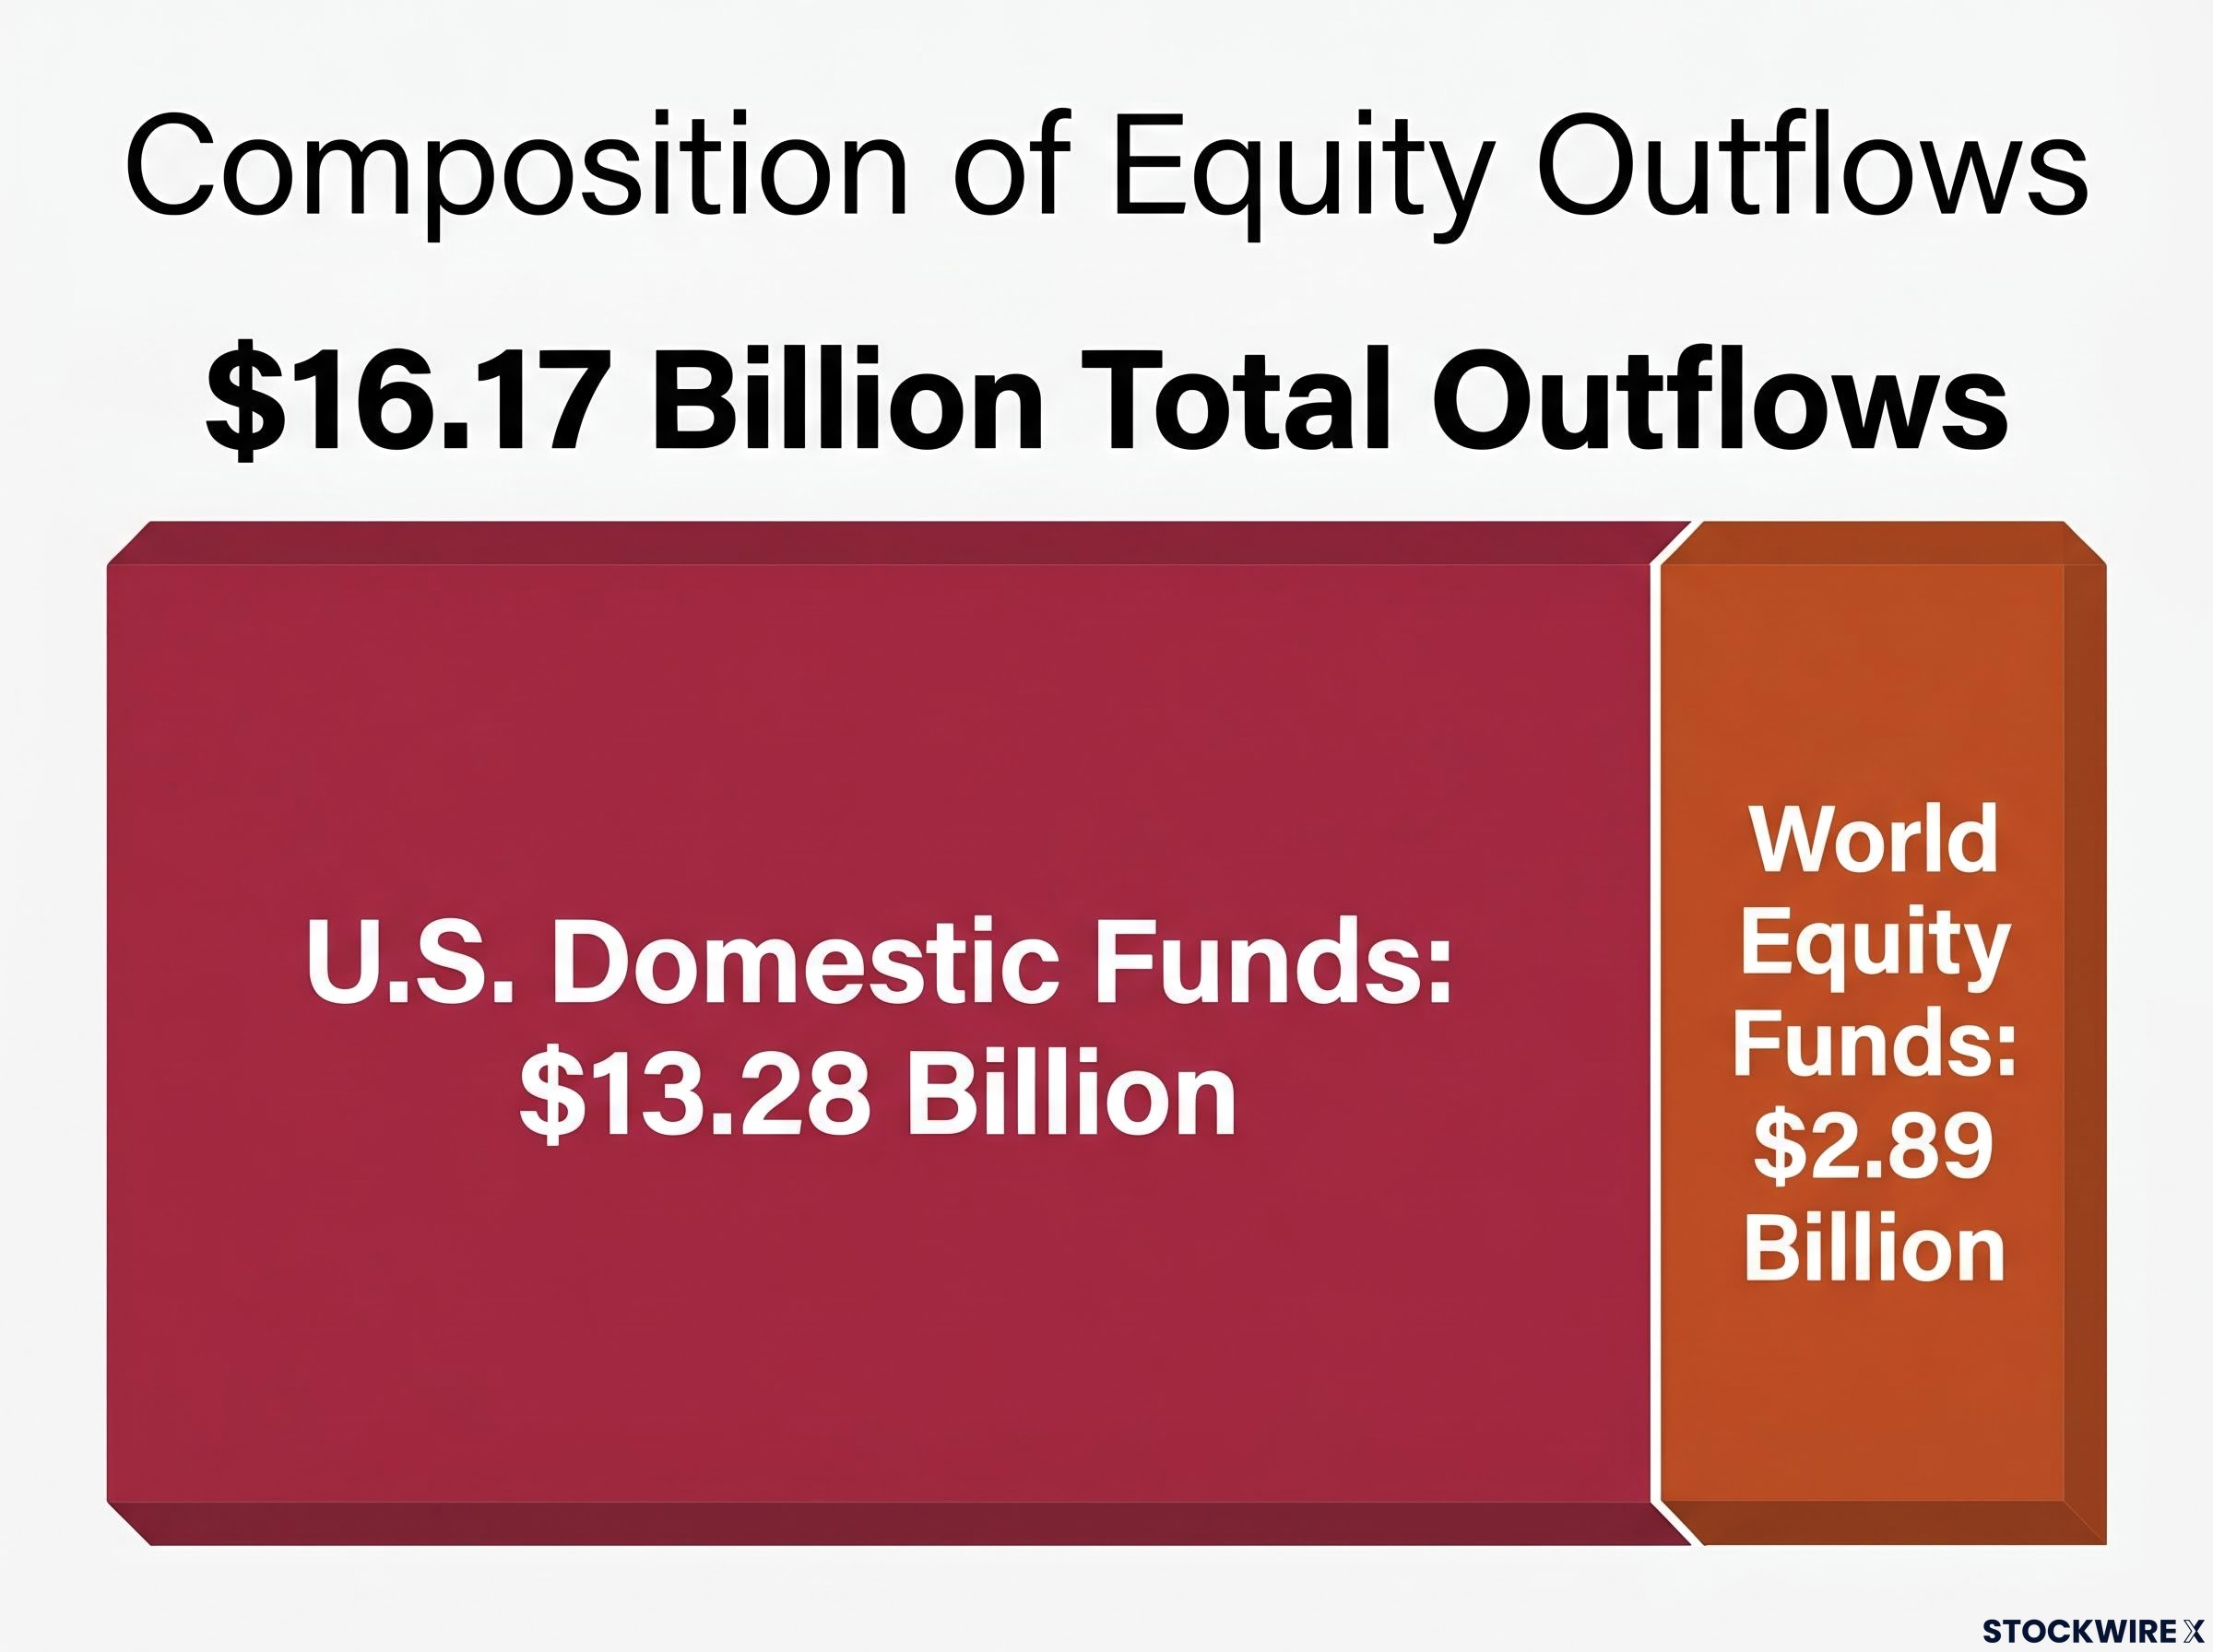
The synchronisation is the signal. When capital leaves every major geography at once, investors are not rotating between regions. They are reducing total equity exposure.
Regional rotation would show inflows in one geography offsetting outflows in another. That is not what happened. Simultaneous redemptions across the U.S., Europe, and emerging markets indicate a broad reduction in equity risk appetite, a different and more meaningful signal than any single-region sell-off.
| Geography | Equity Flow Direction | Context |
|---|---|---|
| U.S. domestic funds | Outflows (~$13.28B) | Primary driver of global equity redemptions |
| World equity funds | Outflows (~$2.89B) | Second consecutive week of accelerating outflows |
| European funds | Outflows | Extended existing outflow streak |
| Emerging-market funds | Outflows | Extended existing outflow streak |
Set against $516.10 billion in cumulative year-to-date equity inflows, the shift in mood is sharp and recent. Something systemic is driving the exit, and that means your own equity exposure deserves a fresh assessment regardless of which markets you hold.
Fixed income funds pulled in roughly $29 billion for the week, a figure that cleared the year-to-date weekly average of approximately $18 billion by a wide margin, per Barclays. Over the same period, money market vehicles took in around $55 billion.
| Asset Class | This Week’s Inflow | YTD Weekly Average |
|---|---|---|
| Bond funds | ~$29 billion | ~$18 billion |
| Money market vehicles | ~$55 billion | N/A |
Three characteristics distinguish this bond inflow as deliberate repositioning rather than trend continuation:
Barclays data puts the running year-to-date total for fixed income net inflows at $480 billion. The combination of elevated bond and money market inflows describes measured risk aversion: investors are reducing portfolio beta and preserving optionality, not fleeing indiscriminately. The gap between the $29 billion weekly figure and the $18 billion average is the clearest signal that institutional capital actively chose to add defensive allocation this week.
Disappointing U.S. payrolls data cooled expectations of a near-term rate rise, with Barclays noting that the next anticipated Federal Reserve hike has been deferred to December 2026. The broker also observed that the first FOMC meeting chaired by Warsh appeared to settle some investor unease regarding the independence of the central bank.
The Warsh communication regime marks a sharp departure from the forward-guidance era: with five internal Fed task forces reviewing how rate projections are published and the Chair’s own dot withheld from the June SEP, each incoming data print now lands on rate expectations without the buffer that pre-announced guidance previously provided.
Deferring a rate increase preserves or modestly improves the price of existing bonds in the near term, because expected future rates have not risen. This makes the current window more attractive for fixed income allocation, particularly for longer-duration bonds, which are more sensitive to shifts in rate expectations than short-duration instruments.
That transmission mechanism explains why bond fund inflows accelerated to well above their year-to-date average this week. With the next hike pushed further out, the near-term return profile for bonds improved, and capital responded.
Yet equity outflows persisted despite the less-hawkish near-term path. That tells you investor concerns now extend beyond monetary policy alone. Barclays points to three categories of worry driving continued equity redemptions:
Strong U.S. economic performance has lifted both real yields and the dollar, with the knock-on effect of unsettling momentum and semiconductor positions that had grown crowded, per Barclays. The December deferral widens the window for attractive bond entry, but the persistence of equity selling tells you the market is pricing in risks that sit beyond the rate cycle.
According to Barclays, the gains driving U.S. equity indices in 2026 have been disproportionately generated by a narrow set of large-cap names in semiconductors and AI-related sectors. That concentration creates a specific form of fragility: when a handful of stocks drive index-level returns, broad equity funds become more vulnerable than their benchmark metrics suggest.
Semiconductor crowding among fund managers reached 73% conviction in the May 2026 BofA Global Fund Manager Survey, up from 24% in a single survey cycle, a concentration extreme that makes the narrow leadership Barclays identifies as a fragility source visible not just in index weights but in declared institutional positioning.
Recent weeks have seen hedge funds and commodity trading advisers (CTAs) trimming some of their positions, though Barclays notes that total equity exposure across the market remains elevated and unevenly spread. That elevated but lopsided positioning is precisely the setup that can convert orderly repositioning into sharper de-risking. When crowded leaders become a source of funding during sell-offs, the selling can be faster and more concentrated than the headline outflow figures initially suggest.
If your portfolio or the funds you hold are tilted toward the same semiconductor and AI-related megacap names that drove the year-to-date gains, this week’s flow pattern is a direct prompt to check that concentration. Three practical steps:
This week’s data constellation, record energy outflows, $16.17 billion in total equity redemptions, $29 billion in bond inflows against an $18 billion weekly average, and $55 billion in money market inflows, describes a measured defensive repositioning. Investors are reducing portfolio beta and preserving optionality. They are not capitulating in panic.
Whether this defensive tilt extends or reverses in the second half of 2026 depends on three specific variables:
The flows tell you what investors are doing now and why. They do not tell you what happens next. That distinction matters, because treating this week’s data as either a definitive alarm or a buying signal would overstate what fund flow data can deliver. It is a sentiment reading, not a forecast.
For now, professional money is voting for lower risk. The three variables above are the ones worth watching to determine whether this week marks a brief pause in a bull market or the beginning of a longer repositioning.
For investors prompted by this week’s flows to reassess how equities and bonds interact in their own allocation, our full explainer on 60/40 portfolio assumptions examines how the stock-bond correlation turned positive during the 2022 inflationary shock and what a three-sleeve framework adds for environments the classic model was not built to handle.
This article is for informational purposes only and should not be considered financial advice. Investors should conduct their own research and consult with financial professionals before making investment decisions. Past performance does not guarantee future results, and forward-looking statements about Federal Reserve policy and market positioning are subject to change based on economic developments and market conditions.
Global fund flow data tracks the net movement of capital into and out of investment vehicles, including equity funds, bond funds, and money market instruments, across both institutional and retail channels. It provides a real-time read on investor risk appetite and conviction levels, compiled weekly by providers such as Barclays.
Barclays confirmed that weekly energy fund redemptions for the week ending approximately 3 July 2026 surpassed the prior record set in October 2014 by a meaningful margin, with outflows concentrated in U.S.-domiciled energy vehicles. Record-level redemptions of this scale typically reflect urgency-driven institutional selling rather than routine tactical rebalancing.
Simultaneous outflows across U.S., European, and emerging-market equity funds indicate a broad reduction in total equity risk appetite, not a regional rotation. If capital were simply rotating, inflows in one geography would offset outflows in another; the synchronised selling is the signal that something systemic is driving the exit.
Disappointing U.S. payrolls data pushed the next anticipated Federal Reserve rate hike out to December 2026, improving the near-term return profile for existing bonds. Capital responded directly: bond fund inflows reached approximately $29 billion for the week, more than 60% above the year-to-date weekly average of around $18 billion.
Barclays flagged that 2026 U.S. equity gains have been disproportionately driven by a narrow set of semiconductor and AI-related large-cap names, a concentration that makes broad equity funds more fragile than headline metrics suggest. Investors should review fund holdings for megacap weight, assess sector and style diversification, and stress-test whether year-to-date gains depend on a single narrative reversing.