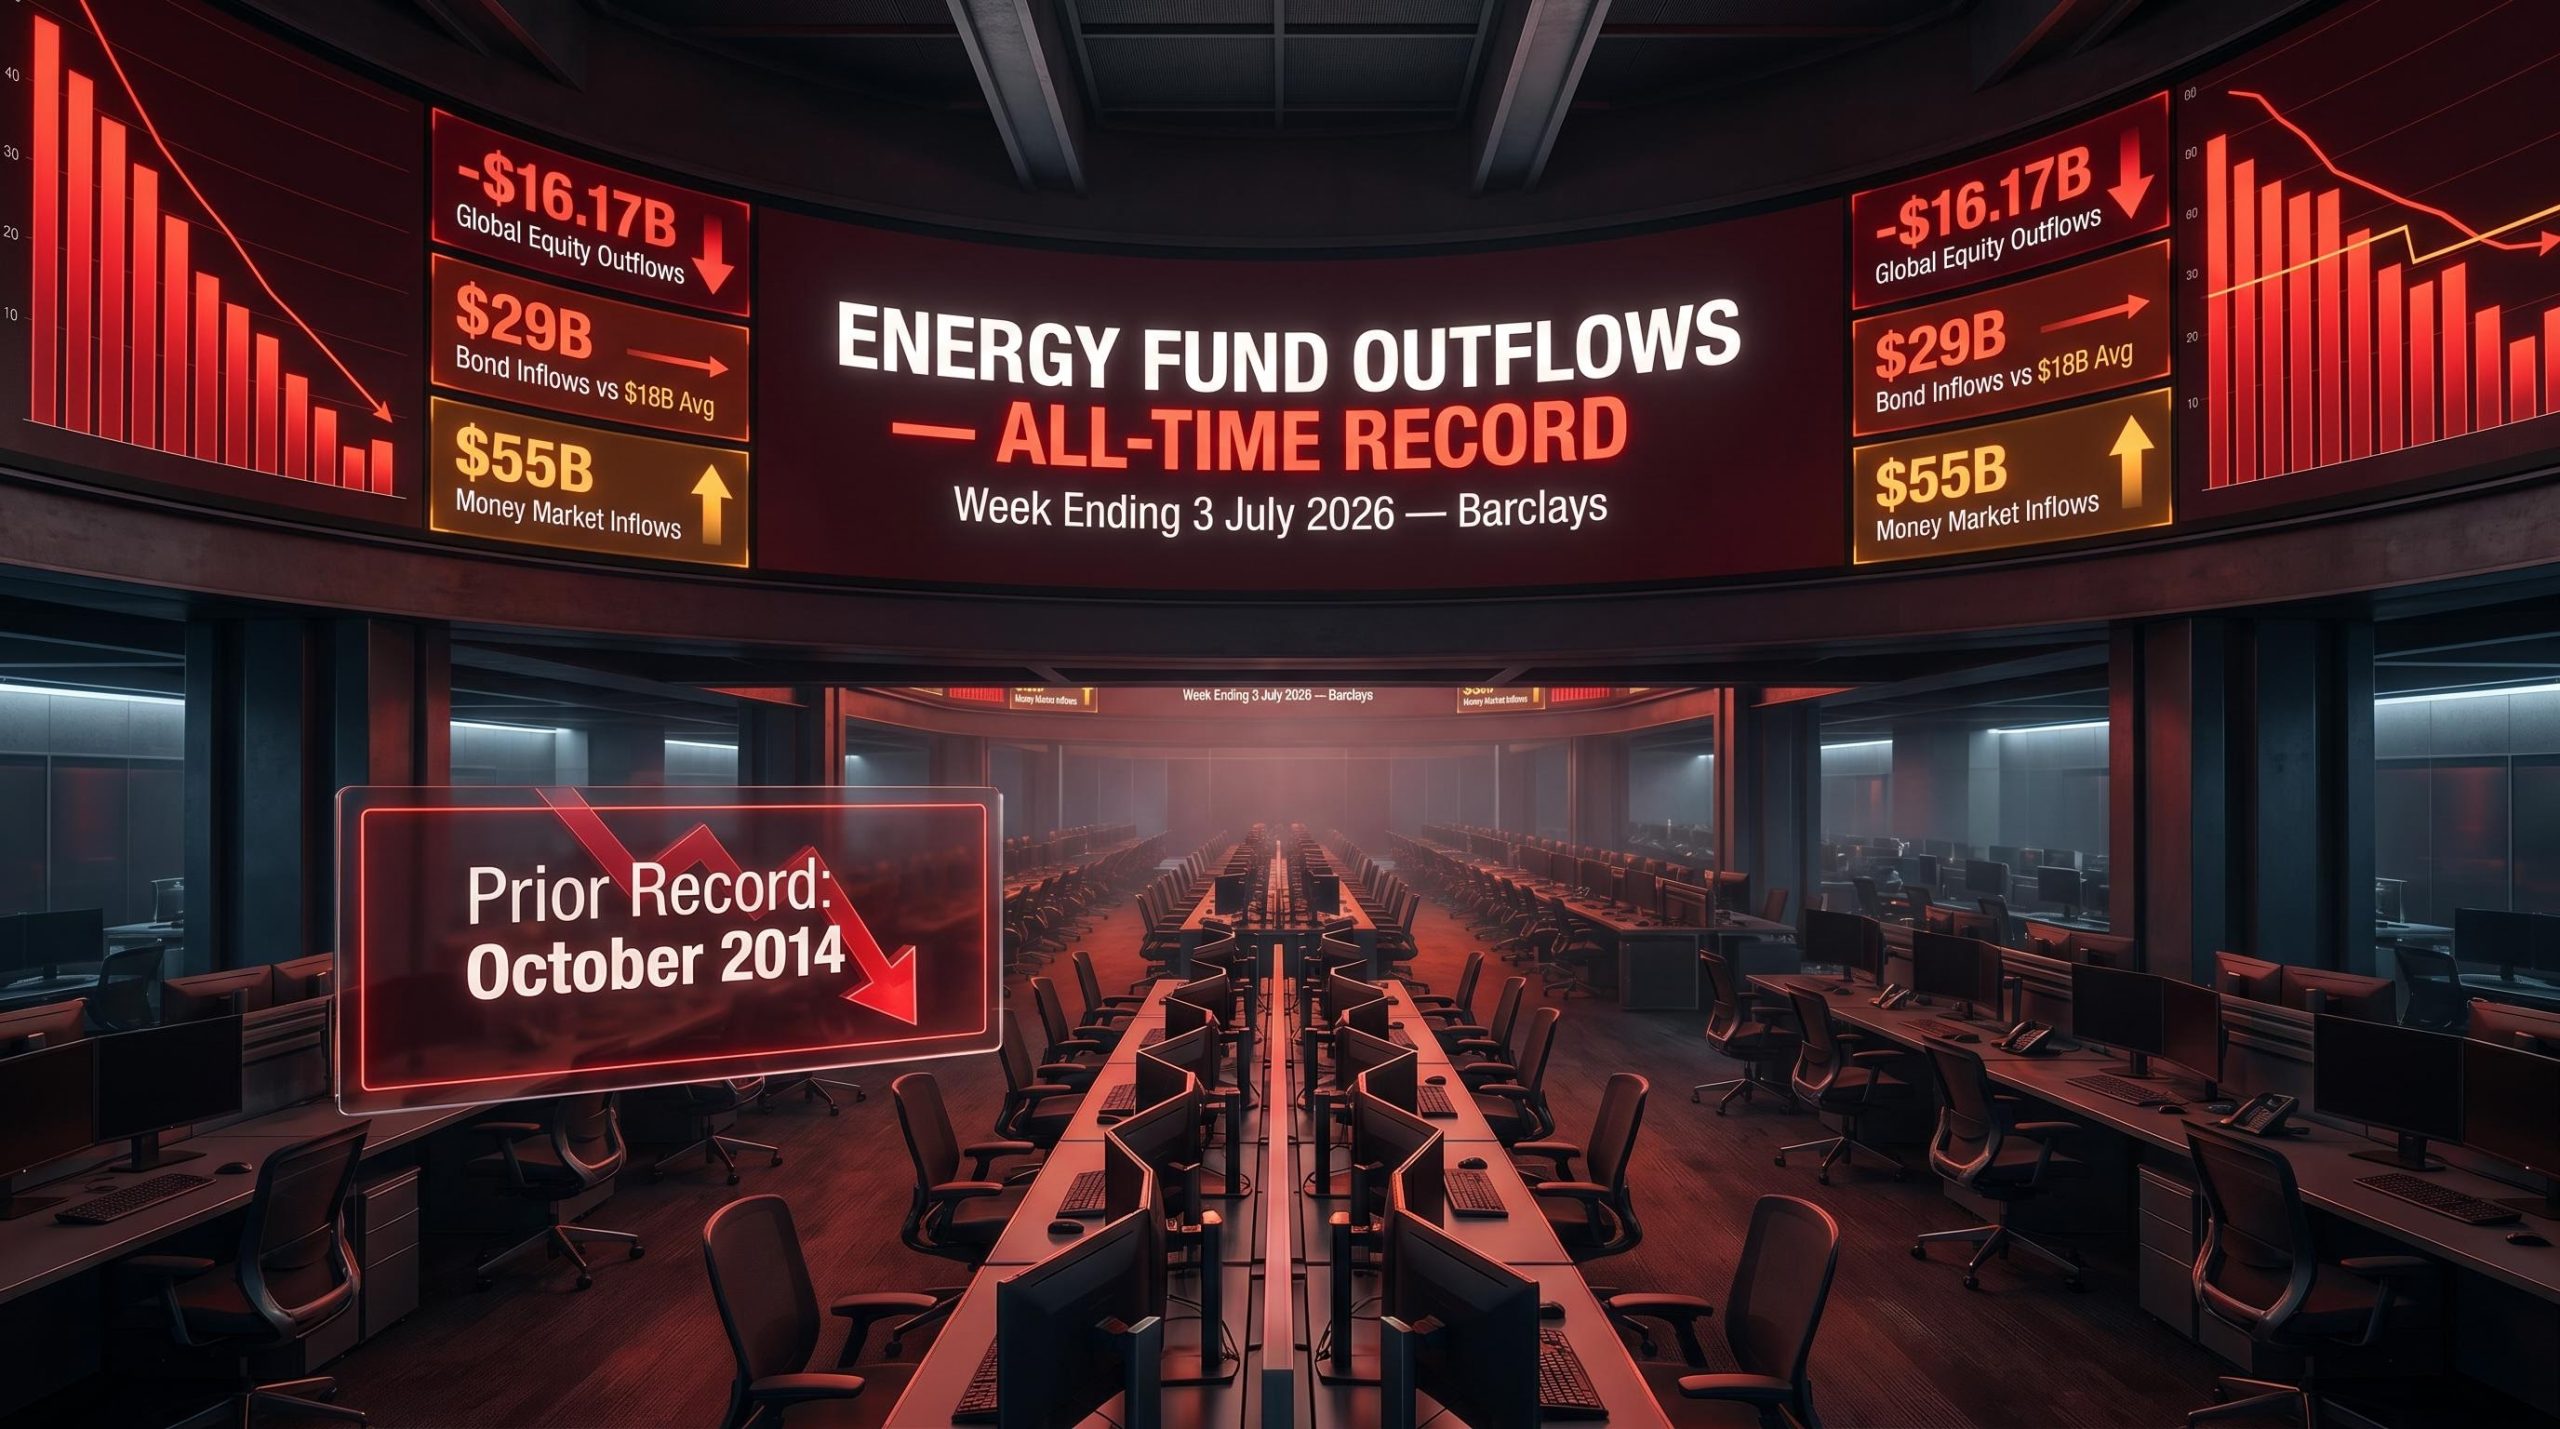
Energy Funds Post Record Outflows as Global Equities Bleed Capital
5 mins ago

Gold just logged its strongest single-session surge in months. Spot prices jumped more than 2% on 2 July, snapping a five-week losing streak after the U.S. economy added just 57,000 jobs in June, less than half of what markets had priced in.
The rebound arrived after a punishing quarter. Gold shed roughly 13% across Q2 2026, sliding to an eight-month low earlier in the same week as persistent hawkishness from Federal Reserve Chair Kevin Warsh kept rate-hike expectations elevated and non-yielding assets under pressure. What happened on Wednesday was not a routine bounce; it was the first crack in the macro conditions that had crushed bullion for three months straight.
The question now is whether June’s payrolls miss was a one-off or the start of something that changes the Fed’s calculus. Here is the mechanism behind gold’s reaction, why the dollar matters, what silver and platinum are signalling, and the specific variables that will tell you whether this is a genuine turning point or a short-covering rally in a still-bearish trend.
The June nonfarm payrolls print came in at 57,000. That was not simply a soft number. It was a miss large enough to materially shift the probability calculus for further Fed rate hikes, and gold’s reaction reflected the scale of the surprise.
The June NFP preview published ahead of Thursday’s release had flagged an asymmetric risk profile: with the Warsh Fed deliberately withholding forward guidance, a single data point carried more interpretive weight than a payrolls print typically would, meaning a miss of this magnitude was always likely to produce an outsized market reaction.
The BLS June 2026 employment report confirmed nonfarm payrolls of 57,000, a figure well below consensus forecasts and the official data point that triggered the rapid repricing of Fed rate-hike odds across asset markets on 2 July.
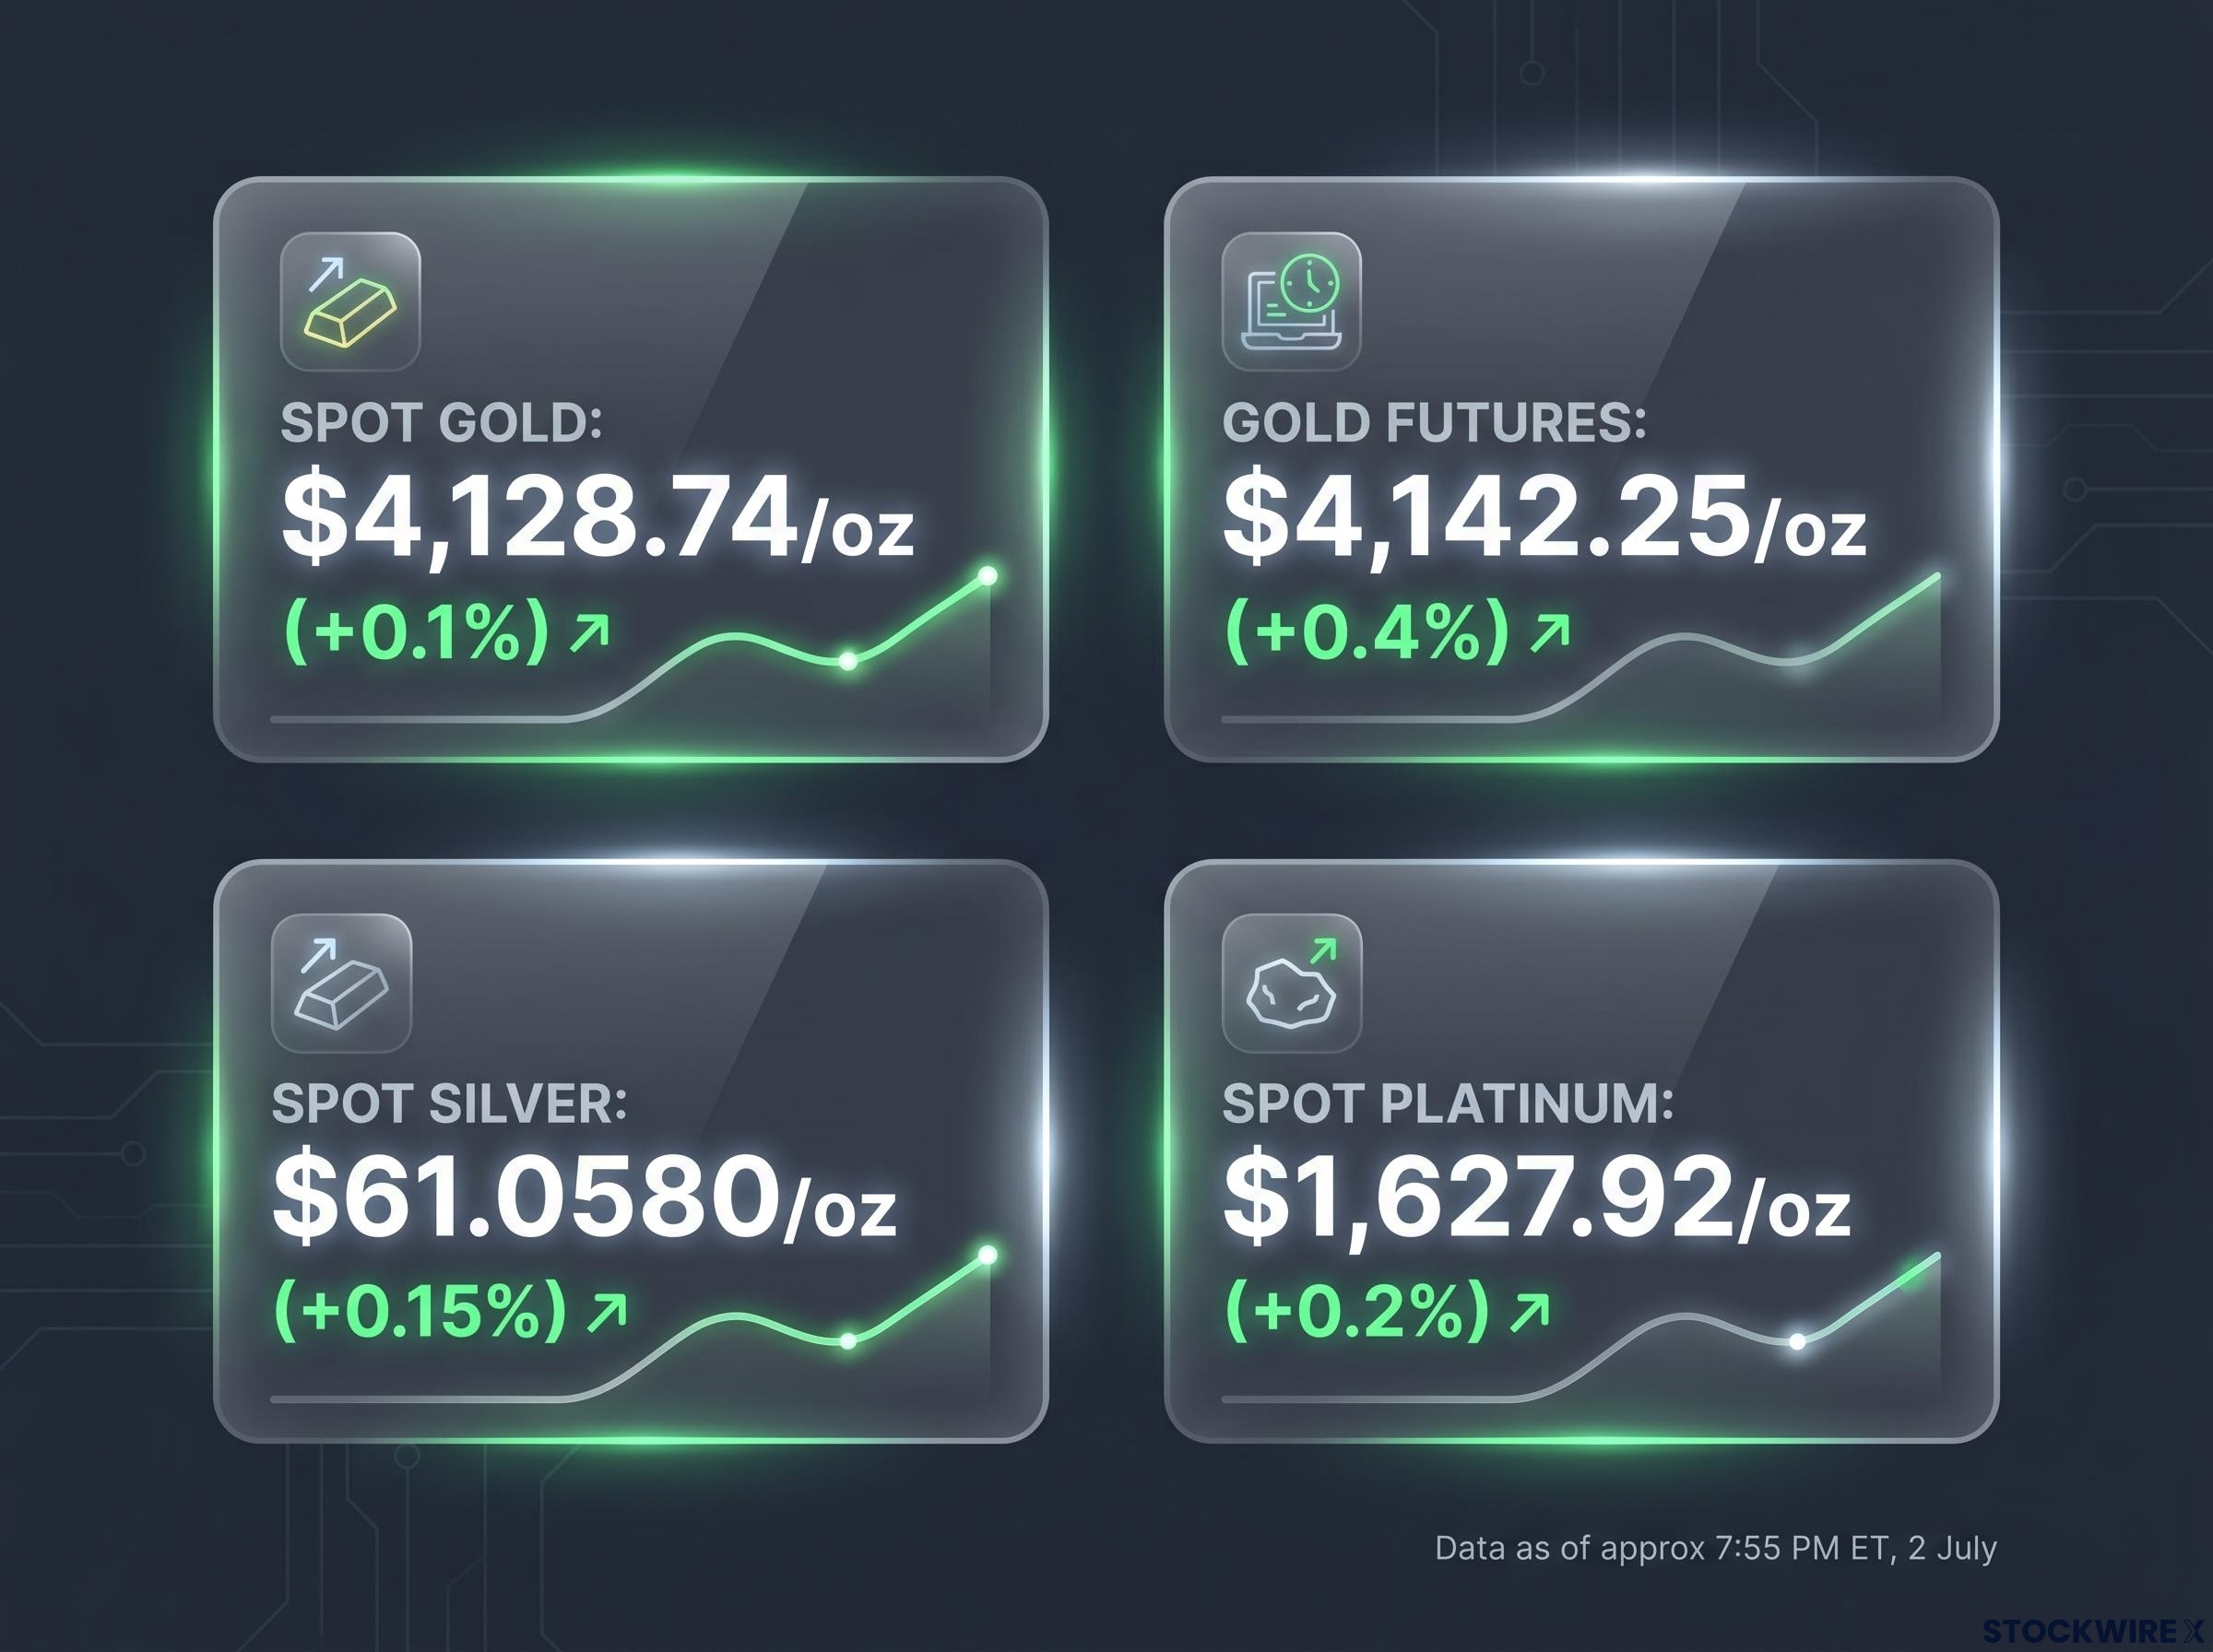
Spot gold surged more than 2% during the session on 2 July, before settling modestly as thin pre-holiday liquidity took hold. By approximately 7:55 PM ET, the key levels stood as follows:
Gold had touched an eight-month low earlier that same week. The reversal from that low to a weekly gain of nearly 1% tells you the payrolls number did not just nudge sentiment; it forced a rapid repricing of the rate-hike odds that had been pressing gold lower since April.
To understand why a 2% daily gain matters, you need to see it against what came before.
Gold surrendered around 13% through Q2 2026, unwinding all year-to-date gains and falling to its weakest point in eight months.
The driver was not a single catalyst but a sustained pressure campaign from the Fed. During the week of 2 July, Chair Kevin Warsh signalled that the central bank intends to hold firm on its 2% annual inflation target, a stance that had shaped market expectations across the entire quarter. Markets spent April, May, and June repricing rate-hike expectations higher, and gold absorbed every revision.
The mechanism is straightforward. When interest rates rise, Treasuries yield more. Gold yields nothing. The opportunity cost of holding bullion climbs with every basis point, and over Q2, that cost compounded into a 13% drawdown. That is not a minor correction; it is the kind of quarterly loss that separates a genuine trend reversal from a dead-cat bounce, which is precisely why the next few months of data carry so much weight.
Gold’s Fed-driven decline through the first half of 2026 had already demonstrated the same mechanism in an earlier episode: the Iran conflict, which conventional safe-haven logic would have treated as bullish, instead fed inflation expectations and hawkish Fed repricing, sending yields roughly 60 basis points higher and dragging the metal lower despite every geopolitical reason for it to rise.
The chain of causation that runs from a payrolls print to a gold price move follows the same sequence every time. Understanding the links lets you anticipate the direction before the price screen updates.
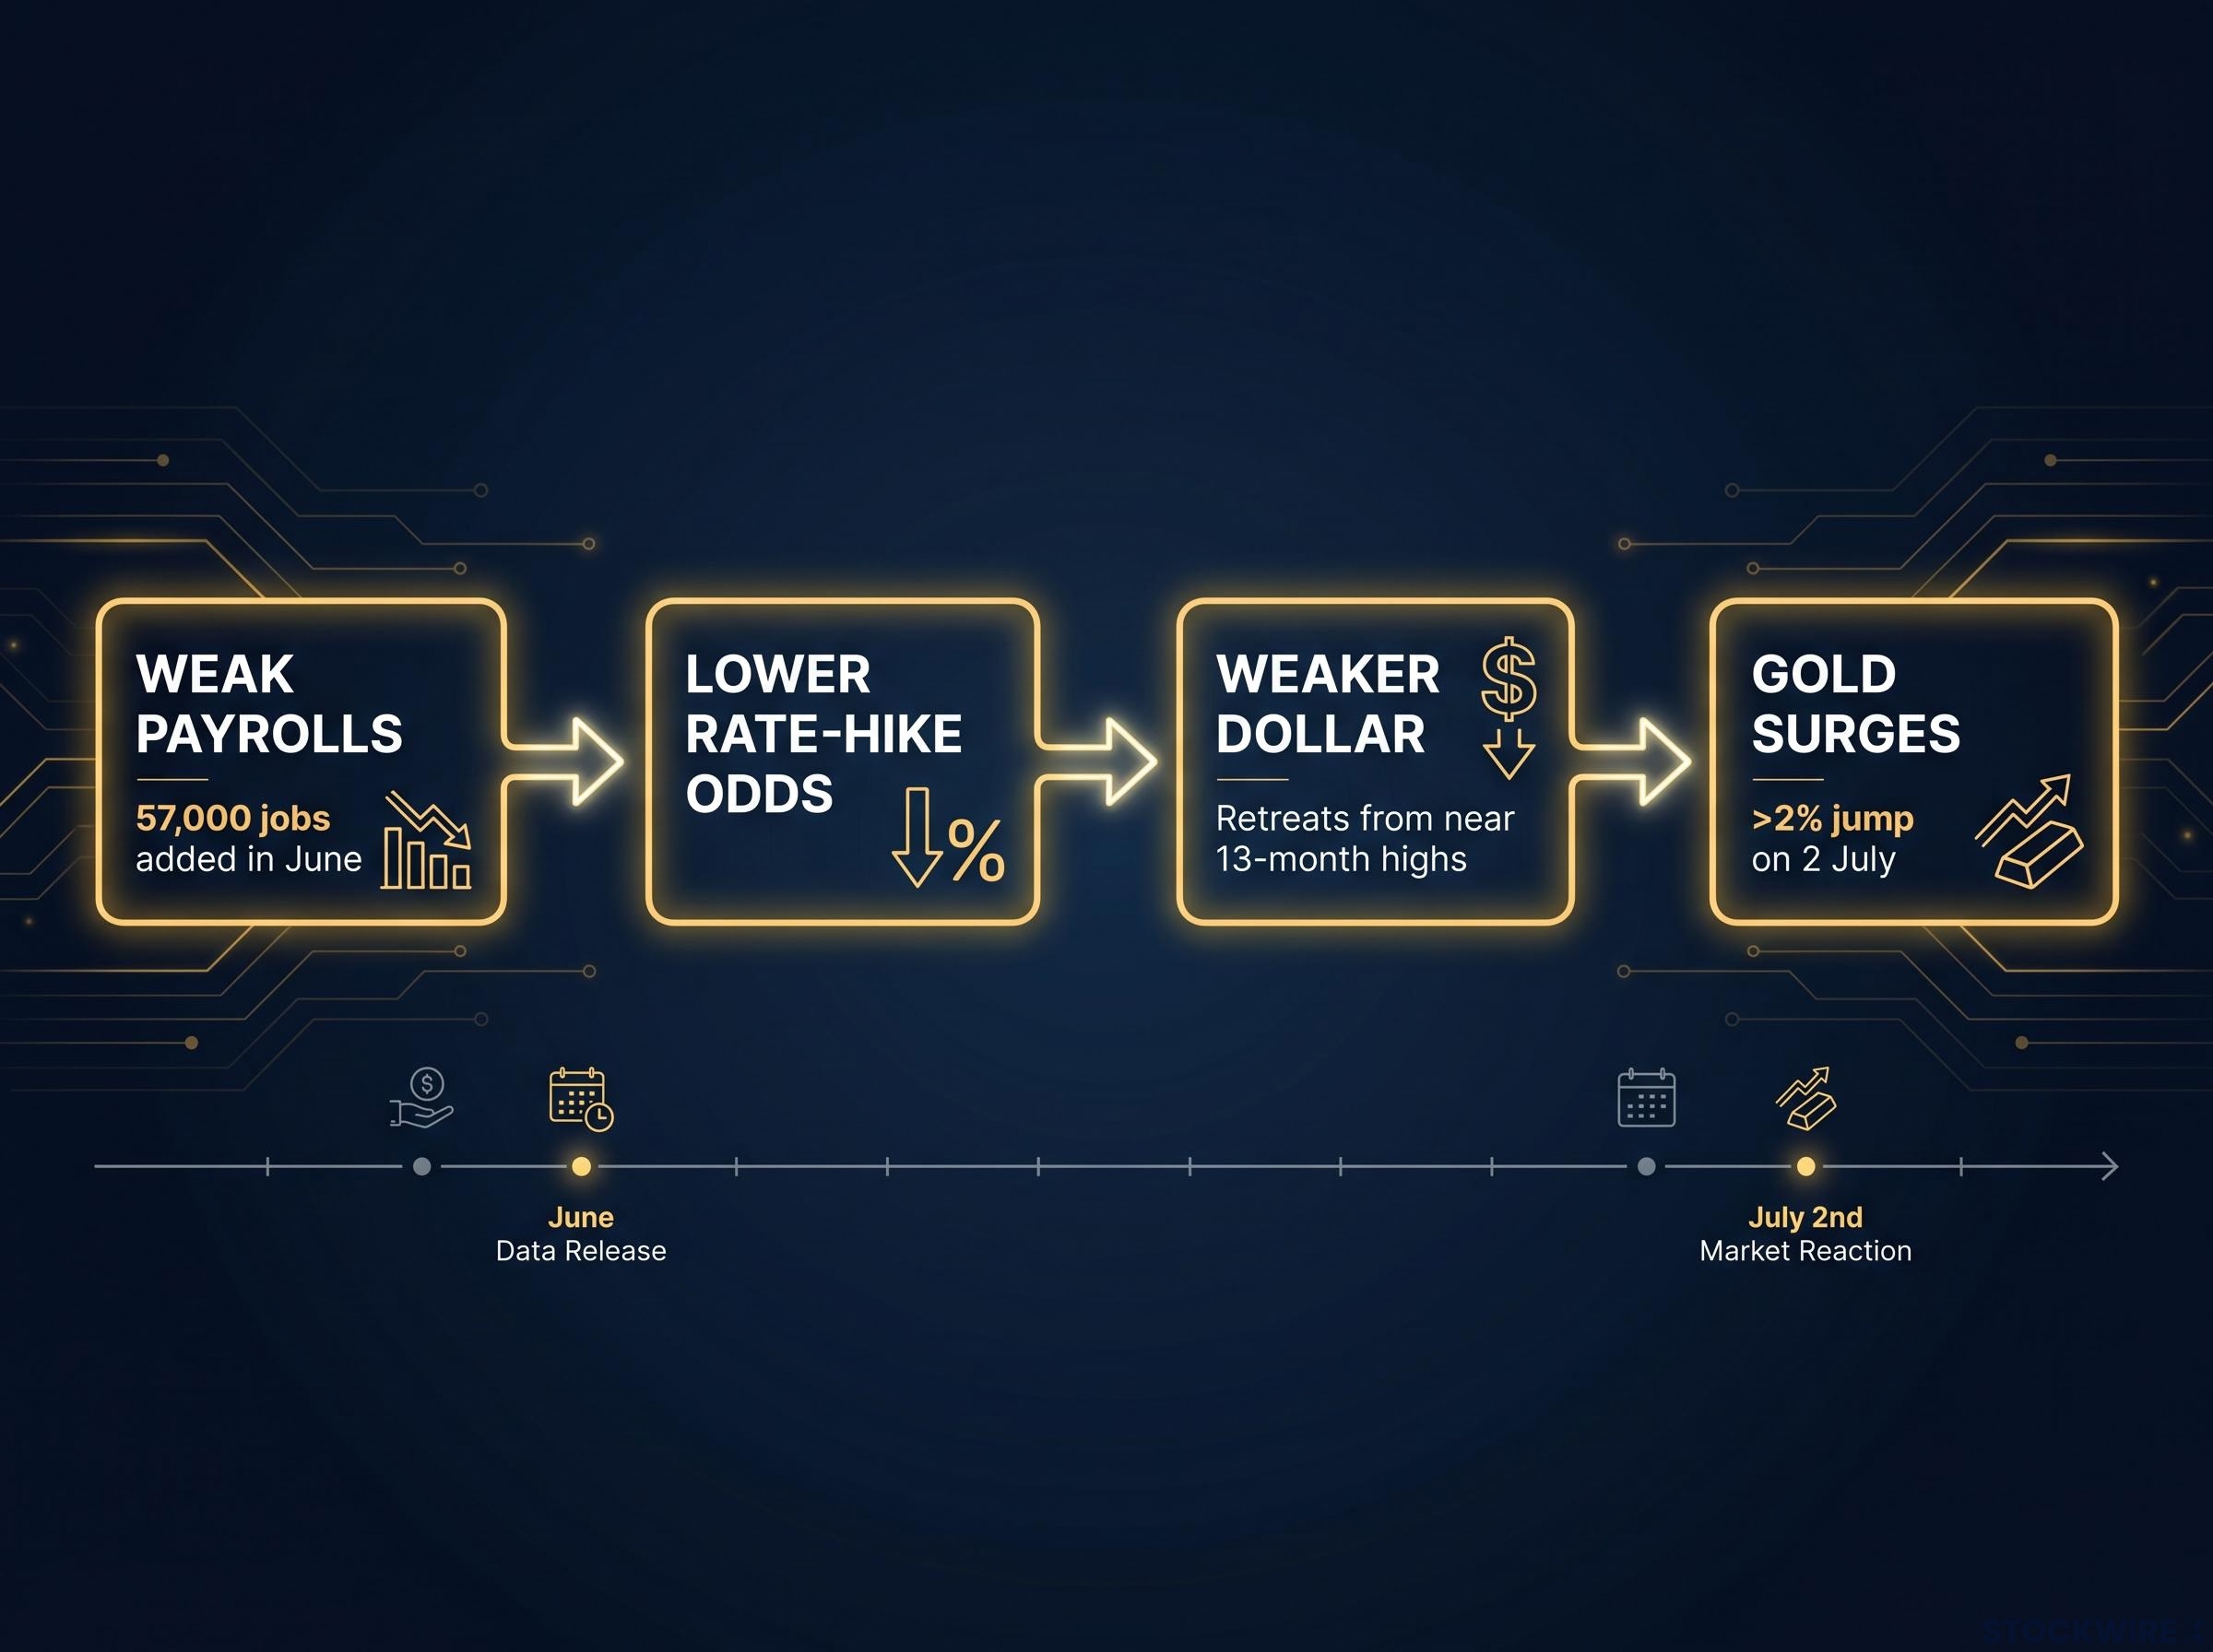
On 2 July, these two tailwinds, reduced rate-hike probability and a falling dollar, arrived simultaneously and compounded each other. That is why the reaction was a 2% surge rather than a modest uptick.
| Macro Event | Directional Impact on Gold |
|---|---|
| Weak payrolls (57,000 in June) | Bullish: reduces case for Fed tightening |
| Fed rate-hike odds falling | Bullish: lowers opportunity cost of holding gold |
| U.S. dollar decline from 13-month highs | Bullish: makes gold cheaper for non-U.S. buyers |
| Lower opportunity cost of holding gold | Bullish: non-yielding assets become relatively more attractive |
The next time a jobs report lands, the logic runs in the same direction. Strong payrolls strengthen the dollar and rate-hike odds, pressuring gold. Weak payrolls do the opposite. The framework does not change; only the data does.
Gold was not alone. The broader precious metals complex moved in the same direction on the same catalyst, which matters because it confirms the driver was macro rather than gold-specific.
Both metals had endured significant losses through Q2 2026, mirroring gold’s quarter under the same Fed-driven selling pressure. When every precious metal in the complex moves together on the same day, in response to the same payrolls release and the same dollar pullback, it signals a macro regime shift rather than isolated technical buying in a single asset.
If you hold silver or platinum exposure alongside gold, the read is the same: these positions moved for shared reasons, not independent ones. The durability question that applies to gold applies equally across the complex.
Before treating 2 July as a clean signal, one variable deserves attention: the session happened in thin trading.
2 July was the last full U.S. trading session before the July 4 public holiday. Reduced liquidity can amplify price moves relative to what underlying institutional positioning actually warrants. A 2% surge in normal-volume conditions carries more weight than a 2% surge when many desks are already offline.
The Fed’s own reaction function adds another layer of caution. Policymakers are unlikely to treat a single weak payrolls report as decisive. Chair Warsh and other officials may frame June’s 57,000 figure as noise rather than a confirmed trend, particularly if subsequent data rebound.
Two scenarios sit ahead:
The data between now and early August will determine which path holds.
For investors wanting to stress-test the recovery thesis before acting on it, our full explainer on gold price prediction failures examines three documented rate cycles where gold moved against every theoretically gold-positive condition, including a 20% decline during active tightening with 9.1% inflation in 2022-2023.
The mechanism is clear, the caveats are on the table, and the question reduces to four specific variables. Track these rather than just the spot price, and you will have a leading view of where gold moves next.
These four indicators, taken together, will tell you more about gold’s trajectory than any single session’s price action.
Gold’s 2 July session was real and significant: a more than 2% surge, a five-week losing streak broken, and a macro catalyst strong enough to move the entire precious metals complex. But one session does not reverse a 13% quarterly loss, and one payrolls miss does not confirm the Fed is done tightening.
The question is not whether gold can recover. It is whether the conditions that drove Q2’s selloff have genuinely shifted. If Chair Warsh signals openness to a pause, or if inflation data cooperate, gold’s rebound has structural support. If hawkishness persists and July’s payrolls rebound, the recovery stalls.
The July payrolls report, due in early August 2026, and the CPI releases between now and then represent the first genuine data tests of whether June’s 57,000 figure was an inflection point or an outlier.
For investors assessing how far a genuine recovery could run, our dedicated guide to Goldman’s $5,400 gold target details the structural pillars behind the call, including central bank accumulation of 750-850 tonnes in 2026 and modelled Fed rate cuts of 50 basis points providing approximately $120 per ounce of direct price support.
That is the window that matters. Until it closes, the answer remains open.
This article is for informational purposes only and should not be considered financial advice. Investors should conduct their own research and consult with financial professionals before making investment decisions. Past performance does not guarantee future results. Financial projections are subject to market conditions and various risk factors.
—
Gold surged more than 2% on 2 July after the June nonfarm payrolls report showed only 57,000 jobs added, well below market expectations. The weak data reduced the probability of further Fed rate hikes, pulled the U.S. dollar back from 13-month highs, and simultaneously lowered the opportunity cost of holding non-yielding bullion.
Weak payrolls reduce expectations for Fed rate hikes, which softens the U.S. dollar and lowers the opportunity cost of holding gold, pushing prices higher. Strong payrolls do the opposite: they reinforce rate-hike odds, strengthen the dollar, and pressure gold lower.
Gold shed approximately 13% through Q2 2026, unwinding all year-to-date gains and falling to its weakest level in eight months. The decline was driven by sustained Fed hawkishness under Chair Kevin Warsh, which kept rate-hike expectations elevated and raised the opportunity cost of holding non-yielding assets.
The four key variables are: Fed communications from Chair Warsh for any softening of hawkish language, upcoming CPI prints measured against the Fed's 2% target, the July 2026 payrolls report due in early August, and the direction of the U.S. Dollar Index after its pullback from 13-month highs.
Yes. Spot silver rose approximately 0.15% to $61.0580/oz and spot platinum gained approximately 0.2% to $1,627.92/oz on 2 July, confirming the driver was a macro regime shift rather than isolated buying in gold alone.