European Stocks Hit Highs While Institutional Money Stays Out
2 hrs ago
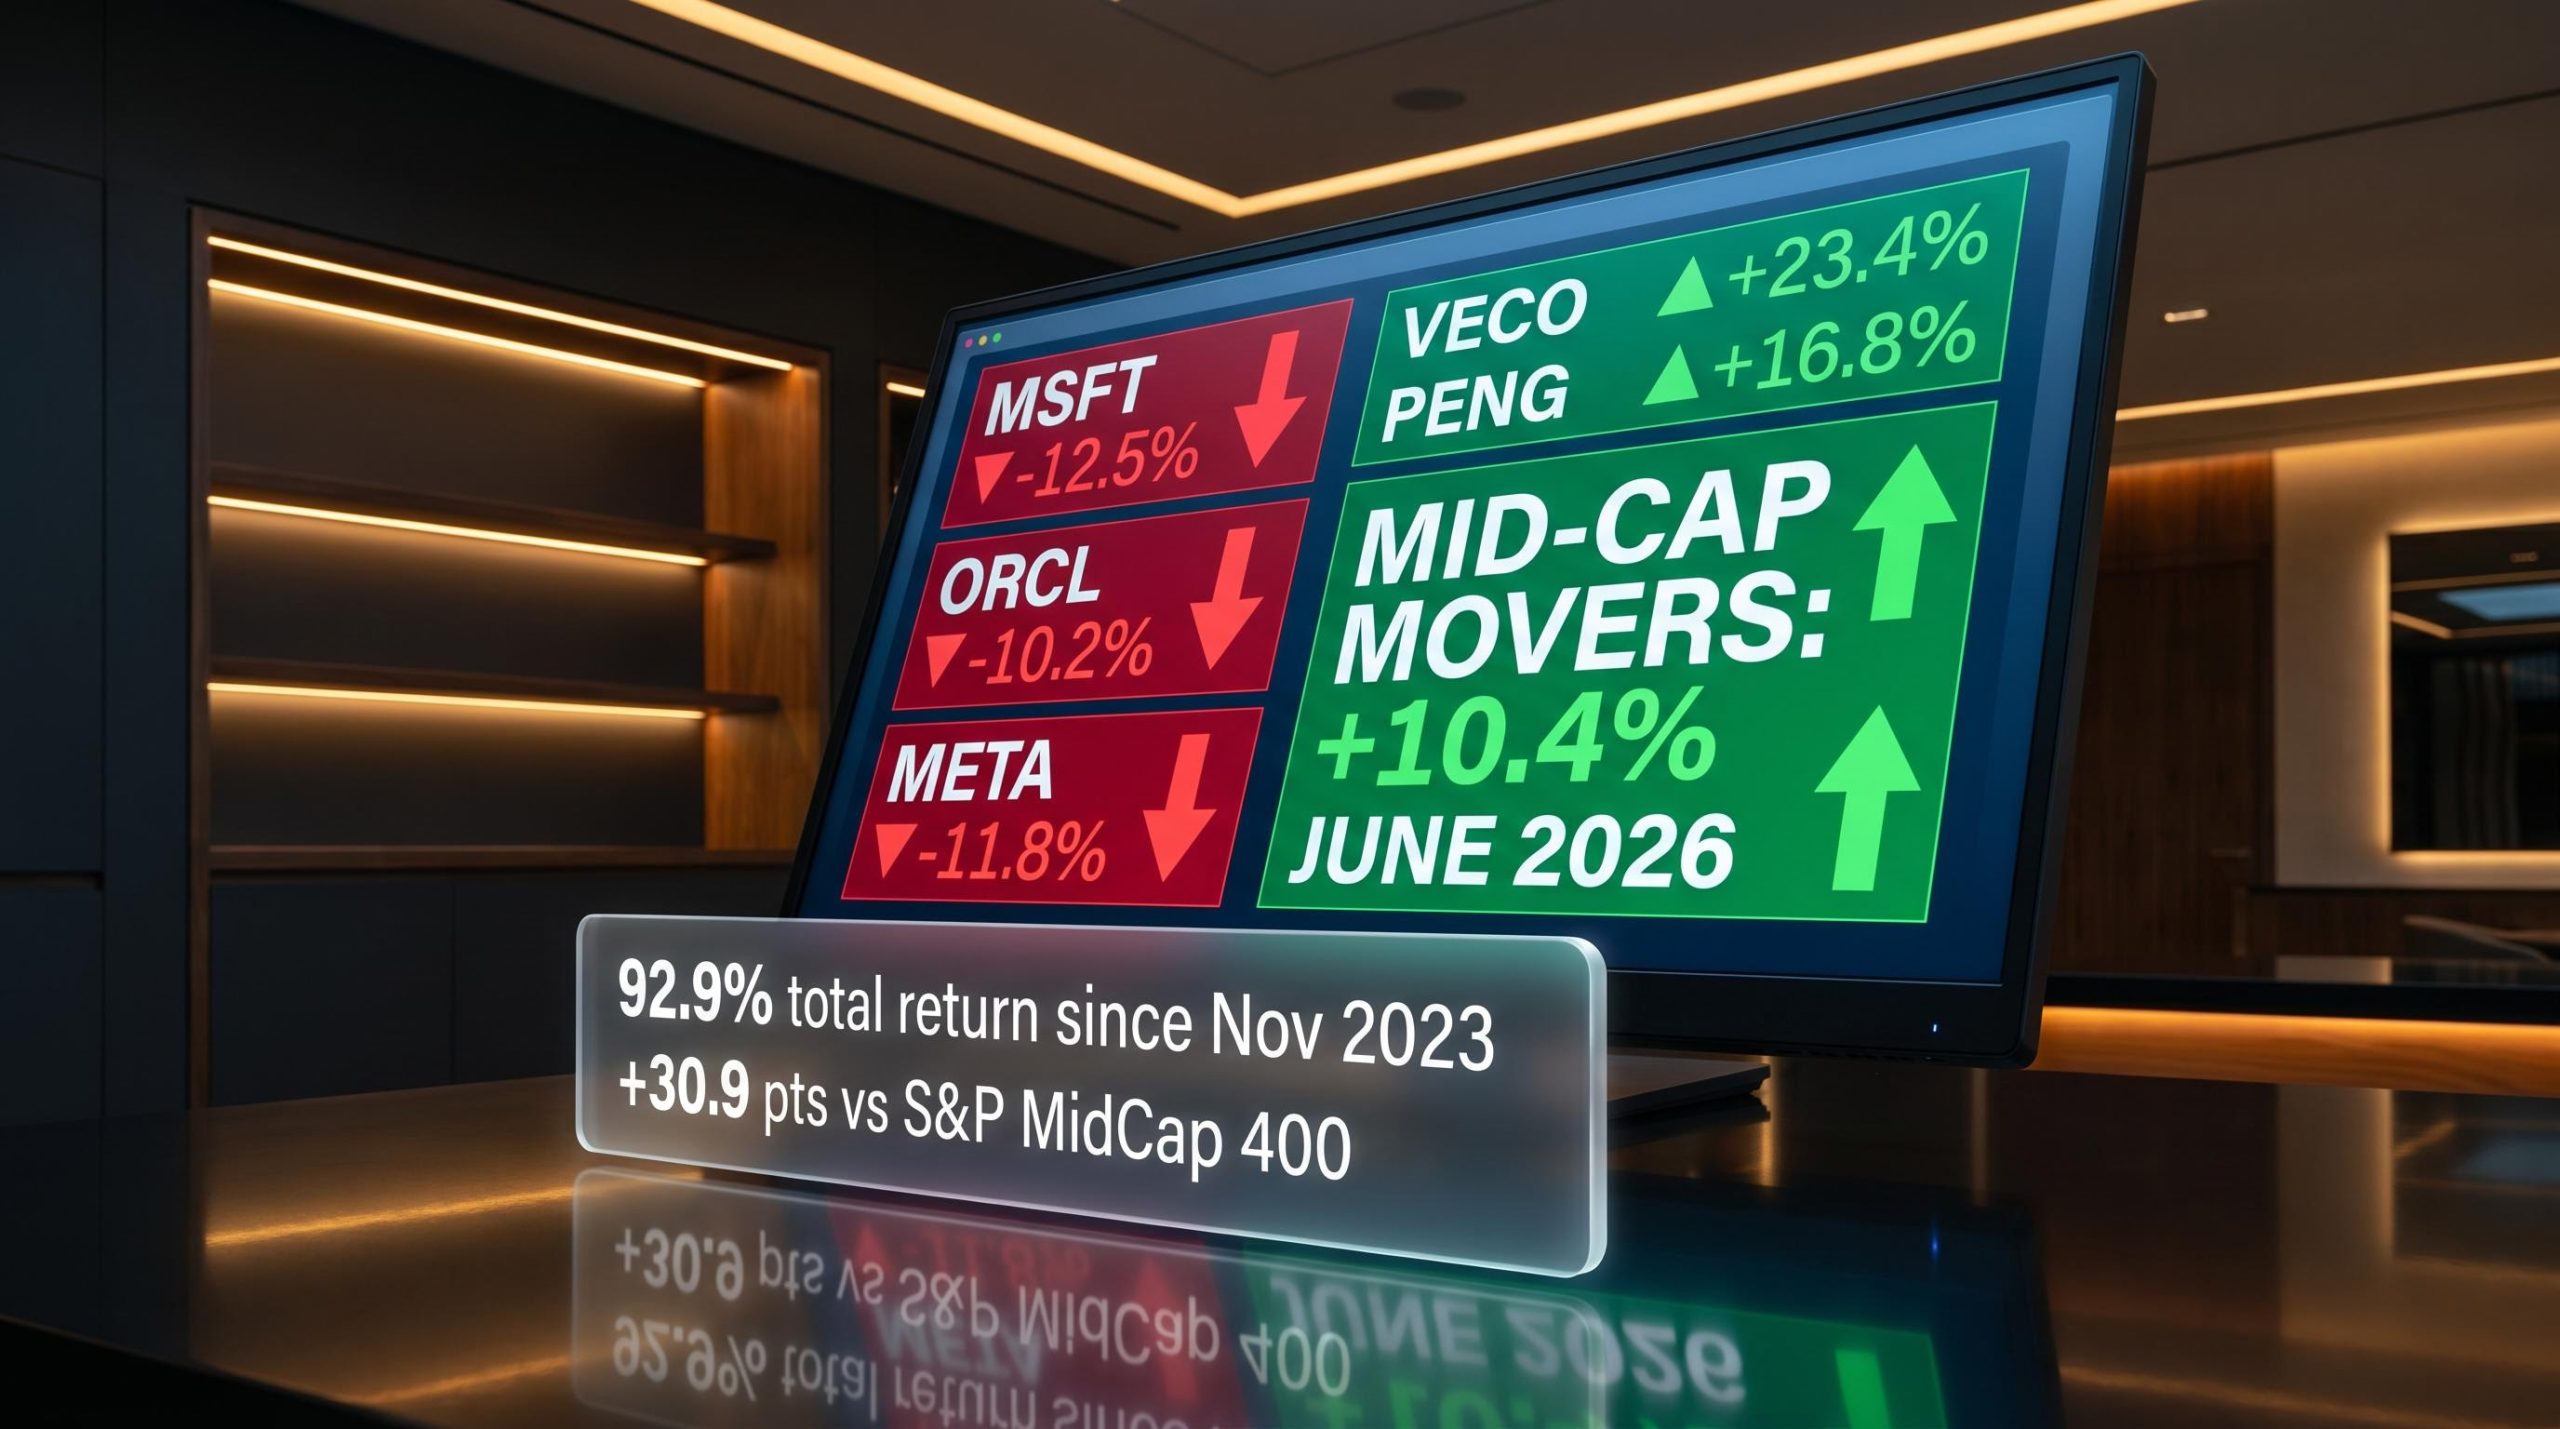
Microsoft, Oracle, and Meta each lost double digits in June 2026. In the same month, a 20-stock mid-cap AI strategy returned 10.4%. That gap is not a curiosity. It is a signal worth pulling apart.
The structural force behind this mid cap rotation is one that has been building for over a year: the Federal Reserve’s higher-for-longer rate stance. In June, that policy finally translated from strategist thesis to visible price action, compressing the valuations of the market’s most expensive names and redirecting capital toward companies whose earnings arrive sooner, not later.
Here is what this analysis covers: the specific rate mechanism that made mega-cap tech vulnerable, the two mid-cap AI infrastructure names that led the month, the two winners that were sold before the gains could reverse, and a four-part screening framework you can apply to find similar setups without a dedicated AI engine.
The repricing starts with a concept called equity duration. Duration, in bond markets, measures how sensitive a bond’s price is to changes in interest rates. The same logic applies to equities. A company whose cash flows are weighted far into the future, years or even decades of projected growth, behaves like a long-duration bond. When discount rates stay elevated, the present value of those distant cash flows compresses disproportionately.
Three conditions make an equity “long-duration” in practice:
That describes the profile of several mega-cap technology names. Microsoft, Oracle, and Meta each declined by double-digit percentages in June 2026, precisely because a 5%-plus rate structure punishes that profile.
Rising real yields, now sitting at 2.22% on the 10-year TIPS benchmark under Fed Chair Kevin Warsh, establish a materially higher hurdle rate that compresses the present value of distant cash flows and directly explains why long-duration equities repriced so sharply in June.
Mid-caps with improving margins and nearer-term earnings visibility sit at the opposite end of the duration spectrum. Their cash flows are closer, their valuations require less discounting, and their sensitivity to small rate movements is lower. The rotation was not a sentiment trade. It was a mathematically predictable repricing, and understanding the duration mechanism tells you where it persists as long as the rate structure holds.
The Mid-Cap Movers strategy runs 20 active positions against the S&P MidCap 400 as its benchmark and is categorised as a ProPicks AI product. Having begun selecting stocks in November 2023, it was highlighted as the featured strategy for July 2026 on the strength of its June showing.
The AI methodology ranks stocks across dozens of fundamental signals, screening for a specific combination of characteristics:
The rebalancing philosophy is worth understanding. The model prefers reweighting existing positions rather than forcing exits when upside remains attractive relative to risk. That distinction matters. It tells you the AI is calibrating conviction continuously rather than making binary in-or-out calls, which changes how you should interpret both the entries and the exits that follow.
The 10.4% June return becomes more useful as a framework guide when you can see which inputs generated it. Without the methodology, it is just a number. With it, it is a process you can approximate.
The ProPicks AI methodology evaluates over 100 financial and market variables across thousands of companies simultaneously, drawing on more than 25 years of historical data to dynamically re-weight factors as conditions shift, which explains why the rebalancing output for June produced both the specific exits and the position reweighting rather than a blanket liquidation.
| Stock | June 2026 Return | YTD Return (through 30 June) | Action Taken |
|---|---|---|---|
| Veeco Instruments (VECO) | ~23.4% | ~147.2% | Reweighted |
| Penguin Solutions (PENG) | ~16.8% | ~256.5% | Reweighted |
Veeco Instruments sits in the capital equipment layer of the AI infrastructure stack. Its June return of approximately 23.4% extended a year-to-date gain of roughly 147.2%, and the model reweighted rather than exited the position during the June rebalance.
Penguin Solutions occupies the memory and systems layer, where current data centre and high-performance computing CapEx cycles provide nearer-term earnings visibility. Its June return of approximately 16.8% extended an extraordinary year-to-date gain of roughly 256.5%. It was also reweighted.
The fact that both were reweighted tells you the AI model still sees risk-adjusted upside. Returns of that magnitude did not trigger a valuation-driven exit, which is itself a signal about how the model sizes conviction.
AI infrastructure binding constraints, particularly multi-year grid interconnection delays and liquid cooling adoption thresholds, are what make capital equipment suppliers like Veeco structurally positioned rather than cyclically exposed, a distinction that also explains why the model reweighted rather than exited after a 147% year-to-date gain.
What these two names share is a specific combination that the market rewarded in June:
The rotation rewarded a specific factor combination, not a blanket “buy mid-caps” call. That distinction matters for identifying similar candidates in the months ahead.
Exit discipline is where most individual investors underperform relative to systematic strategies. The two June exits illustrate exactly what triggers a rule-based sell.
| Stock | Holding-Period Return | Exit Trigger | Key Risk Metric |
|---|---|---|---|
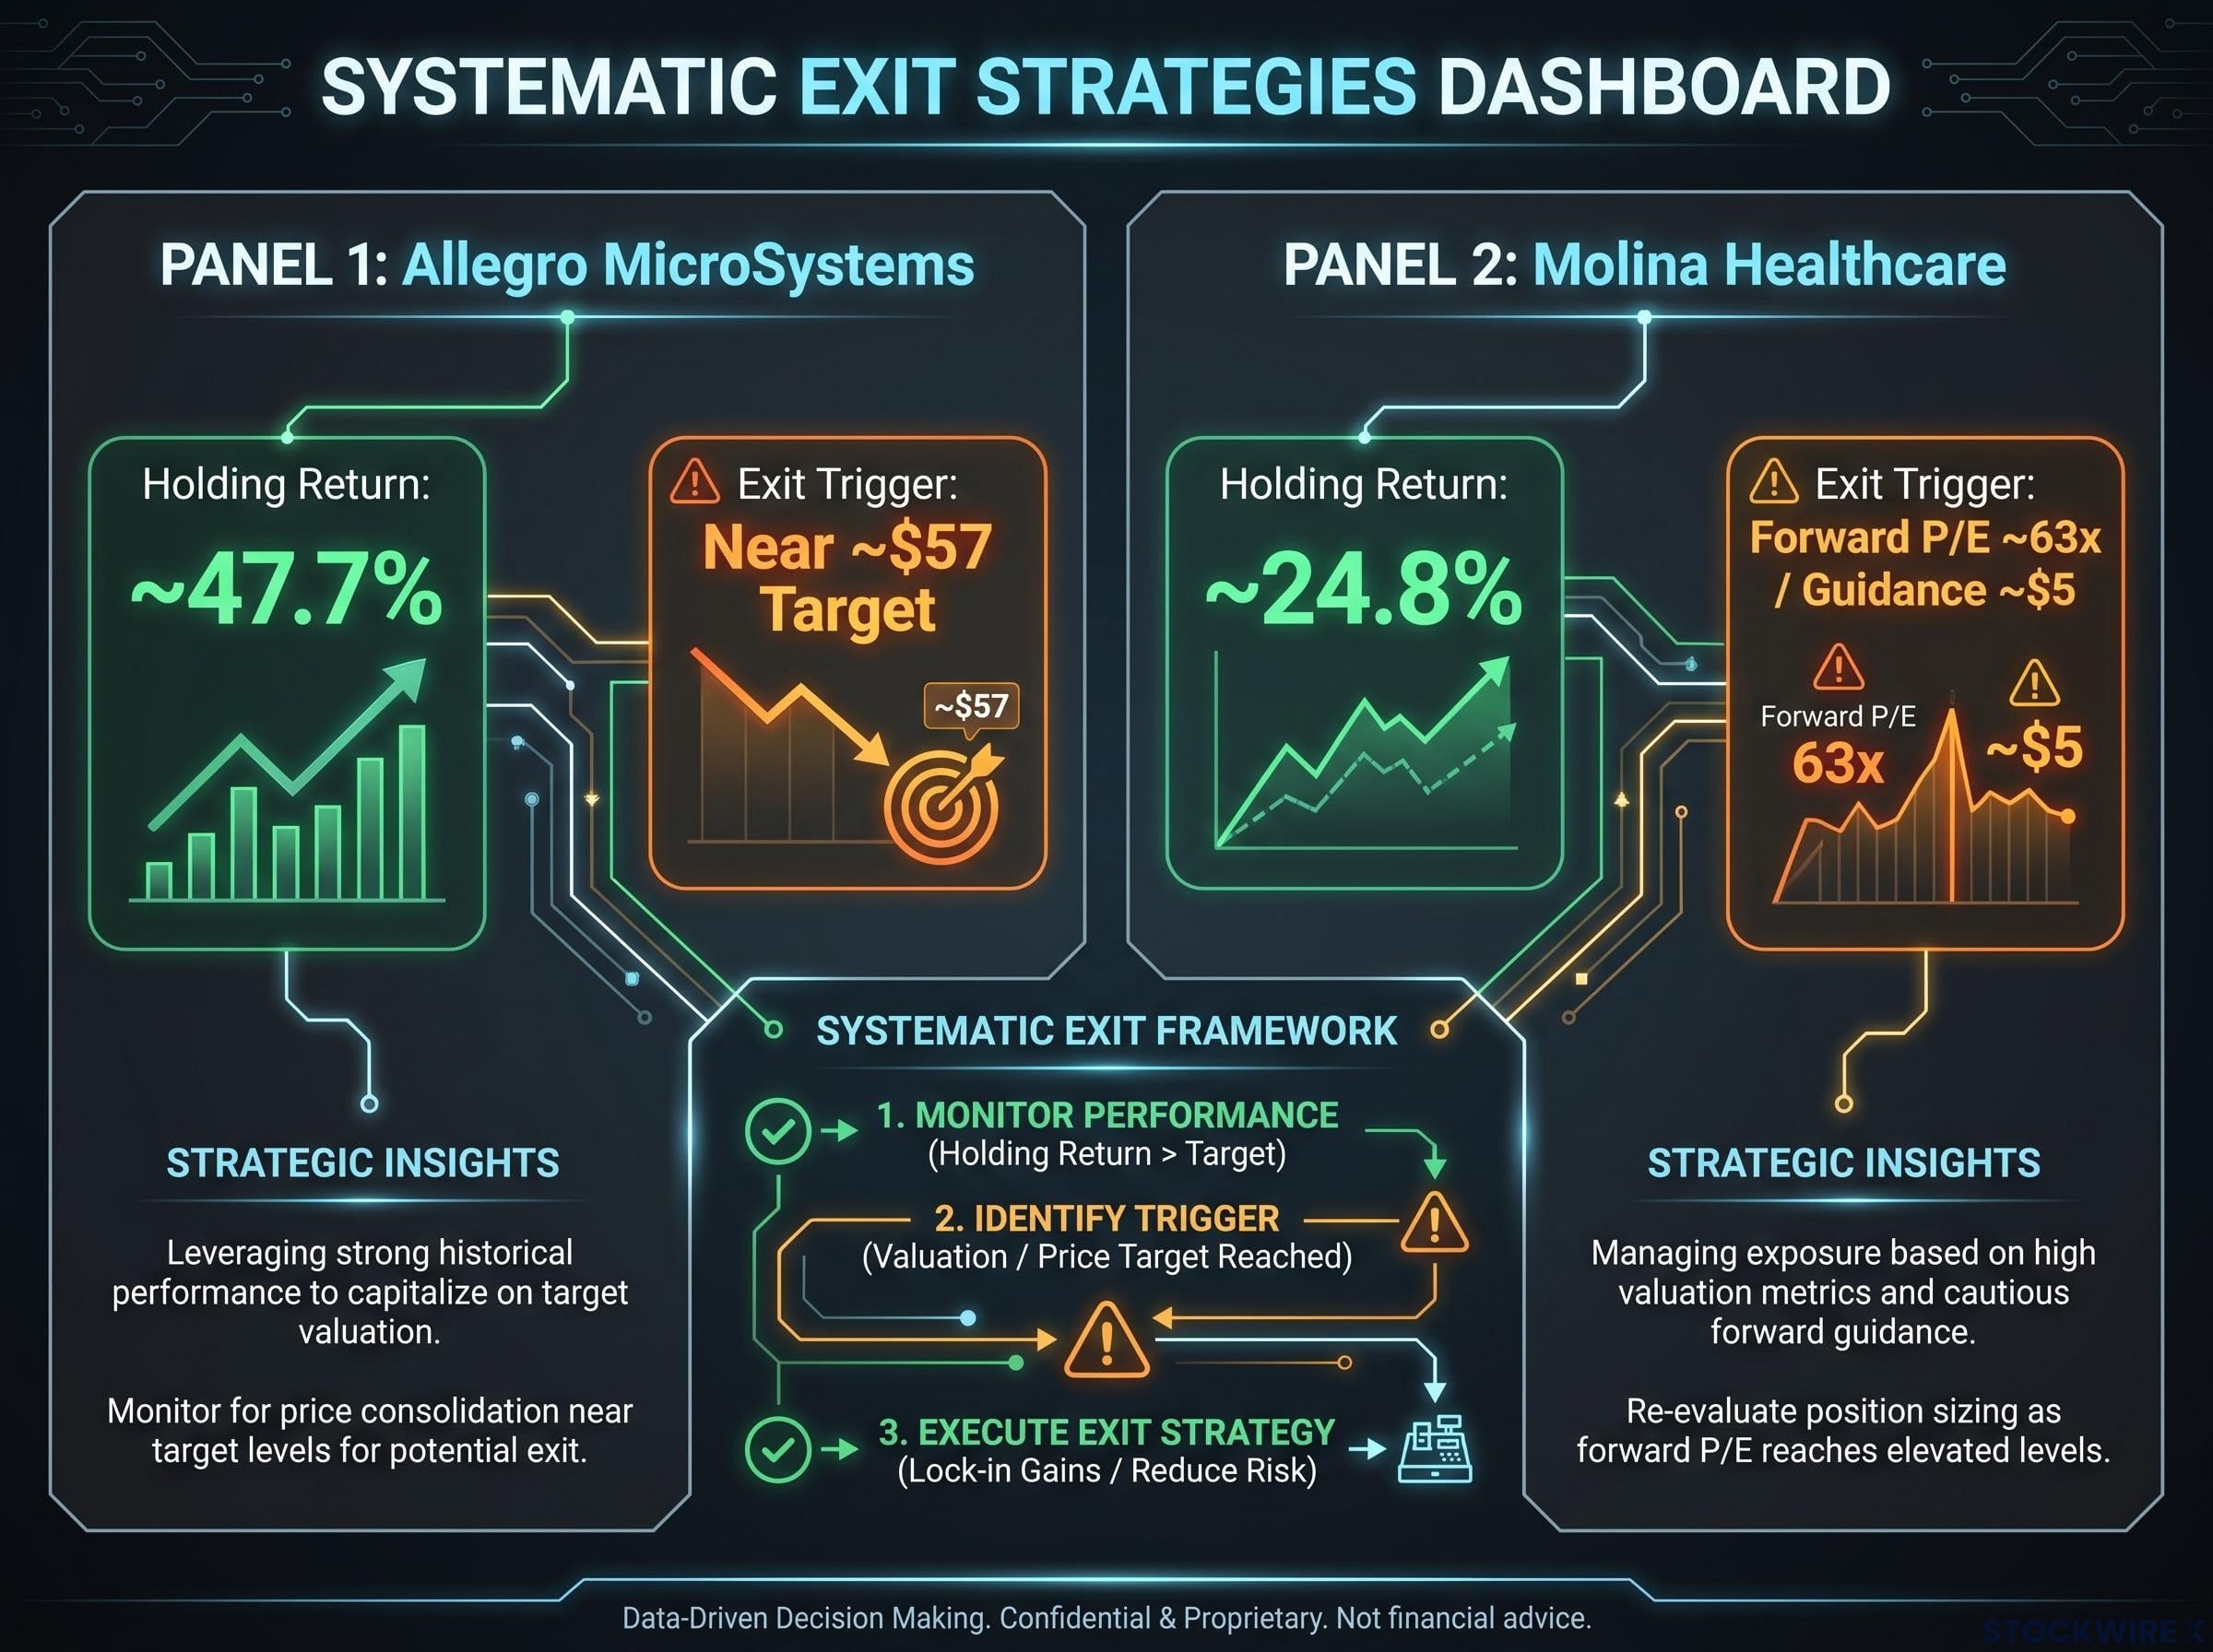
| Allegro MicroSystems (ALGM) | ~47.7% | Valuation extension past analyst consensus targets | Trading near/beyond ~$57 per share consensus target |
| Molina Healthcare (MOH) | ~24.8% | Guidance reduction + stretched multiple + volatile trading | Forward P/E ~63x after guidance cut to ~$5 per share |
Over a roughly 30-day holding window, Allegro MicroSystems generated a gain of approximately 47.7%, with the stock’s year-to-date appreciation sitting near 164% when the position was closed. The underlying business remained in good shape: AI-linked power semiconductors, margin improvement, and a substantial lift in data centre revenues. Even so, the model closed the position once the share price had moved through the analyst consensus target of around $57 per share, reducing the remaining margin of safety to a point the model could no longer justify. The decision was driven by valuation, not by any deterioration in the company’s fundamentals.
Over a comparable holding window, Molina Healthcare produced a return of roughly 24.8%, and the reasoning behind the exit offers a useful lesson for investors managing their own books. The company’s results had held up well: Q1 2026 earnings came in ahead of expectations and a new Illinois Medicaid contract had been added. The business itself had not stumbled.
What shifted was the forward risk picture. A reduction in guidance to around $5 per share created the problem.
When the revised guidance was absorbed by the market, Molina Healthcare’s forward price-to-earnings ratio climbed to roughly 63 times earnings, eliminating the valuation buffer that had originally made the position attractive.
That combination, stretched multiple plus guidance cut plus volatile trading behaviour, is a specific, repeatable sell signal. It is not a judgement call unique to this stock. For you, the Molina exit is the clearer template: when an elevated multiple coincides with weakening guidance and jumpy price action, the risk-adjusted profile has deteriorated regardless of how strong the prior gains were. Acting on that signal before the reversal is what separates systematic discipline from anchoring to a winning thesis.
The factor biases embedded in the Mid-Cap Movers strategy translate into a four-part screening framework any investor can apply systematically:
The Molina Healthcare exit demonstrates this fourth dimension precisely. Volatility alone did not trigger the exit. Volatility combined with a 63x forward multiple and a guidance cut did. That three-factor combination is the signal, and it is one you can monitor without an AI engine.
According to ProPicks AI strategy data, the ProPicks strategies collectively achieved a year-to-date win rate of 73% as of mid-2026. That figure tells you the edge comes from process consistency, from applying these screening dimensions systematically across dozens of positions, not from identifying one great trade. You can capture a portion of that edge by applying the same discipline over time.
For investors wanting to operationalise the four-part screening framework above into an actual stock pipeline, our full explainer on sourcing undervalued mid-cap candidates covers four distinct sourcing methods used by Buffett, Lynch, Klarman, and Greenblatt, with specific screening tools that surface names before analyst coverage arrives.
June’s rotation is better understood as a structural repricing of duration, leverage, and valuation risk than as a one-month tactical trade. The macro conditions driving it, higher-for-longer rates and mega-cap multiple compression, have not reversed.
From its launch in November 2023 through to the end of June 2026, the Mid-Cap Movers strategy has compounded to a total return of 92.9%, beating the S&P MidCap 400 by +30.9 percentage points over the same period. The June 2026 month alone accounted for +6.9 percentage points of that margin over the benchmark.
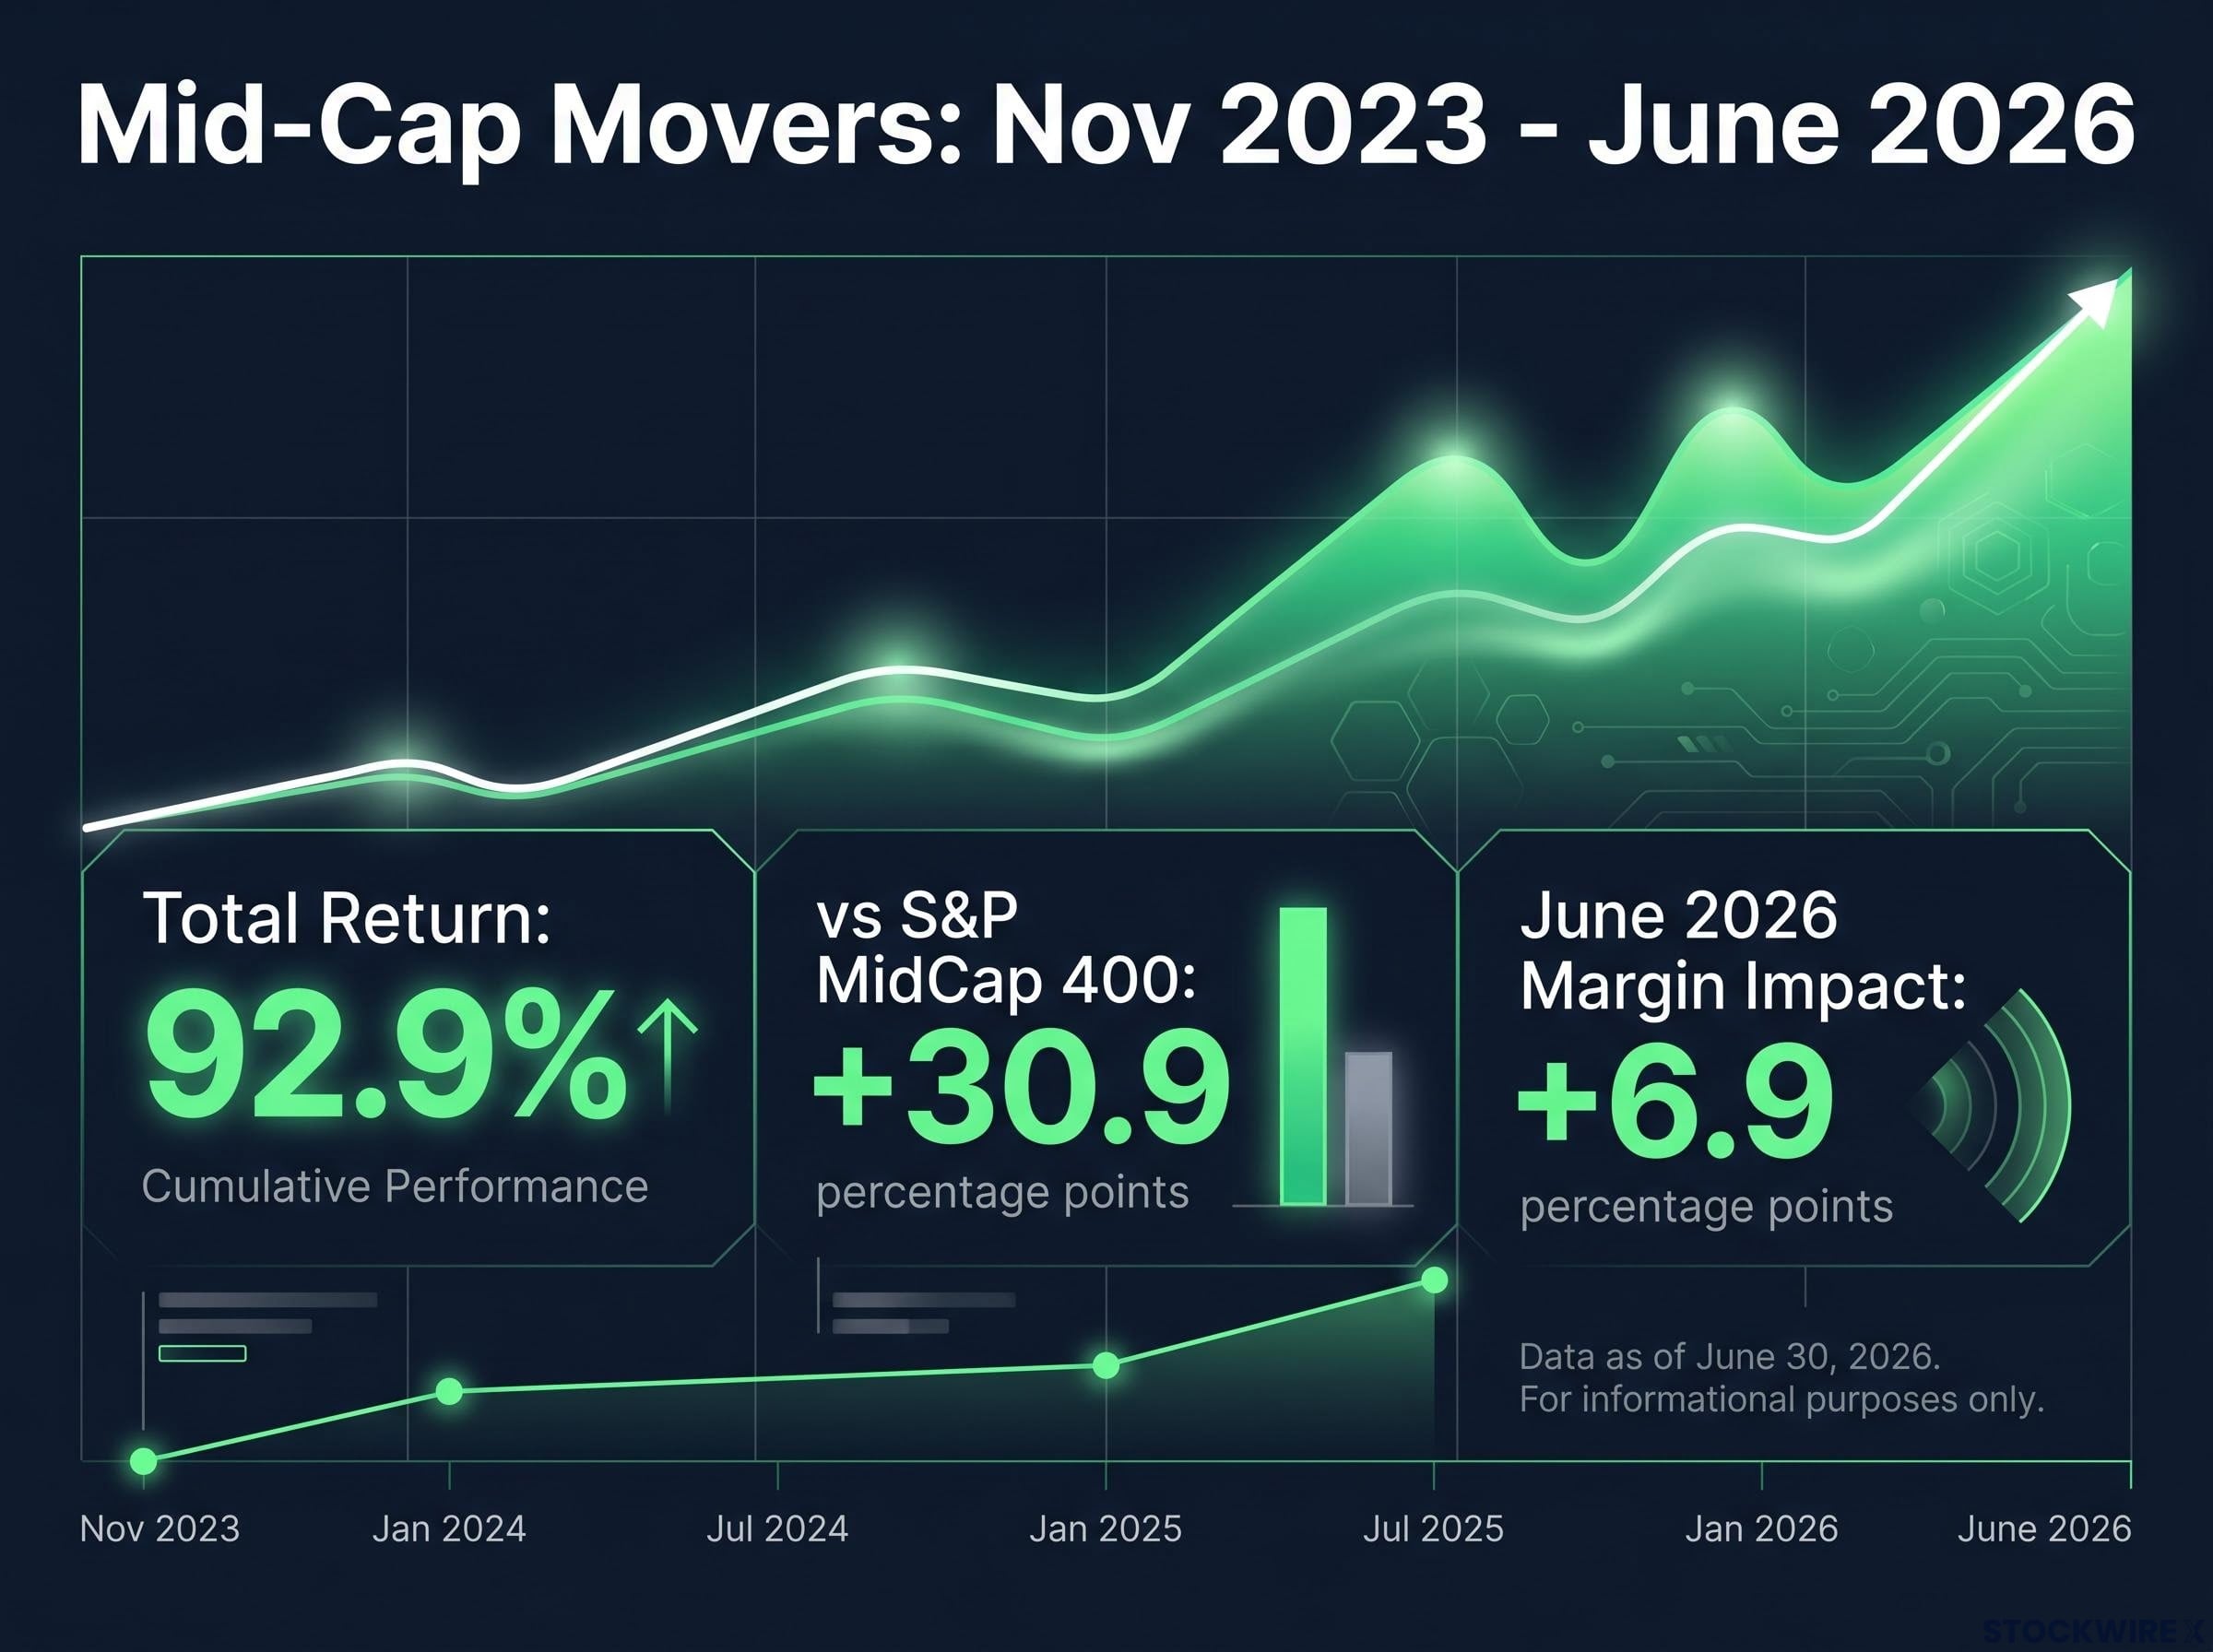
That track record contextualises the June performance within a longer-run pattern: mid-caps with real earnings power and AI adjacency have been rewarded consistently, not just in a single month.
Two risks could unwind this leadership. A rapid Fed pivot would compress the duration advantage that currently favours mid-caps. A broad earnings deterioration would remove the near-term visibility premium that insulates them from rate pressure. Neither has materialised, but both deserve monitoring.
Three specific variables will determine whether mid-cap factor leadership persists into the second half of 2026:
For you, these three variables are the concrete decision inputs. Monitor them rather than reacting to month-to-month price action. The framework that drove June’s outperformance is repeatable; the question is whether the conditions that reward it persist.
This article is for informational purposes only and should not be considered financial advice. Investors should conduct their own research and consult with financial professionals before making investment decisions. Past performance does not guarantee future results. Financial projections are subject to market conditions and various risk factors.
Mid-cap rotation is when investors shift capital from large-cap stocks into mid-cap names, typically in search of better risk-adjusted returns. In June 2026, the Federal Reserve's higher-for-longer rate policy compressed the valuations of long-duration mega-cap tech stocks, redirecting capital toward mid-caps with nearer-term earnings visibility and lower sensitivity to elevated discount rates.
Equity duration measures how sensitive a stock's price is to changes in interest rates, with companies whose cash flows are weighted far into the future behaving like long-duration bonds. When rates stay elevated above 5%, those distant cash flows are discounted more heavily, which is why Microsoft, Oracle, and Meta each fell by double digits in June 2026 while shorter-duration mid-caps gained.
Veeco Instruments (VECO) and Penguin Solutions (PENG) led the month, returning approximately 23.4% and 16.8% respectively, extending year-to-date gains of roughly 147.2% and 256.5%. Both occupy the AI infrastructure stack, in capital equipment and memory systems, and were reweighted rather than exited by the model after those gains.
Allegro MicroSystems was exited after the share price moved through the analyst consensus target of around $57, eliminating the margin of safety despite strong fundamentals and a roughly 47.7% holding-period gain. Molina Healthcare was sold after a guidance cut pushed its forward price-to-earnings ratio to approximately 63 times earnings, combining a stretched multiple with weakening guidance and volatile price action to create a clear risk-adjusted deterioration signal.
The four-part framework from the Mid-Cap Movers strategy covers financial resilience (positive free cash flow, manageable debt), earnings and margin trajectory (multi-quarter improvement tied to current spending cycles), valuation versus realistic expectations (avoiding names that have priced in all good news), and volatility as a sell signal when it coincides with stretched multiples and guidance cuts. Applying these filters systematically approximates the process that delivered a 73% win rate across ProPicks strategies year-to-date through mid-2026.