Why AUD/USD Hinges on the Strait of Hormuz, Not the RBA
1 hr ago

The Federal Reserve did not change interest rates in June. It changed its language. For the currency market, the effect was the same.
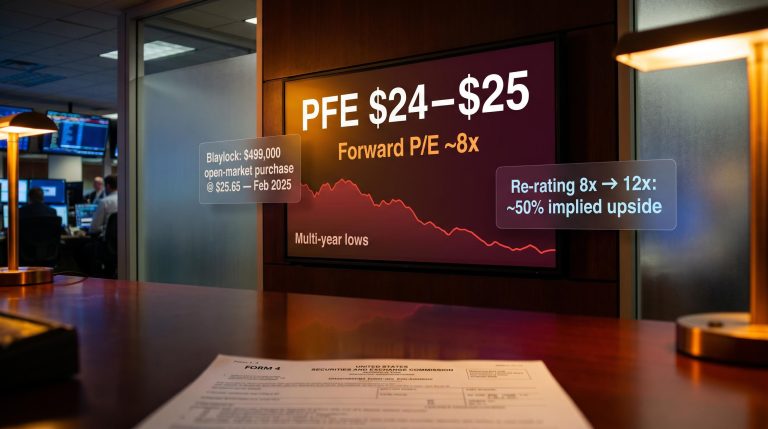
The May 2026 core Personal Consumption Expenditures (PCE) price index, the Fed’s preferred inflation gauge, landed at 0.3% month-over-month on 25 June, matching consensus and the prior month’s upwardly revised reading. The year-over-year figure hit 3.4%, the highest since October 2023. Within hours, the US Dollar Index (DXY) consolidated back above 100, and rate-cut expectations for 2026 compressed further.
Here is what the data actually tells you about Fed policy and the dollar right now: the inflation print, the guidance shift, the technical setup above 100, and the cross-asset consequences for anyone holding dollar-denominated positions.
A 0.3% monthly core PCE reading on its own is not alarming. What made the 25 June release from the Bureau of Economic Analysis (BEA) significant is that it was the second consecutive month at that pace.
The prior month’s figure was revised upward to 0.3%, meaning the disinflation trend that markets had been pricing through late 2025 and early 2026 has now stalled at a level materially above the Fed’s 2% target. The 3.4% year-over-year reading confirmed it.
The BEA personal income and outlays release confirmed that core PCE excluding food and energy rose 0.3% month-over-month and 3.4% from one year ago, the two figures that have now locked the Fed into its current restrictive posture.
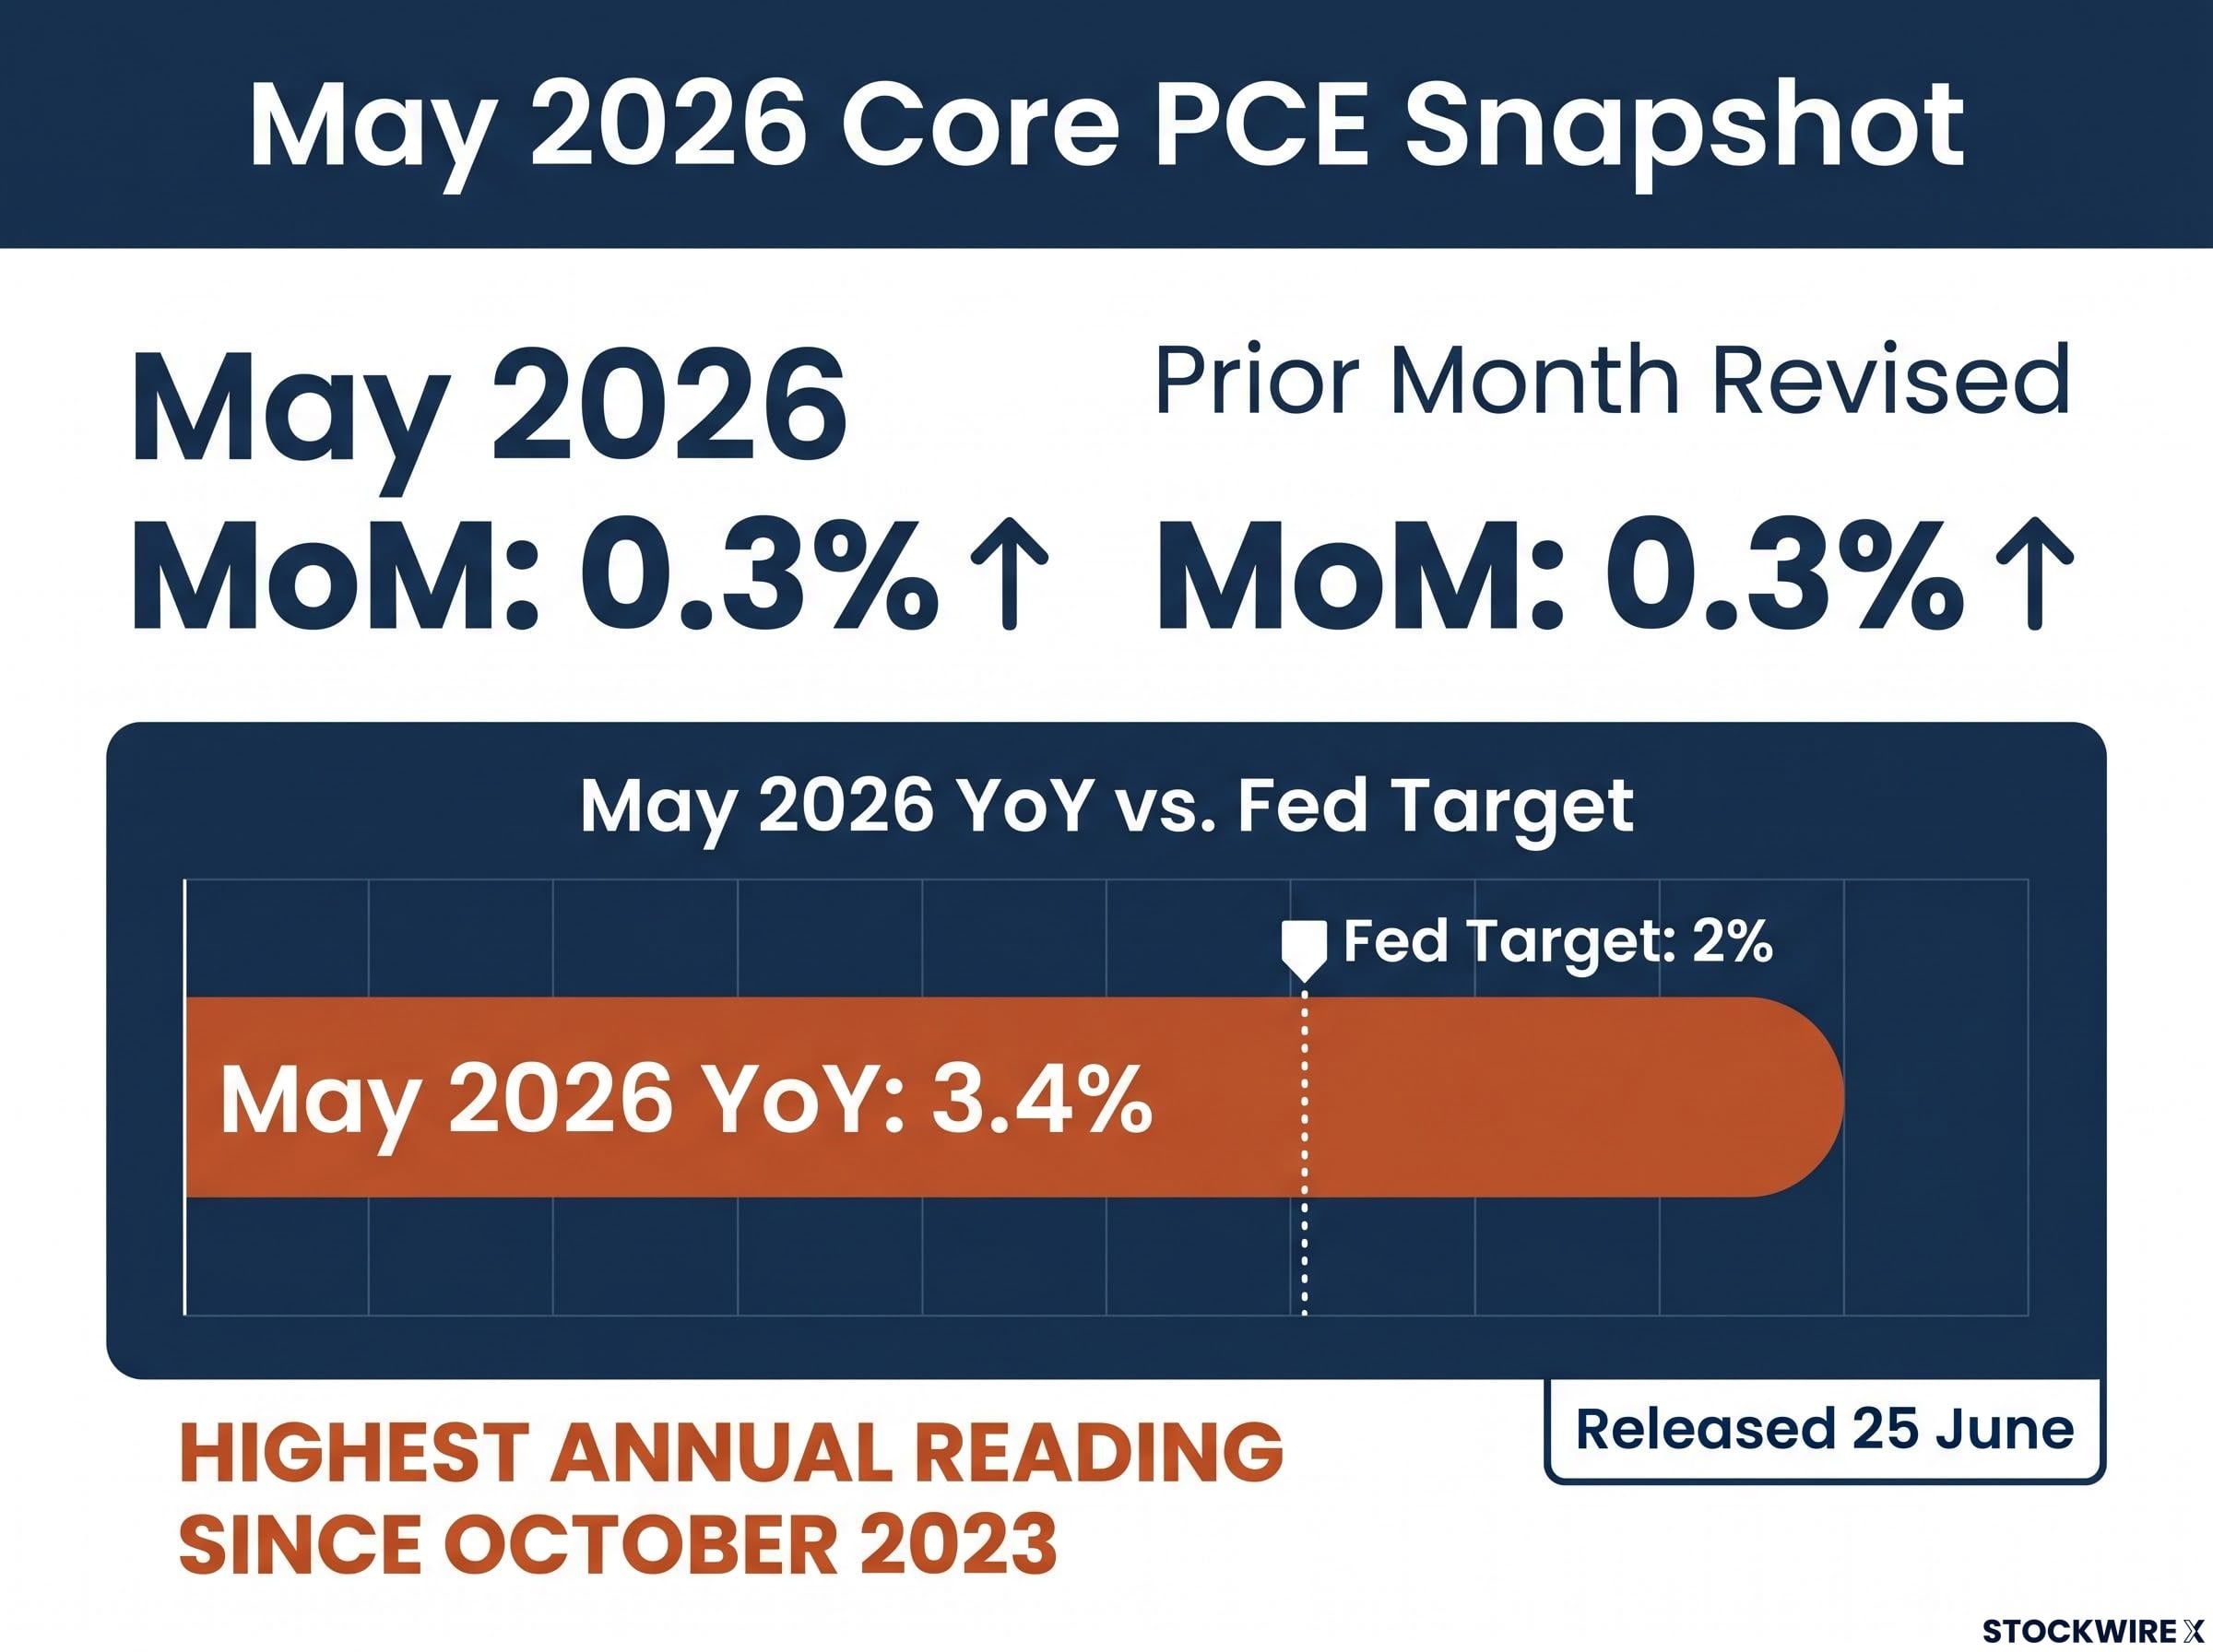
3.4% year-over-year core PCE (May 2026): the highest annual reading since October 2023, and the clearest signal that inflation is not gliding smoothly back to the Fed’s 2% target.
The Federal Reserve uses core PCE rather than the Consumer Price Index (CPI) as its primary inflation gauge for three reasons:
Two consecutive months at 0.3% is not statistical noise. It tells you the disinflation path has stalled at a level that makes Fed rate cuts a 2026 story at best, not a near-term probability.
At its Central Bank week meeting, the FOMC chose to strip out specific wording from its policy statement that had previously left room for a return to lower rates. The federal-funds rate itself was left unchanged, as was the pace of quantitative tightening (QT), the process by which the Fed reduces the size of its balance sheet by letting bonds mature without reinvesting the proceeds. The key change was a firmer commitment in the statement’s language to restoring inflation to moderate levels, cementing price stability as the Committee’s overriding focus.
The announcement had been broadly telegraphed in advance, which kept the initial market reaction contained. Equity indices dipped at first but found their footing, and stocks closed the week marginally higher.
Markets process guidance shifts differently from actual rate moves. A guidance change reprices the expected timing of future rate cuts, which flows through to currency markets and duration positioning rather than triggering the same immediate volatility as a surprise rate decision.
Fed policy transmission from overnight rate decisions to real economic outcomes operates through long and variable lags, which is precisely why the FOMC focuses on guidance language and forward expectations rather than relying solely on rate moves to signal its inflation-fighting resolve.
For investors tracking the Fed, this distinction carries a practical consequence: the next PCE print now carries more weight than the next FOMC meeting date. The guidance is already hawkish. The data will determine whether it gets more hawkish or begins to soften. Conflating a guidance shift with a rate move leads to mispriced expectations and, eventually, to being caught off guard when the dollar strengthens even without a rate increase.
The DXY closed at approximately 101.37 on 26 June 2026. That level sits comfortably above both the 50-day simple moving average (SMA) at approximately 98.90 and the 200-day moving average (MA) at approximately 99.30.
| Indicator | Value | Significance |
|---|---|---|
| DXY Spot | ~101.37 | Trading above both key moving averages |
| 50-day SMA | ~98.90 | Price cleared this level during the 2026 recovery |
| 200-day MA | ~99.30 | Sustained move above confirms medium-term trend shift |
| Psychological Level | 100 | Round-number anchor concentrating market attention |
The 100 level functions as more than a number. Round figures concentrate market attention and often become self-reinforcing support or resistance levels once price consolidates around them. Price is now testing resistance at an upper trendline, and clearing it convincingly would depend on macro follow-through: further PCE readings to the upside, more explicitly hawkish Fed communications, or a combination of the two.
DXY above 100 reflects the market’s direct answer to the higher-for-longer narrative. It is technically constructive, but the move is already priced into consensus positioning. The next catalyst is the data, not the level itself.
For investors using the DXY as a macro signal, knowing where the moving averages sit relative to the current price tells you whether the strong-dollar thesis is a crowded trade or a trend still building momentum.
Dollar strength does not stay in the currency market. It transmits directly into four asset classes, and each one carries consequences for investors already positioned in them.
The primary driver is interest-rate differentials. Higher relative US rates attract carry flows, where investors borrow in lower-yielding currencies and park capital in higher-yielding dollar assets. This supports the greenback against rate-sensitive currencies, particularly the Japanese yen, given the Bank of Japan’s continued dovish stance relative to the Fed.
The transmission channels break down as follows:
If you hold international equities, EM bonds, or commodity exposure, sustained DXY strength above 100 is not a currency story that happens somewhere else. It is a direct return drag you need to account for in how you are positioned right now.
Core PCE, or the core Personal Consumption Expenditures price index, strips out food and energy prices because those components are volatile enough to distort the underlying inflation signal. What remains is a cleaner read on demand-side price pressures across the economy.
The measure uses a chain-weighted methodology, meaning it continuously adjusts for the fact that consumers change their spending habits when prices shift. CPI, by contrast, uses a fixed basket. That substitution bias in CPI causes it to overstate inflation relative to core PCE, which is precisely why the Fed’s 2% target is anchored to PCE rather than CPI.
The diagnostic distinction between headline versus core inflation matters here: May 2026 headline CPI ran at 4.2% year-over-year, largely energy-driven, while core CPI held at a softer 2.9%, confirming the spike was supply-side rather than demand-side, a divergence that shaped the Fed’s decision to hold rather than tighten further.
The Cleveland Fed analysis of PCE versus CPI methodology details how the chain-weighting formula and broader spending basket give policymakers a structurally cleaner inflation signal than the fixed-basket CPI, which is why the Fed’s 2% target is anchored to PCE and not to the headline CPI figure most investors follow.
The three structural differences that give core PCE its policy weight:
The Fed’s 2% inflation target is a PCE-based benchmark, not a CPI benchmark. Investors tracking CPI as their primary inflation signal are watching the wrong number for anticipating policy moves.
The Fed does not react to a single monthly print in isolation. It monitors three-month and six-month annualised core PCE trends alongside the headline figure. Knowing this tells you when to treat a data surprise as a market-moving signal and when to treat it as noise that will fade before it reaches the policy reaction function.
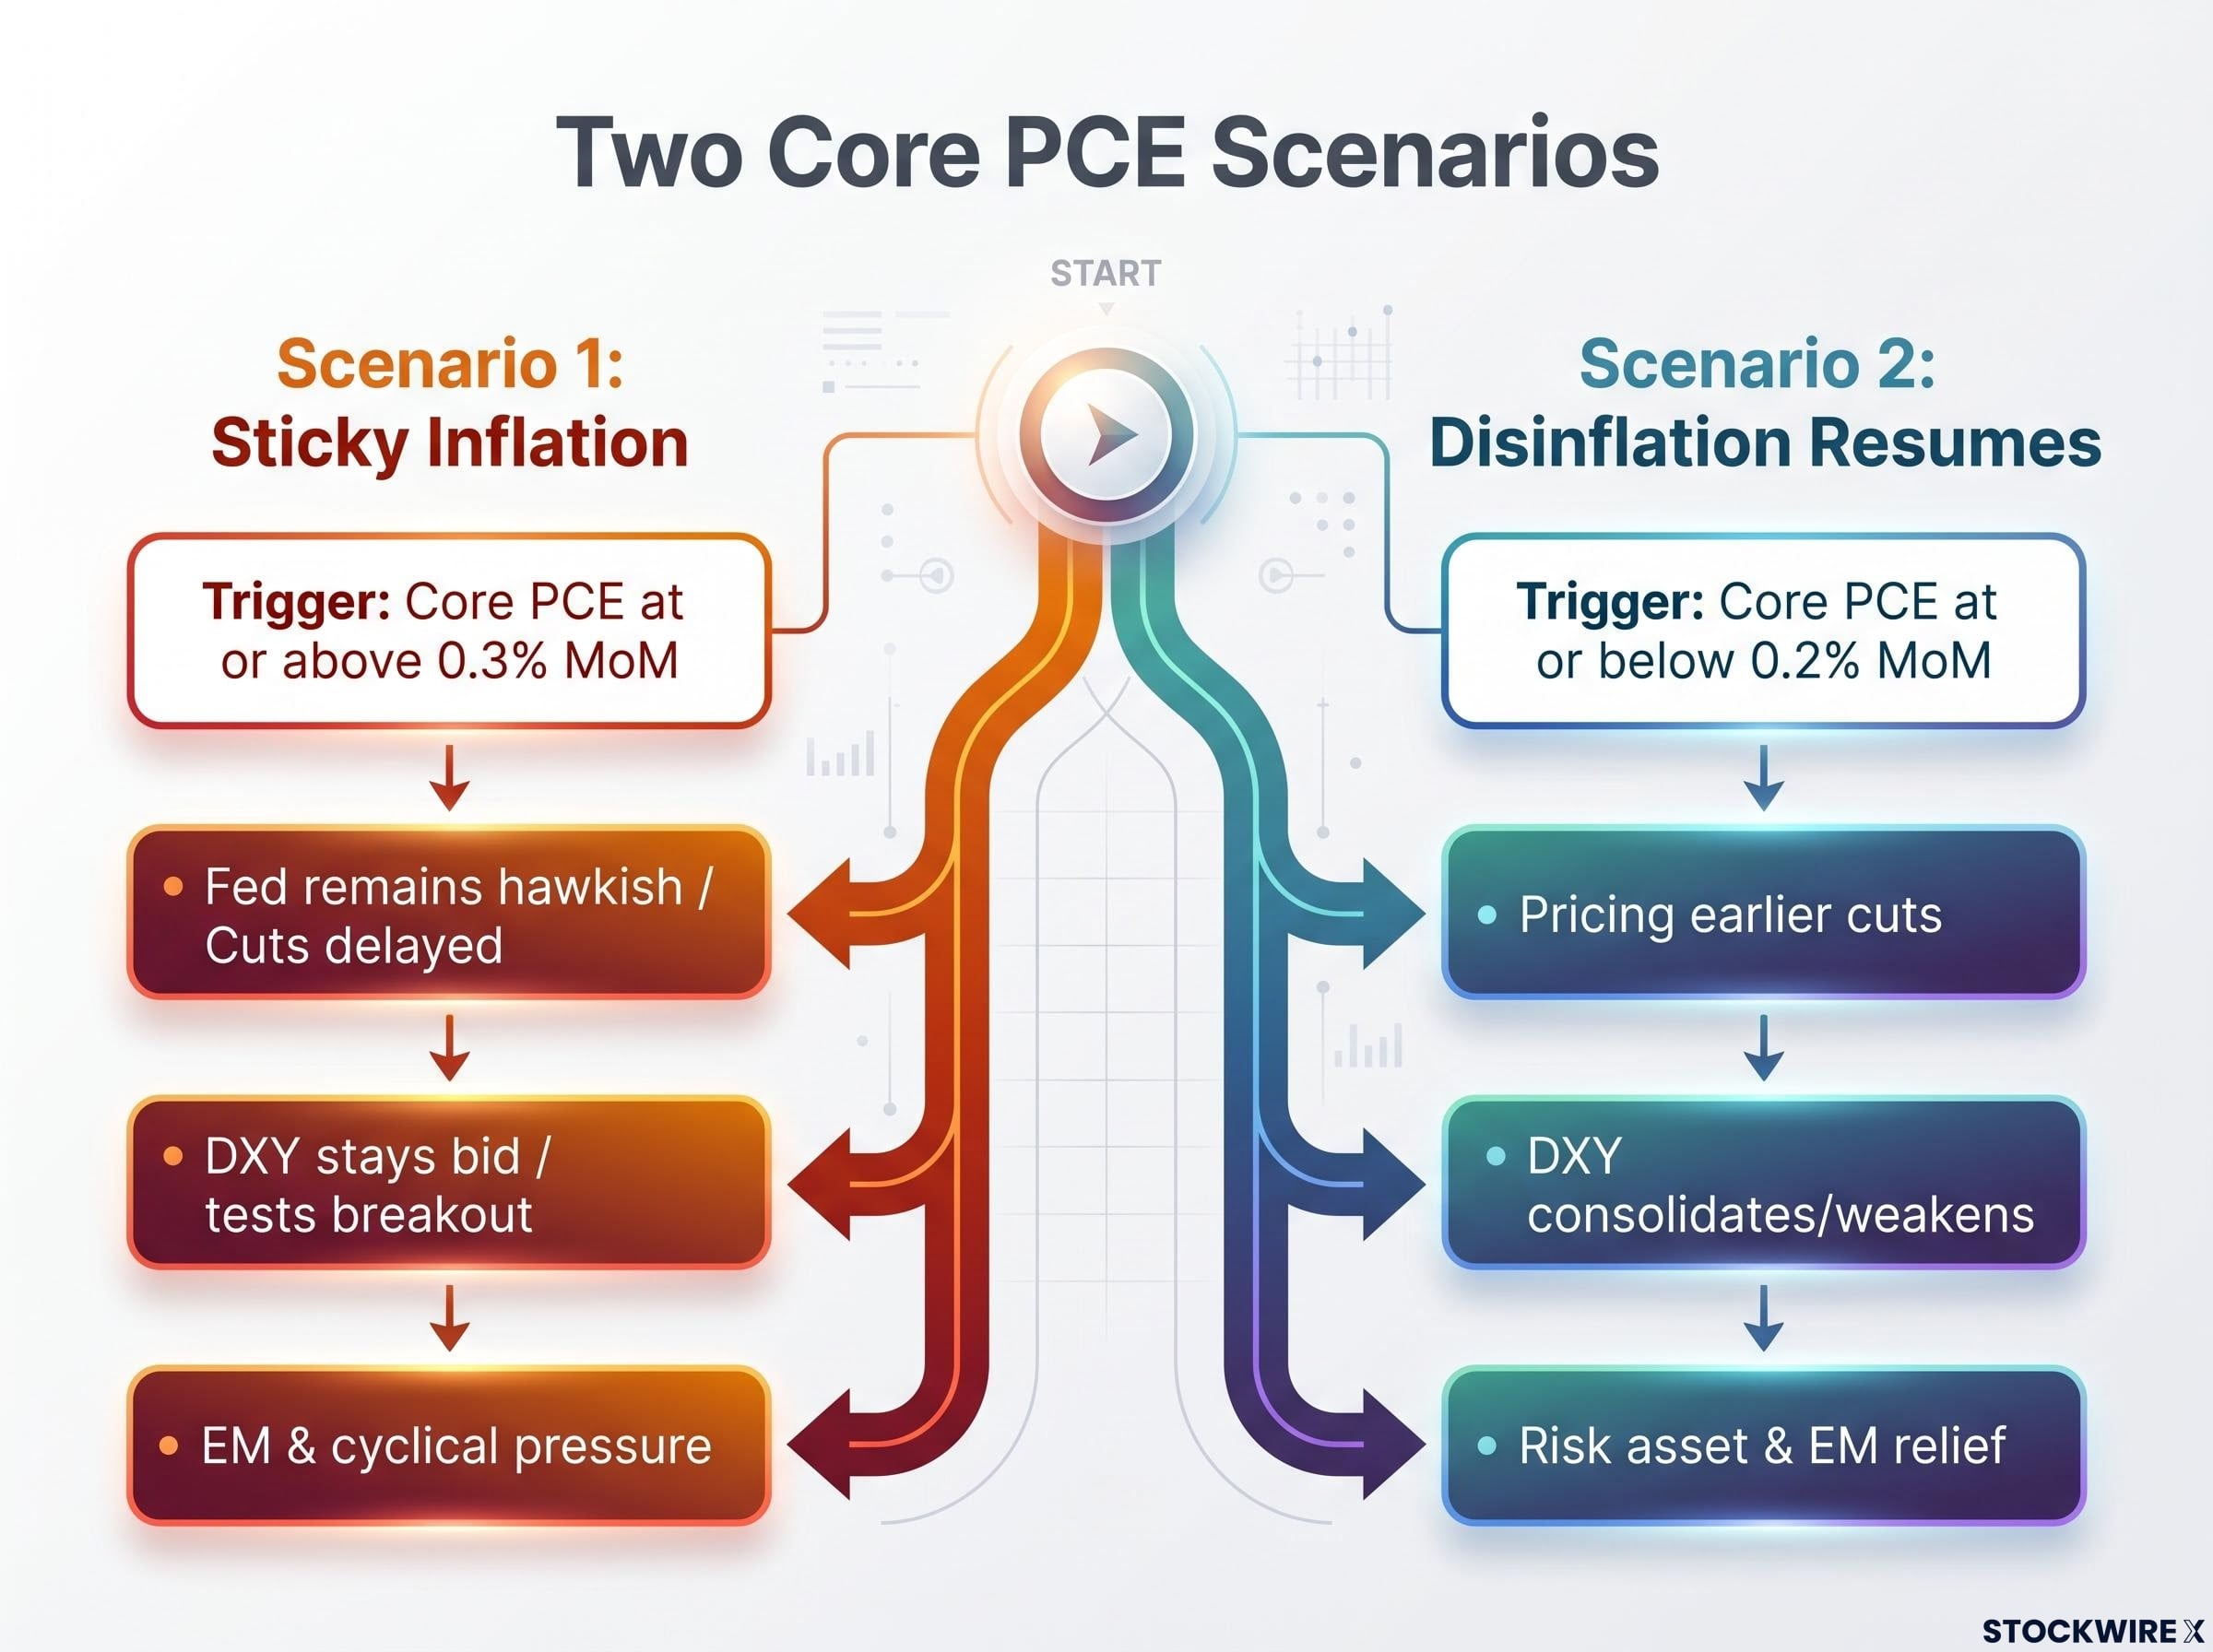
The next two monthly PCE prints function, in effect, as the Fed’s permission structure. Where core PCE lands determines which of two paths plays out, and your current positioning looks meaningfully different depending on which one materialises.
| Scenario | Core PCE Trigger | Asset Class Implications |
|---|---|---|
| Scenario 1: Sticky inflation | Stays at or above 0.3% MoM | Fed remains hawkish; rate cuts pushed further out; DXY stays bid or tests upper trendline breakout; EM and cyclical assets under sustained pressure |
| Scenario 2: Disinflation resumes | Falls back toward 0.2% MoM or lower | Markets begin pricing earlier cuts; forward guidance softens; DXY consolidates or weakens; risk assets gain support; EM relief likely |
The near-term catalysts that will determine which scenario plays out are the upcoming PCE releases, Federal Reserve speeches and communications in the interim period, and payrolls data that could shift the growth side of the Fed’s dual mandate. Medium-term, global growth divergence between the US and other major economies, persistent rate differentials against the European Central Bank (ECB) and Bank of Japan (BoJ), and structural fiscal concerns all shape the backdrop.
Sustained readings at or above 0.3% make a 2026 rate cut politically and technically difficult for the FOMC to justify. If you are positioning for rate relief, that dependency needs to be front of mind.
The chain that has run through this analysis is direct: sticky core PCE confirmed the Fed’s guidance shift, the guidance shift repriced rate-cut timelines, repriced timelines drove dollar strength, and dollar strength is now the primary transmission mechanism for cross-asset pressure across equities, fixed income, EM, and commodities.
The DXY’s position above 100 reflects current consensus positioning on the higher-for-longer thesis. That consensus is only as durable as the next data release. The July PCE print, Fed communications in the interim, and any labour market data that shifts the employment side of the Fed’s dual mandate (the mandate to pursue both price stability and maximum employment, with the current emphasis clearly on the former) are the specific variables to monitor.
The dual mandate conflict sharpened at the April meeting, where PCE running at 3.5% and unemployment rising to 4.3% created precisely the kind of stagflationary tension that the Fed’s rate tools are not designed to resolve cleanly, a dynamic that has made guidance language the primary policy instrument rather than actual rate moves.
The dollar’s strength is data-dependent in both directions. Holding a strong conviction on USD without a view on the next PCE print is positioning without a thesis.
This article is for informational purposes only and should not be considered financial advice. Investors should conduct their own research and consult with financial professionals before making investment decisions. Past performance does not guarantee future results. Financial projections are subject to market conditions and various risk factors.
Core PCE, the Personal Consumption Expenditures price index excluding food and energy, adjusts for consumer substitution behaviour, draws on a broader spending basket, and produces a smoother month-to-month signal than CPI. The Fed's 2% inflation target is anchored to PCE, not CPI, which means investors tracking CPI as their primary policy signal are watching the wrong number.
Two consecutive monthly core PCE readings at 0.3%, combined with a 3.4% year-over-year figure, the highest since October 2023, make a 2026 rate cut technically and politically difficult for the FOMC to justify. Rate-cut expectations have compressed further, and the next monthly PCE prints will determine whether cuts move back onto the table or get pushed out entirely.
The DXY closing at approximately 101.37 places it above both the 50-day SMA at roughly 98.90 and the 200-day MA at roughly 99.30, confirming a medium-term trend shift toward dollar strength. Sustained DXY strength above 100 creates a direct return drag for investors holding international equities, emerging market bonds, or commodity exposure.
A guidance shift reprices the expected timing of future rate cuts rather than moving the overnight rate itself, which means the market impact flows through currency positioning and duration rather than triggering immediate broad volatility. In practical terms, the next PCE data release now carries more market-moving weight than the next FOMC meeting date.
If core PCE stays at or above 0.3% month-over-month, the Fed remains hawkish, rate cuts are pushed further out, and the DXY stays bid or tests an upper trendline breakout, keeping pressure on EM and cyclical assets. If core PCE falls back toward 0.2% or lower, markets begin pricing earlier cuts, forward guidance softens, and the DXY consolidates or weakens, providing relief for risk assets.