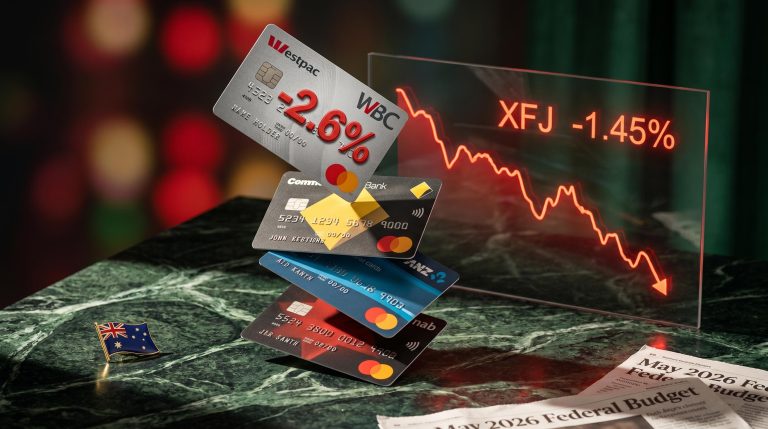
ASX Bank Stocks Sink up to 2.6% on Budget Property Tax Fears
9 hrs ago

U.S. inflation hit 4.2% in May 2026, its highest annual reading in three years, and the cause is not a hot economy. It is a war. The Bureau of Labor Statistics (BLS) released the May 2026 Consumer Price Index (CPI) summary on 10 June 2026, confirming a third consecutive monthly acceleration in the headline inflation rate. Beneath that number, however, the report tells a more specific story. Core inflation, which strips out food and energy, held at 2.9%, barely changed from the prior month. The gap between those two figures points directly at the source of the price pressure: energy costs driven by the ongoing conflict with Iran. What follows is a breakdown of what the latest CPI numbers confirm, what is driving headline inflation higher, why core inflation paints a different picture, and what all of it means for household budgets, borrowing costs, and the Federal Reserve’s next move.
The BLS Consumer Price Index Summary (USDL-26-0824) confirmed headline CPI at +4.2% year-over-year for May 2026, up from +3.8% in April. On a month-over-month basis, headline CPI rose 0.5%, a slight easing from April’s 0.6% monthly gain.
The BLS Consumer Price Index Summary (USDL-26-0824) confirmed headline CPI at +4.2% year-over-year for May 2026, up from +3.8% in April.
“The 4.2% annual headline rate is the highest since April 2023, when CPI peaked at 4.9%.”
Those two figures, the annual and the monthly, moved in opposite directions. The annual rate climbed. The monthly rate eased. That alone signals something more complex than a simple acceleration story.
The April CPI acceleration that pushed headline inflation to 3.8% followed the same pattern: energy costs tied to the Strait of Hormuz doing the heavy lifting while core CPI remained comparatively contained, and equity markets largely shrugged off the headline number because M4 money supply growth of only 5.8% year-over-year signalled limited conditions for the spike to broaden.
Core CPI complicates the picture further. The measure rose 2.9% year-over-year, up only marginally from 2.8% in April. On a monthly basis, core CPI came in at +0.2%, down from +0.4% in April and below the 0.3% consensus estimate compiled by FactSet. The divergence between headline and core, a 1.3 percentage-point gap, is where the real diagnosis begins.
| Metric | May 2026 | April 2026 |
|---|---|---|
| Headline CPI YoY | +4.2% | +3.8% |
| Headline CPI MoM (SA) | +0.5% | +0.6% |
| Core CPI YoY | +2.9% | +2.8% |
| Core CPI MoM (SA) | +0.2% | +0.4% |
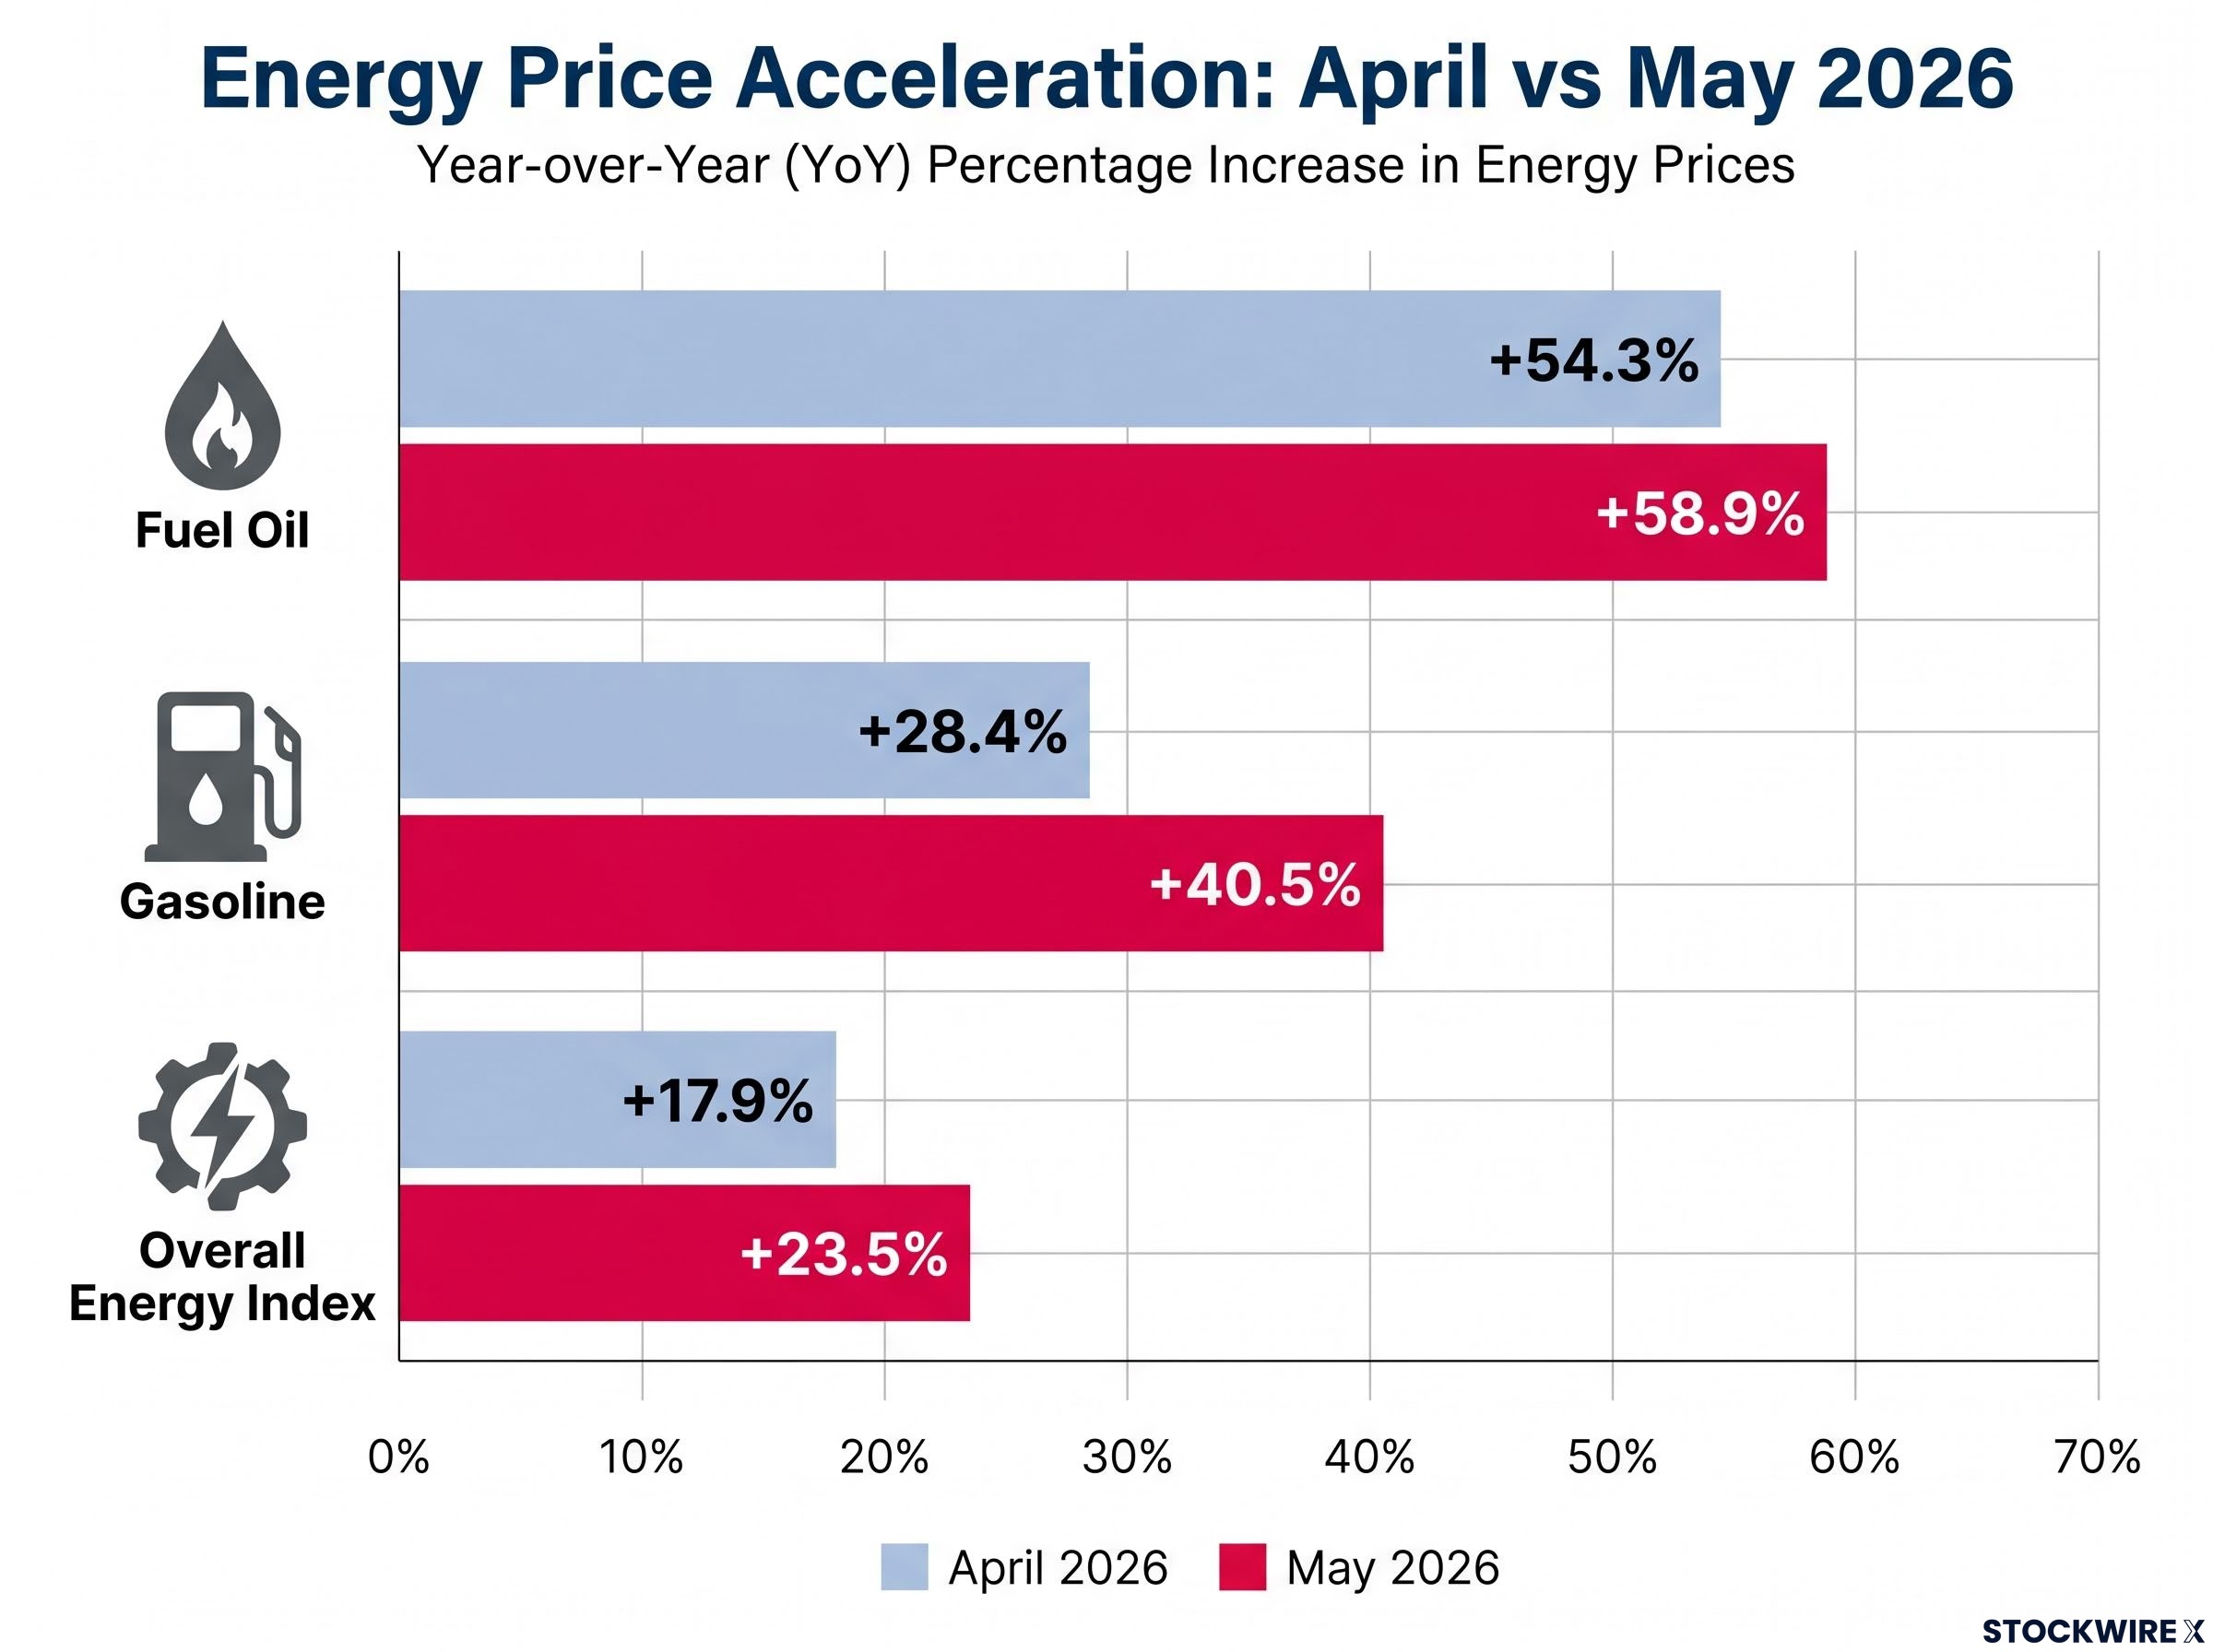
The energy index rose 23.5% year-over-year in May, up from 17.9% in April. Energy accounted for more than 60% of the monthly headline CPI gain, up from more than 40% the prior month.
Gasoline is the dominant component within that:
The acceleration from +28.4% to +40.5% year-over-year represents the sharpest single-month jump in the gasoline component. Fuel oil, which affects heating costs and diesel-dependent industries, pushed even higher.
The mechanism behind these figures is a supply-side disruption with a specific geographic source. The conflict with Iran, underway for approximately four months as of 10 June 2026, has restricted access to the Strait of Hormuz, a chokepoint through which a significant share of global crude oil shipments pass.
According to Investing.com’s reporting by Scott Kanowsky on 10 June 2026, the Strait of Hormuz was “largely inaccessible to oil tanker vessels” as of the publication date. Trading Economics and CBS News corroborate the broader oil supply disruption narrative, with Trading Economics explicitly attributing the energy price surge to the “war with Iran.” Diplomatic efforts had produced only a fragile ceasefire, leaving the supply disruption unresolved.
The global oil supply crisis extends well beyond standard market disruption thresholds: Saudi Arabia’s crude output collapsed to its lowest level since 1990, global inventories were drawing at more than double the previous record pace in Q2 2026, and emergency SPR and IEA releases totalling approximately 280 million barrels failed to halt the drawdown, leaving the Hormuz reopening timeline as the only variable capable of restoring balance.
A 4.2% headline reading sounds like the whole economy is overheating. Core CPI at 2.9% says otherwise.
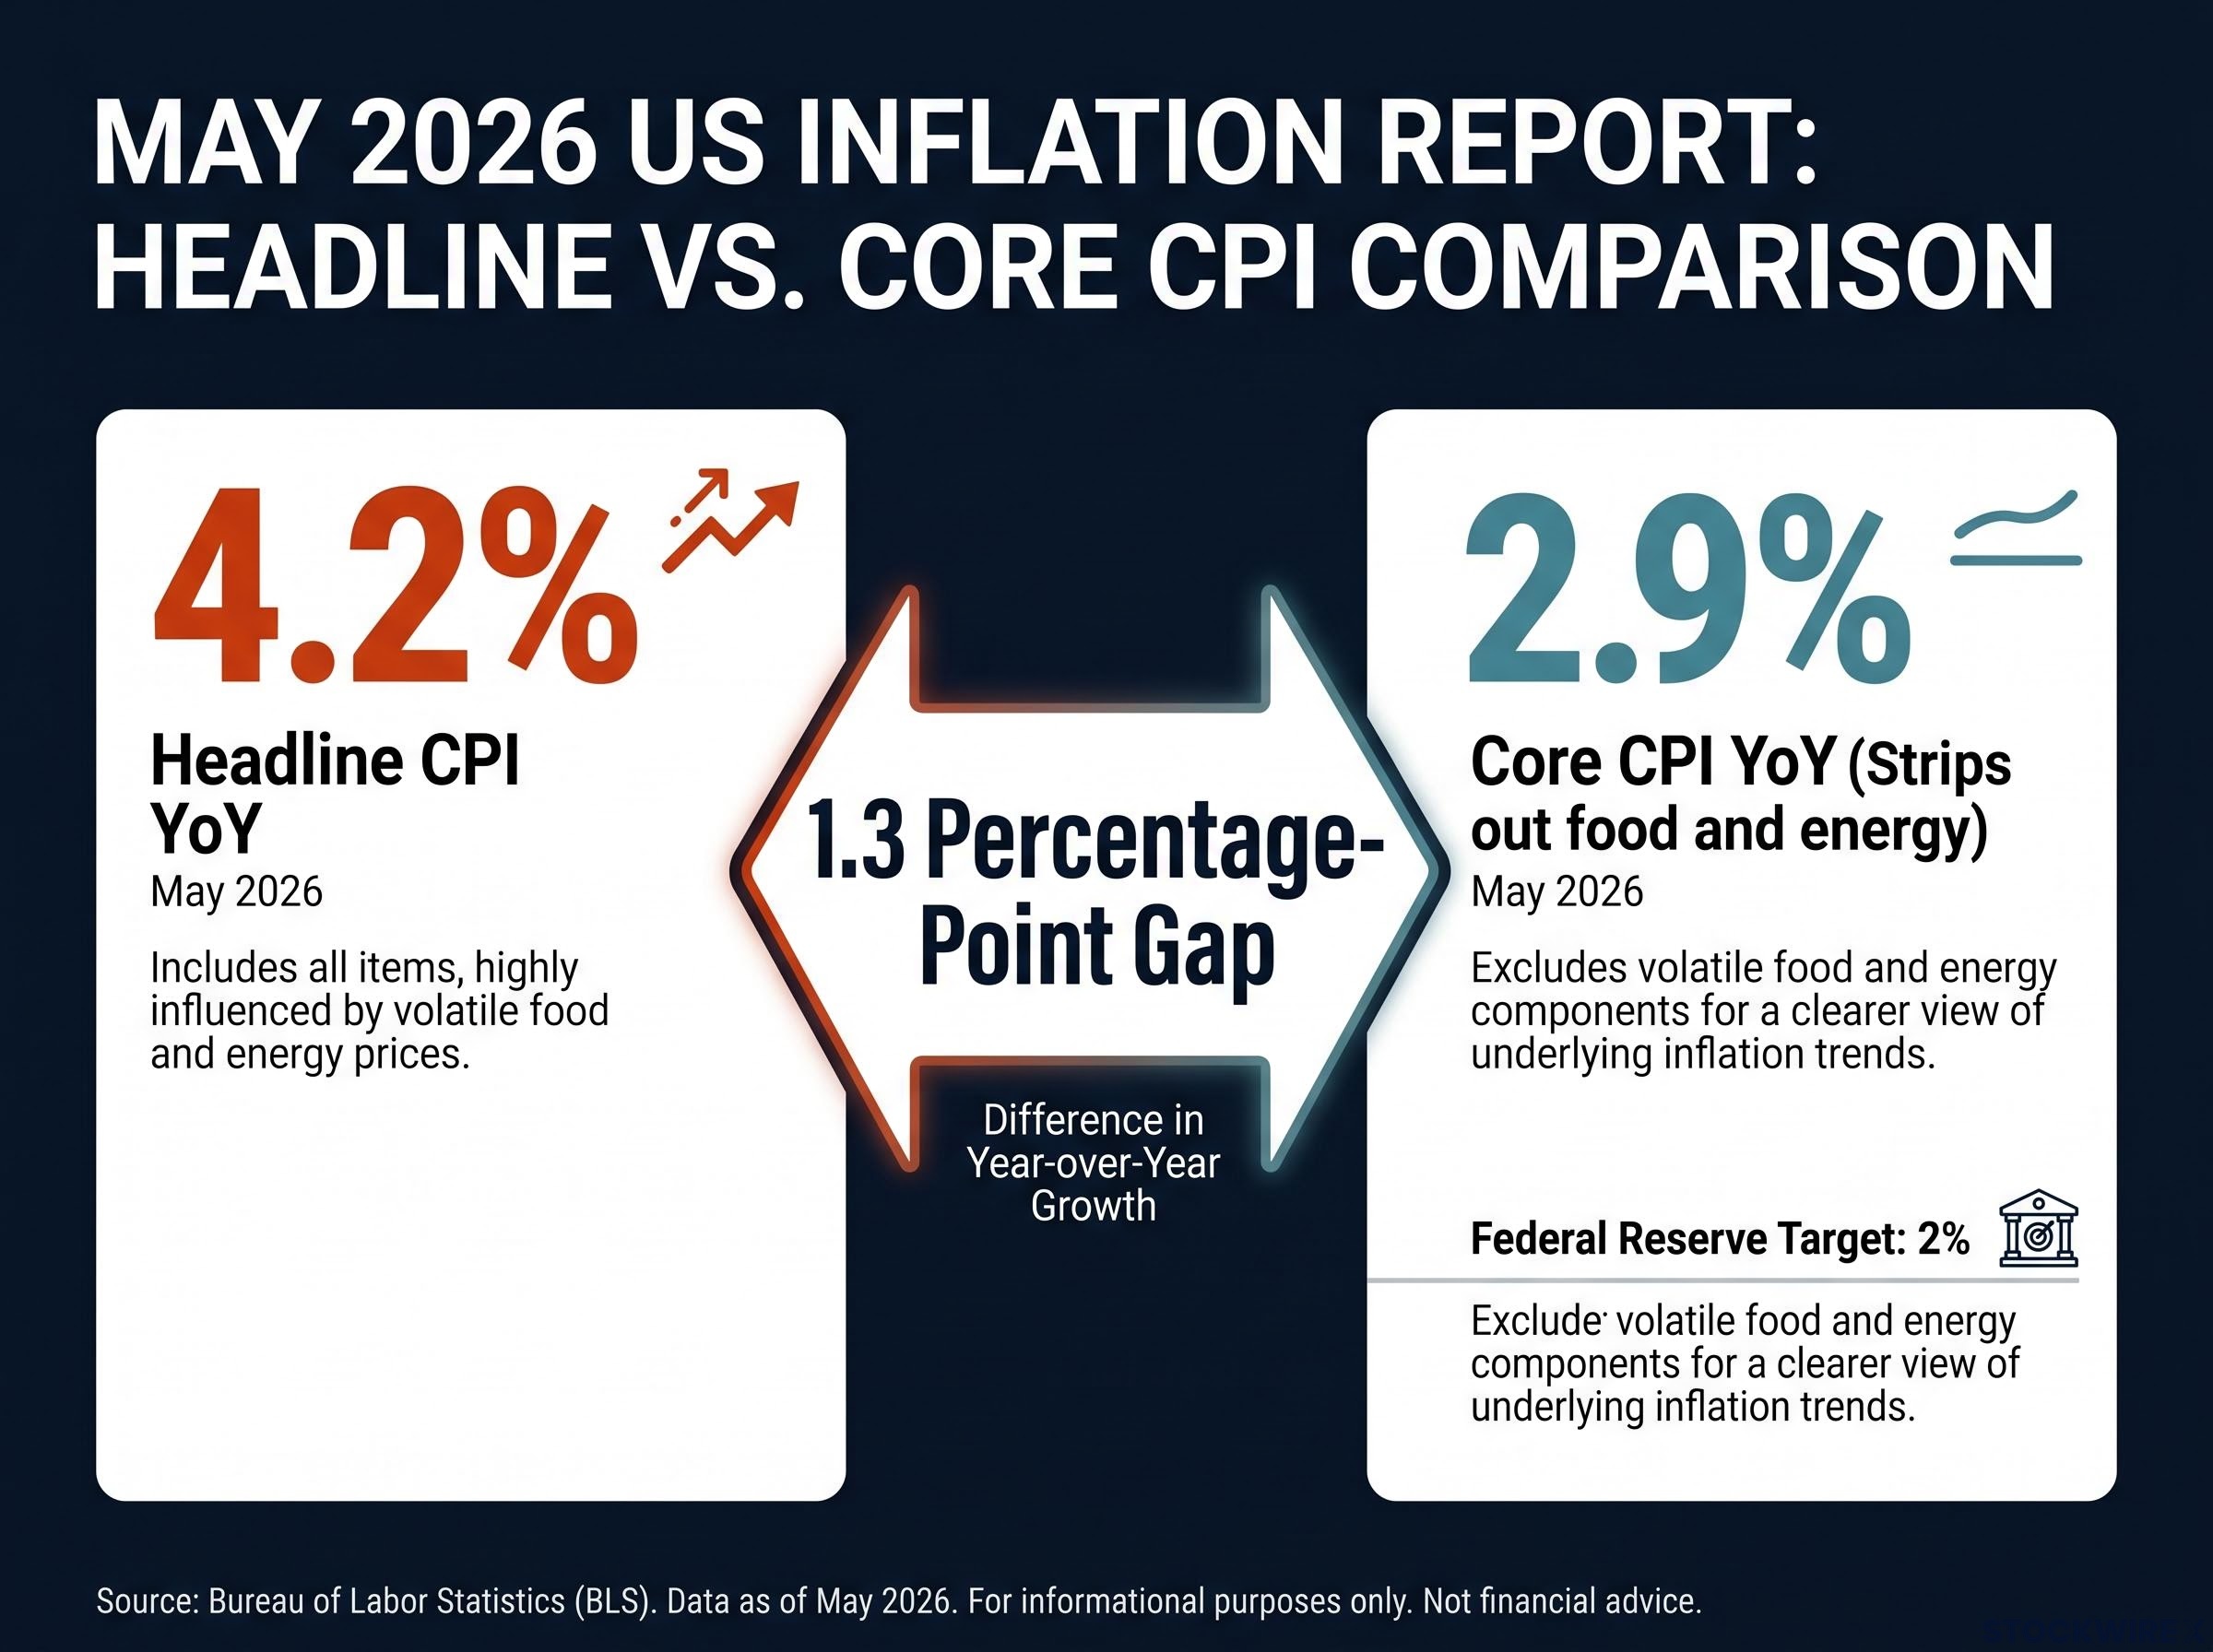
Headline CPI reflects the full basket of goods and services consumers actually purchase, including food and energy. Core CPI strips those two categories out because they are volatile and frequently driven by supply shocks that originate outside the domestic economy, making them poor indicators of underlying demand-driven price pressures.
The 1.3 percentage-point gap between headline CPI at 4.2% and core CPI at 2.9% reflects an energy-driven supply disruption, not economy-wide overheating.
That gap is the diagnostic signal in this report. Core CPI’s monthly reading of 0.2% came in below the 0.3% consensus estimate and decelerated from April’s 0.4%, reinforcing that underlying domestic price pressures are relatively contained. At 2.9% annually, core CPI remains above the Federal Reserve’s 2% target, but it is not accelerating. The inflation problem captured in the May report is concentrated in energy, which means it is concentrated in a geopolitical event, not in broad consumer demand.
May’s CPI report illustrates a dynamic that catches many readers off guard: the annual rate went up while the monthly rate went down. Both figures came from the same BLS release. Both are accurate. They measure different things.
In May 2026, the annual rate climbed from 3.8% to 4.2% because May 2025’s reading was comparatively low, pulling the rolling average higher. At the same time, the monthly rate eased from 0.6% to 0.5%, indicating that the pace of new price increases actually slowed slightly between April and May.
Readers tracking inflation over time benefit from watching both. The annual figure shows cumulative pressure. The monthly figure shows direction.
Gasoline up 40.5% year-over-year translates directly to what consumers pay at the pump. For households that commute by car or rely on fuel-dependent services, this is the most immediate and visible price increase in the May report.
The impact extends beyond the pump. Diesel and transportation costs feed into the prices of food, consumer goods, and services that rely on trucking and logistics. These second-order effects move with a lag, meaning the energy shock already embedded in May’s data is likely to broaden into food and goods prices in the months ahead.
The three primary channels of household impact:
“Three-quarters of Americans say their incomes are not keeping pace with inflation.”
That polling finding, reported by CBS News, grounds the macroeconomic data in lived experience. For a significant majority of households, the 4.2% headline figure is not an abstraction. It is a budget constraint.
The May CPI report presents the Federal Reserve with a specific kind of policy challenge. The Fed’s standard tool, adjusting the federal funds rate, is designed to cool demand-driven inflation by making borrowing more expensive. A supply-shock inflation episode driven by a geopolitical conflict abroad responds differently to that tool.
Core CPI at 2.9% gives the Fed some room. It is above the 2% target but not accelerating, and the monthly reading came in below consensus. That data supports a case for holding rates steady rather than tightening aggressively. Headline CPI at 4.2%, however, creates political and market pressure. A three-year high in the inflation rate is difficult for any central bank to ignore publicly, even when the underlying data suggests the price pressure is concentrated in a single supply-disrupted commodity.
FOMC internal divisions deepened through April 2026, with four members dissenting at the 28-29 April meeting, the most at any single Federal Reserve meeting since 1992, as PCE inflation at 3.5% and rising unemployment to 4.3% created a genuine dual-mandate conflict that the standard rate toolkit is not designed to resolve simultaneously.
If the Fed responds to sustained elevated headline inflation with further rate increases, the cost falls most directly on holders of variable-rate debt. Credit card balances, adjustable-rate mortgages (ARMs), and home equity lines of credit (HELOCs) are the primary channels through which higher policy rates reach household budgets.
Cash holdings and low-yield savings vehicles face their own pressure. When savings yields fall below the 4.2% headline inflation rate, those holdings lose real purchasing power. This creates a dual squeeze: borrowing costs may rise while savings erode in real terms.
The May 2026 CPI report documents a supply-shock inflation episode with an identifiable external cause. Headline inflation is at a three-year high, but core inflation, the measure that best captures underlying domestic demand pressures, is relatively contained and decelerating on a monthly basis. The gap between the two readings points squarely at energy costs driven by the Iran conflict and the disruption to Strait of Hormuz shipping lanes.
The trajectory of headline inflation from here depends on developments that no single domestic policy lever can control: whether the ceasefire holds, whether tanker access is restored, and how quickly global oil supply normalises. For households monitoring the data, the monthly CPI figure is the signal to watch for signs of deceleration. Core CPI is the signal to watch for evidence of broader price pressures spreading beyond energy. Variable-rate debt exposure warrants reassessment in an environment where the Fed faces pressure to act on a headline number it may prefer to look through.
For readers wanting to quantify the full scope of household budget pressure beyond energy, our comprehensive walkthrough of 2026 tariff costs breaks down the $1,830 to $2,600 in projected annual added costs per household across vehicles, electronics, and pharmaceuticals, with five actionable steps to reduce individual exposure before Q3 2026 price increases land.
This article is for informational purposes only and should not be considered financial advice. Investors should conduct their own research and consult with financial professionals before making investment decisions.
The US inflation rate reached 4.2% year-over-year in May 2026, the highest annual reading since April 2023, according to the Bureau of Labor Statistics CPI summary released on 10 June 2026.
The 2026 inflation spike is primarily a supply-side shock driven by the conflict with Iran, which has restricted access to the Strait of Hormuz and caused gasoline prices to surge 40.5% year-over-year, not by broad consumer demand or an overheating domestic economy.
Headline CPI measures the full basket of consumer goods and services including food and energy, while core CPI strips out those two volatile categories to better reflect underlying domestic demand-driven price pressures.
Core CPI at 2.9% gives the Fed some room to hold rates steady, but headline CPI at 4.2% creates political and market pressure to act, creating a difficult policy challenge since standard rate tools are designed to cool demand-driven inflation, not supply-shock inflation from a geopolitical conflict.
Gasoline prices up 40.5% year-over-year hit commuters directly at the pump, while elevated diesel and transportation costs are expected to pass through to food and consumer goods prices in the coming months, and three-quarters of Americans report their incomes are not keeping pace with inflation.