Why Governance and Communication Drive Post-IPO Value
5 hrs ago

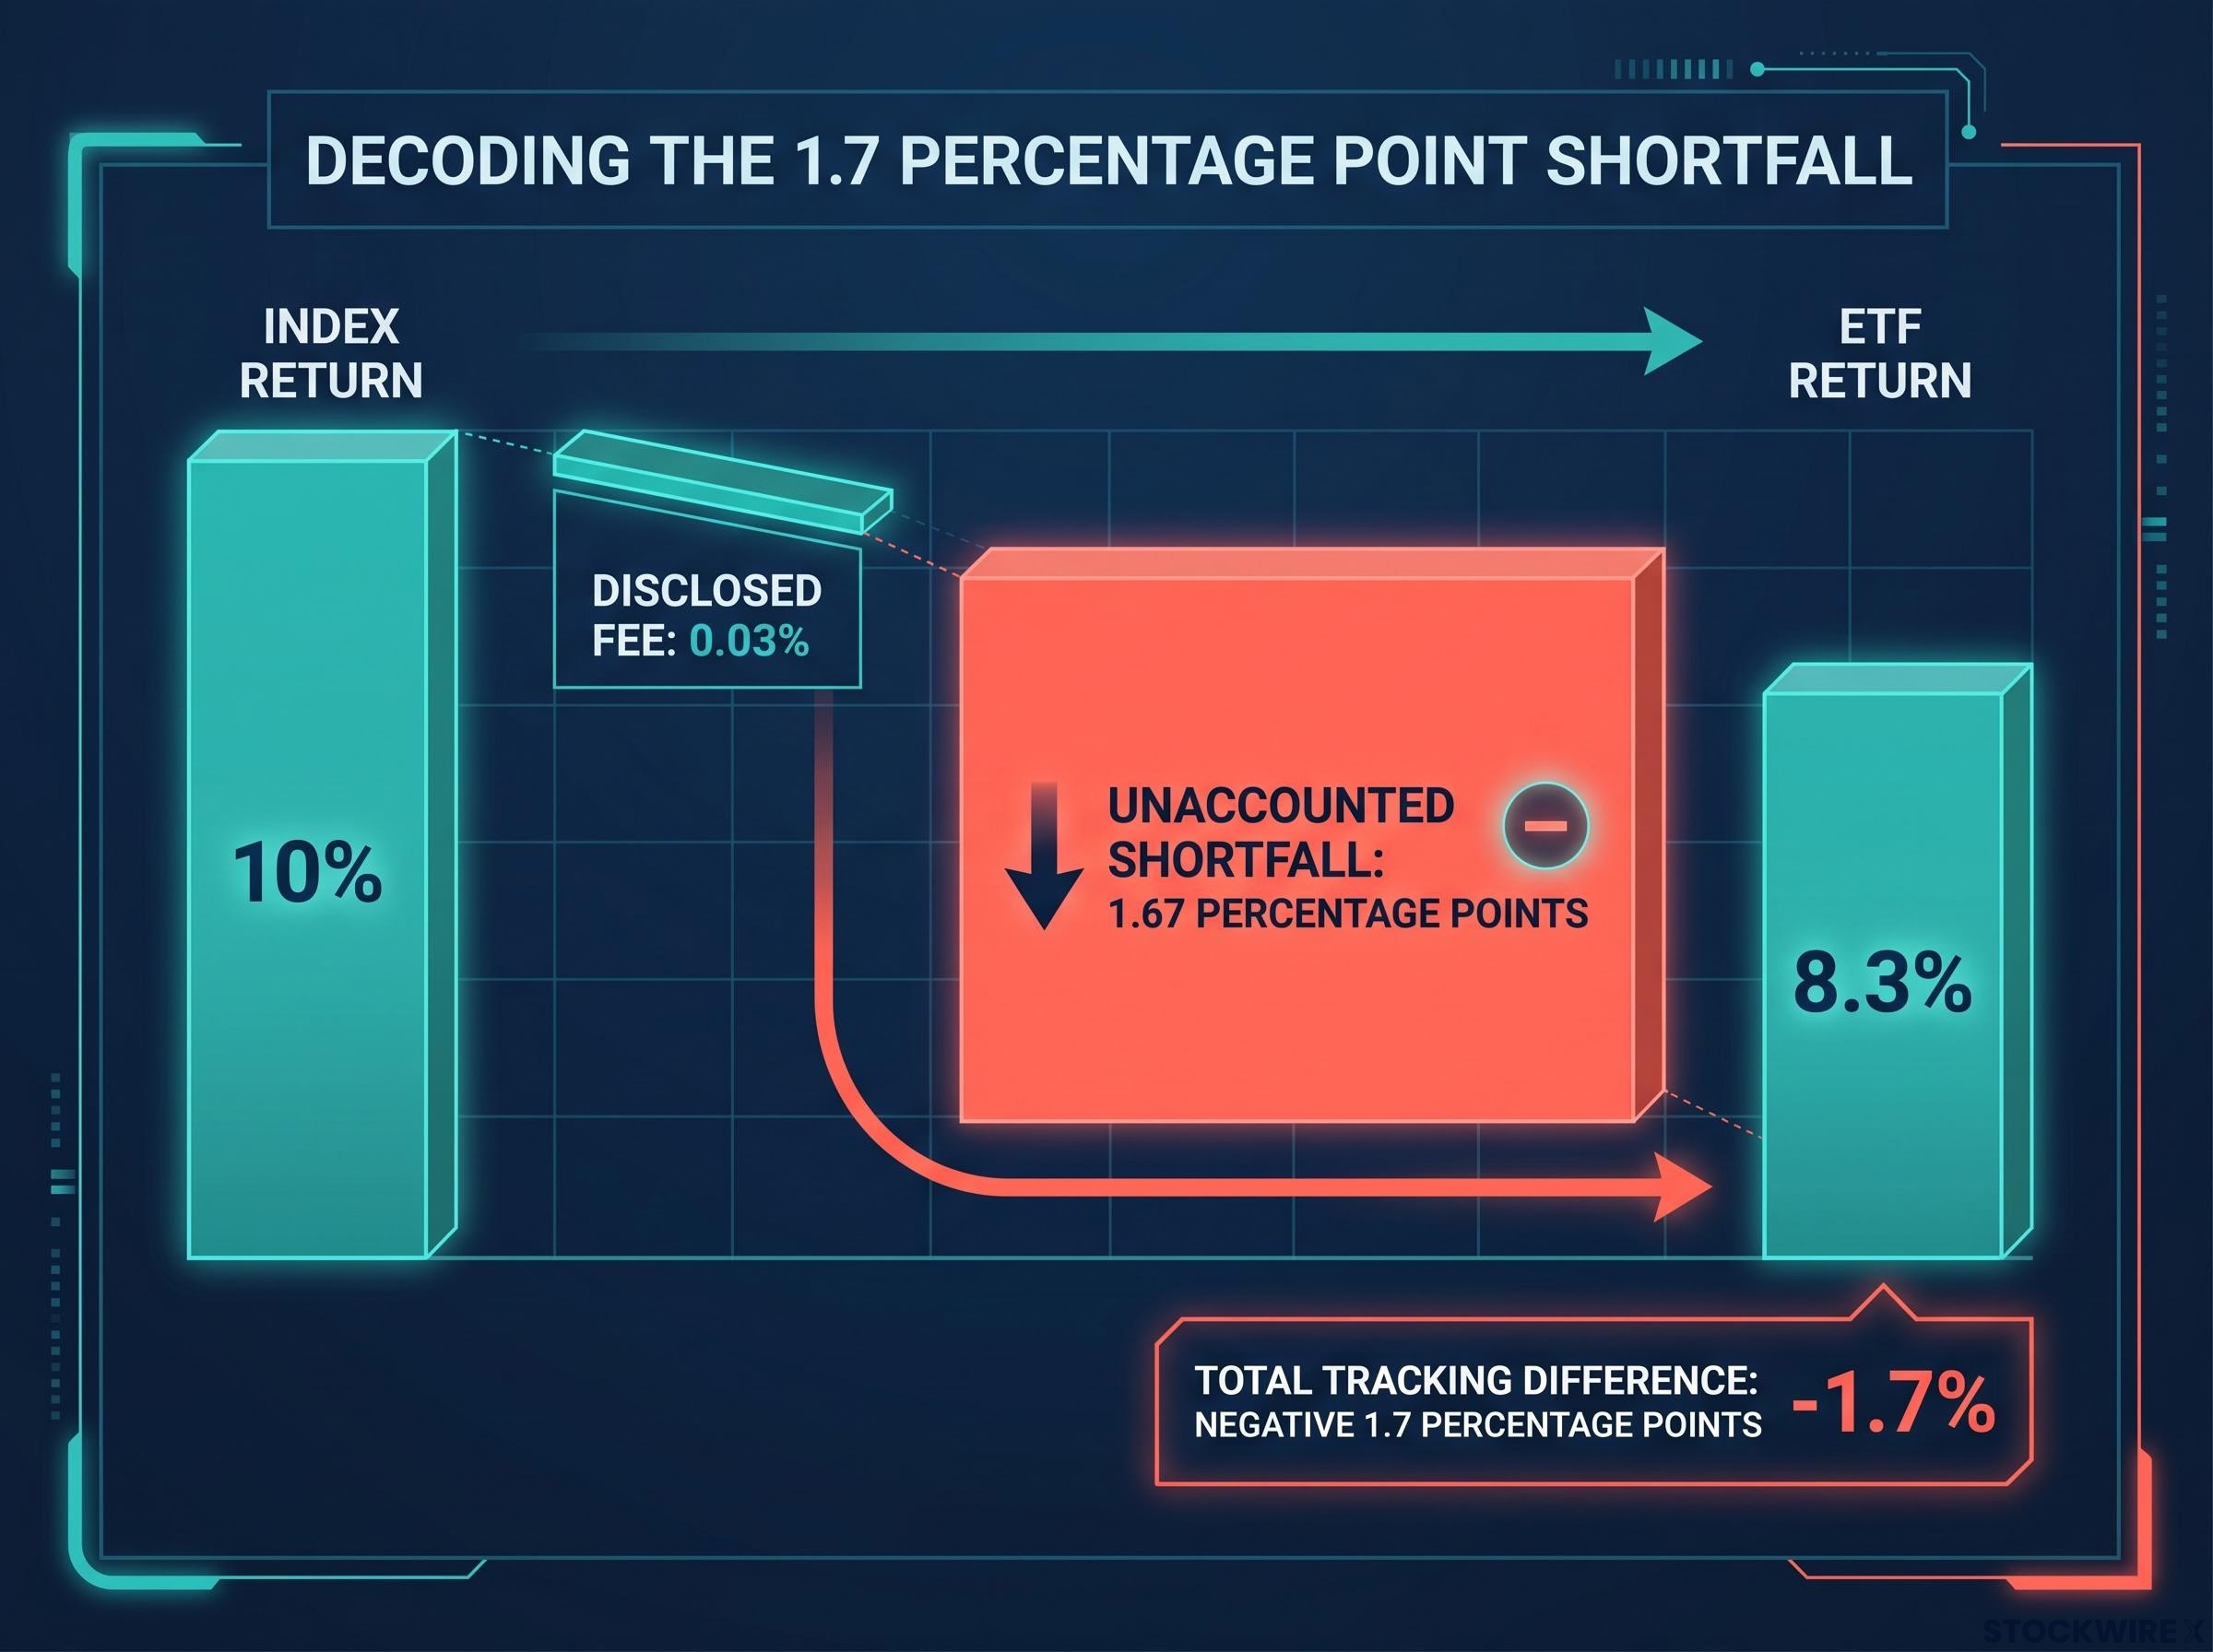
Suppose an S&P 500 ETF delivers 8.3% over a year while the index itself climbs 10%. The fund charges 0.03% in fees. That still leaves 1.67 percentage points unaccounted for. The fee schedule offers no explanation. No disclosure breaks it down. The shortfall simply exists, quietly compounding against your returns year after year.
Most investors assume the expense ratio captures the full cost of owning an ETF. That assumption is structurally wrong. The gap between a benchmark’s return and the fund that tracks it has multiple distinct causes, nearly all of them operational rather than fee-based, and none of them appear on a fee schedule. What follows gives you a clear framework for diagnosing which forces are actually driving your fund’s shortfall, so the next time you compare two ETFs tracking the same index, you evaluate what they cost you in practice, not just what they charge you on paper.
The expense ratio is the number you see on every fund fact sheet. It is explicit, disclosed, and easy to compare. But it measures only the management fee deducted from the fund’s assets. It does not capture the full economic cost of owning the ETF.
Tracking difference does. Tracking difference is the total return shortfall between the ETF and its benchmark over a given period, incorporating every friction the fund encounters: transaction costs, timing delays, cash holdings, and operational drag that no disclosure document itemises. When you see a fund trail its benchmark by 1.7 percentage points while charging 0.03% in fees, the tracking difference is showing you the 1.67 points the expense ratio cannot explain.
Comparing funds by expense ratio alone is an incomplete due-diligence step. Two funds charging the same fee can deliver meaningfully different returns because one manages its operational frictions more efficiently. The tracking difference is where that difference shows up.
The expense ratio as a return predictor has been studied systematically, with research finding that the fee a fund charges is a more reliable indicator of long-term relative performance than past returns, fund size, or analyst ratings — which makes the gap between the disclosed fee and the actual tracking difference a critical dimension that fee-focused screening frameworks typically omit.
Tracking difference measures the cumulative return gap over a period. Take a fund where the index posted 10% and the ETF delivered 8.3%: the tracking difference is negative 1.7 percentage points.
Tracking error measures the volatility of that gap, how consistently the fund replicates the index from period to period. A fund with a small tracking difference but high tracking error is matching the benchmark on average but doing so erratically. If you need predictable benchmark exposure, that inconsistency matters as much as the cumulative shortfall.
| Metric | What it measures | Where it appears | What it captures | What it misses |
|---|---|---|---|---|
| Expense ratio | Disclosed management fee | Fund fact sheet, prospectus | Explicit fee deducted from assets | All operational frictions: rebalancing costs, cash drag, dividend delays |
| Tracking difference | Cumulative return shortfall vs. benchmark | Calculated from NAV and index returns | Total economic cost including all frictions | Period-to-period volatility of the shortfall |
Index methodologies are published documents. The eligibility criteria and reconstitution schedules that determine which stocks enter or exit an index are openly available, covering factors such as market capitalisation, liquidity, float, and exchange listing. For ordinary investors, that openness is useful. For professional traders, it is an operational advantage: they can position ahead of changes that index funds will be obligated to execute, buying likely additions before the official announcement and selling ahead of removals.
Here is the sequence:
Tesla’s addition to the S&P 500 in late 2020 illustrated this dynamic clearly. During the months preceding the formal announcement, Tesla shares climbed sharply as the broader market priced in the enormous buying pressure that index replication would soon generate. Funds obligated to purchase the stock at inclusion did so at prices that already reflected that anticipated demand.
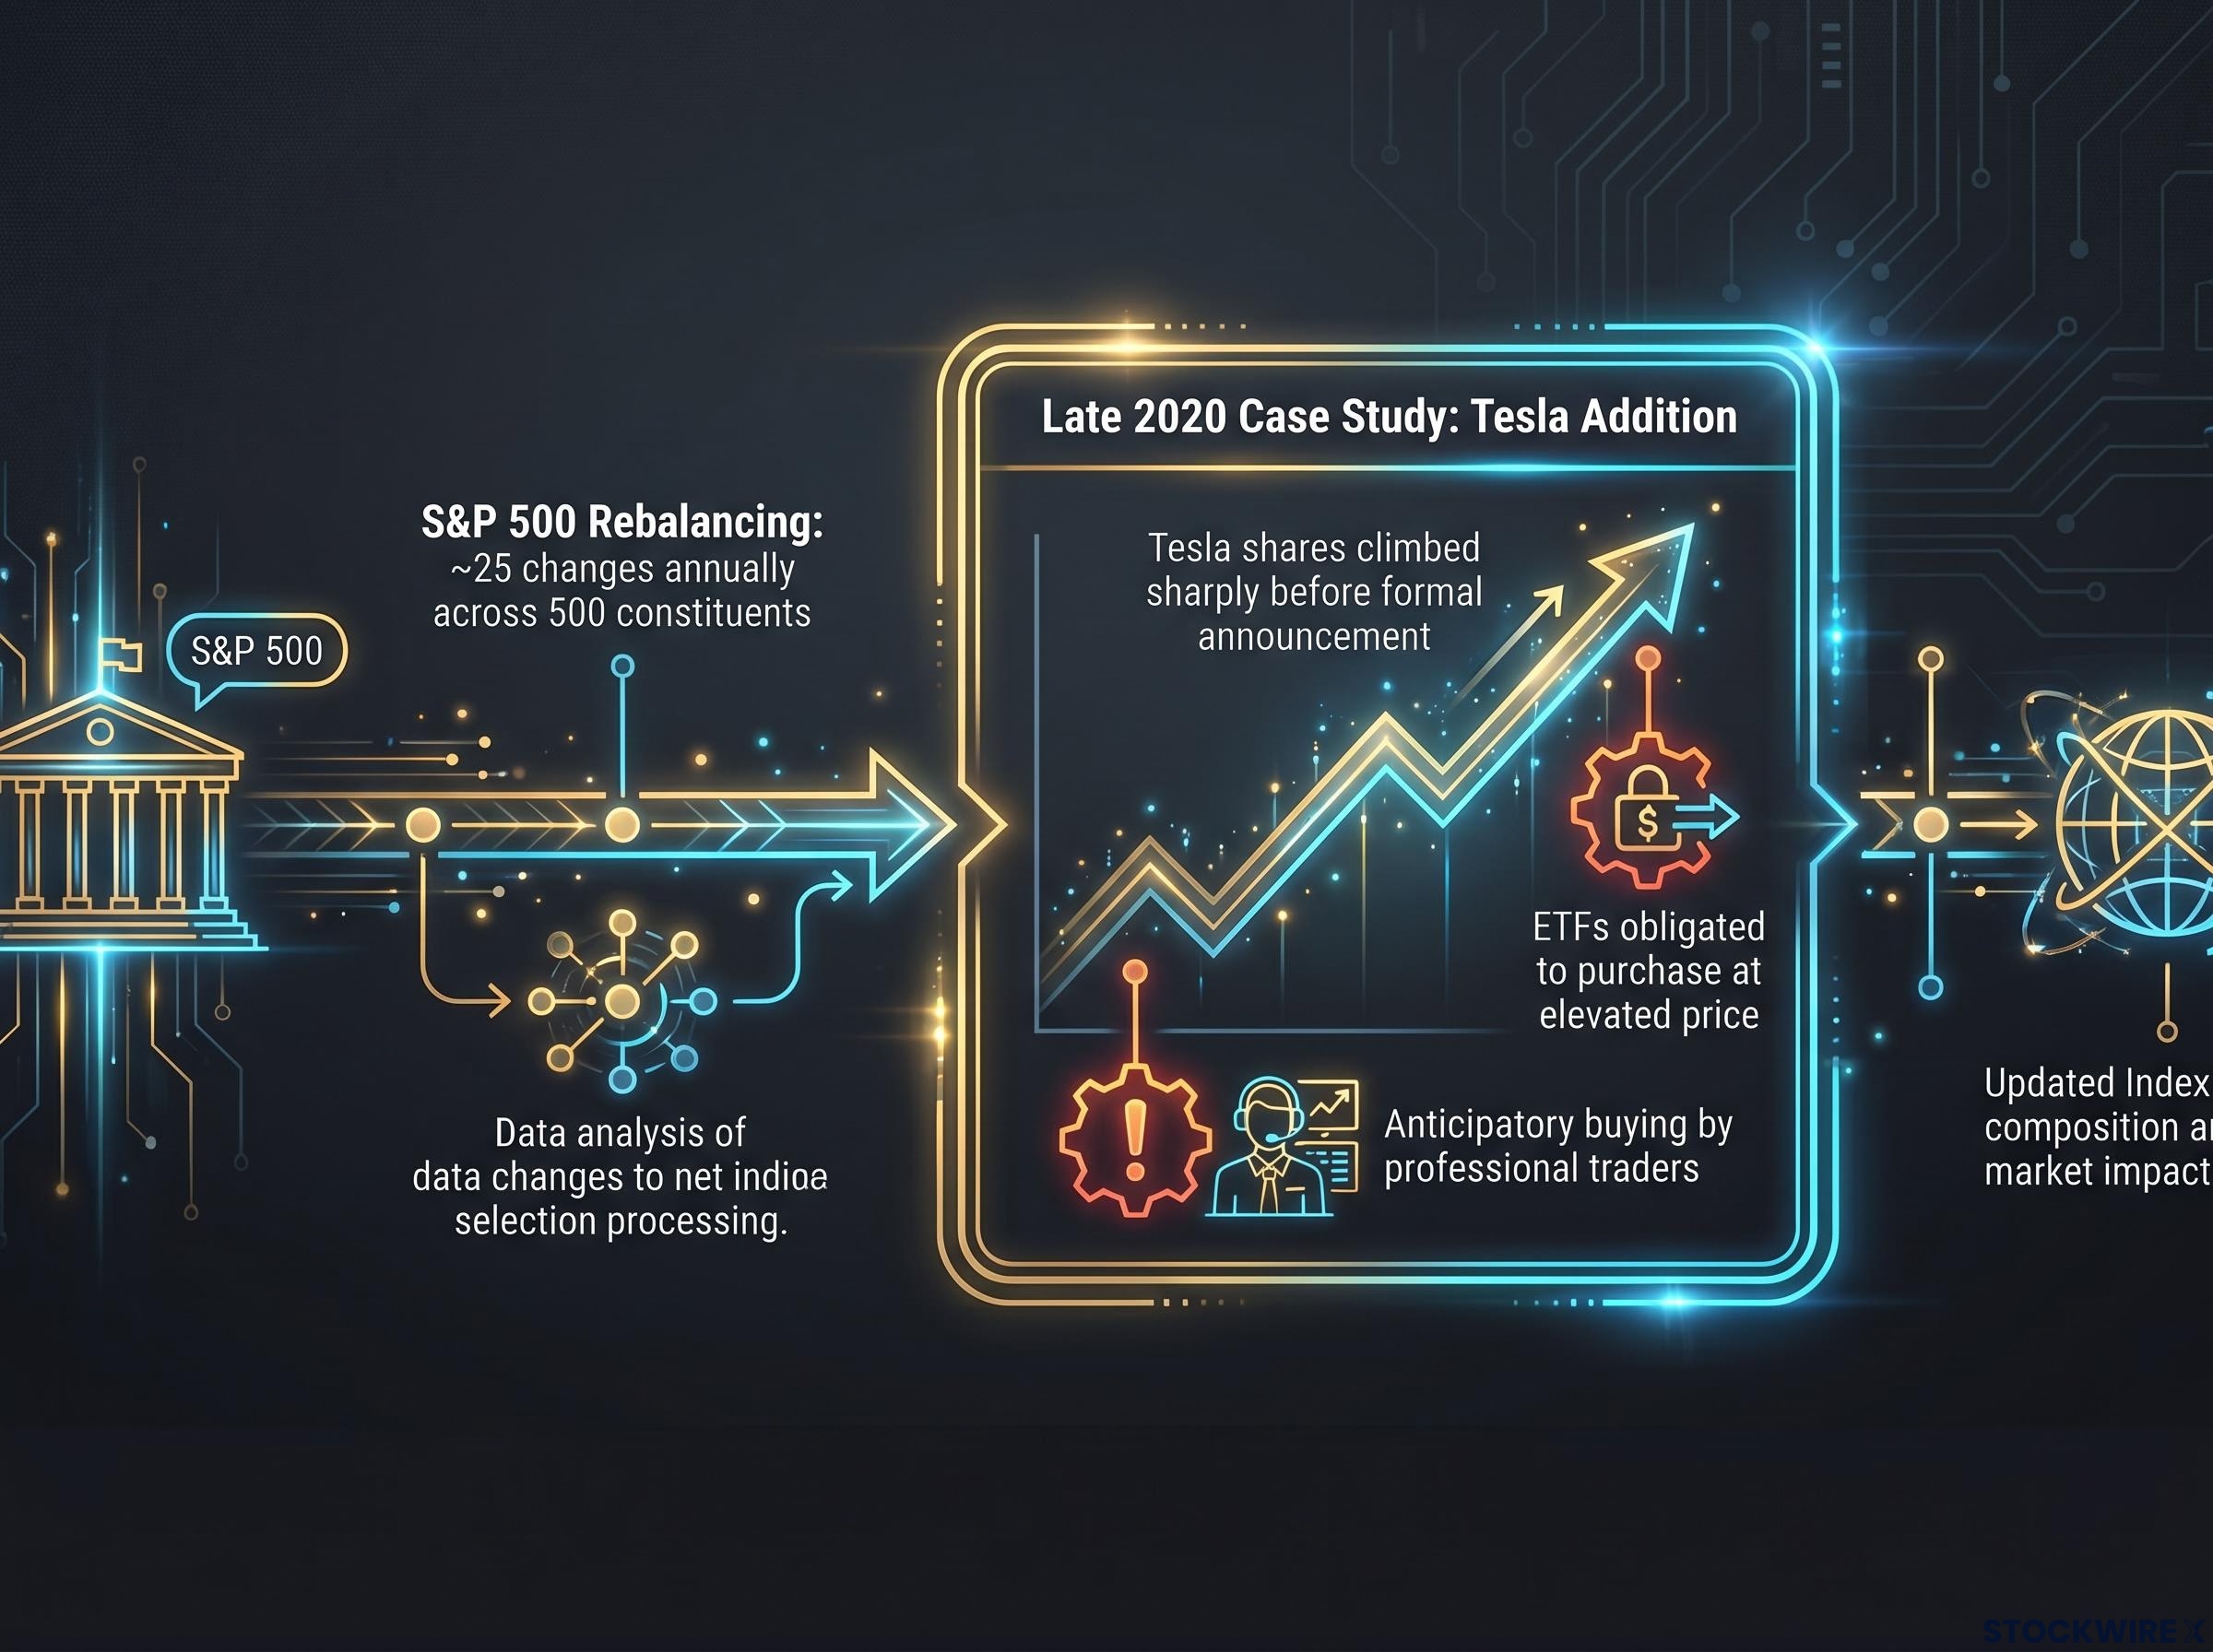
The cost of this mechanism depends on how often the index turns over and how liquid its constituents are. With approximately 25 changes annually across its 500 constituents, the S&P 500 spreads this friction thinly across a highly liquid market. Sector, thematic, and factor ETFs turn over constituents more often in thinner markets, meaning the structural cost of front-running is proportionally larger for those funds. For you, this means the headline expense ratio on a thematic ETF is a floor, not a ceiling, on the structural frictions you will bear relative to the benchmark.
The theoretical index assumes instant, frictionless reinvestment: each dividend payment is put back to work in the portfolio at the end of the business day it arrives, at no cost. The practical reality for an ETF is quite different.
In practice, dividend proceeds sit as cash for days to weeks while the fund processes the payment, allocates across positions, and plans the required trades. During that window, the index model assumes those dollars are fully invested in equities. The fund has them parked in cash, earning a fraction of what the market delivers.
When share prices are rising, this timing gap works against the fund: the index assumes those reinvested pounds are participating in the rally while the ETF is holding cash on the sidelines. When markets are falling, the delay can actually help, since cash reinvested at lower prices improves the outcome. Over long periods, however, the tendency of equity markets to rise more than they fall means the adverse effect of the delay outweighs the occasional benefit.
Each individual delay is small. But dividends arrive from many holdings throughout the year, creating overlapping periods of idle cash. The compounding effect is persistent and shows up directly in the tracking difference, even though no disclosure document itemises it.
The same asymmetry that creates dividend reinvestment mechanics problems at the fund level also operates at the investor level: when a share price falls by approximately the full dividend amount on the ex-dividend date, no net wealth is created at the moment of distribution, and any delay in putting that cash back to work compounds the gap between what the index assumes and what you actually receive.
Beyond the fund-level processing delay, there is a further lag for investors who receive cash distributions and must reinvest them personally. Whether you use a broker’s automatic reinvestment service or place trades yourself, the time between receiving the cash and putting it back into the market can stretch the total reinvestment gap to several weeks.
For cross-border investors, a separate and permanent cost applies on top of timing delays. Withholding tax on dividends paid by US-listed ETFs can run anywhere from 0% to 30%, depending on the relevant tax treaty. Unlike a reinvestment delay, this is not a gap that closes over time. The deduction is permanent, the benchmark ignores it entirely, and the shortfall it creates widens your gap versus the index on a lasting, compounding basis.
The distinction matters. Timing gaps from reinvestment delays average out over very long periods; they are recoverable in a statistical sense. Withholding tax is not. It is money that leaves the system entirely, widening your gap versus the theoretical index on a permanent, compounding basis.
Index benchmarks are constructed on the premise that every unit of capital is continuously allocated to the target securities, with nothing held back. An ETF, by contrast, must maintain working cash balances at all times to meet operational obligations, and no amount of efficient management reduces that requirement to zero.
The sources of unavoidable cash include:
Each of these pools earns significantly less than equities over time. In a strong market, that gap widens. In a weak market, it narrows, but the long-term trend in equity markets means the drag runs in one direction more often than the other.
Over years, a persistent underinvestment of even a fraction of a percent compounds into a measurable shortfall. This is not a sign of poor management. It is a permanent structural feature of how ETFs operate, and you should factor it into your return expectations from day one rather than treating any tracking difference as an anomaly to investigate.
Securities lending is the one element of ETF mechanics that works in your favour rather than against it. When an ETF lends portfolio holdings to short-sellers and other market participants, it receives a fee in return, and that fee flows back into the fund to offset some of the frictions described above. It is the single mechanism within the ETF structure that narrows the tracking gap rather than widening it.
The complication is that fund managers typically retain a portion of that lending revenue. The split between what the manager keeps and what flows through to the fund (and by extension to you) varies by provider. Some pass through 70-85% of gross lending revenue; others retain more. The net offset is not standardised, not always transparently disclosed, and should not be assumed to eliminate other frictions.
Morningstar’s ETF securities lending analysis confirms that lending revenue reaches the fund only after the lending agent extracts its cut, meaning the gross figure cited in fund materials consistently overstates what actually offsets your tracking difference.
For you, this creates a concrete due-diligence point: two ETFs tracking the same index, with identical expense ratios, can produce different tracking differences because one has a more investor-friendly securities lending arrangement. The revenue-sharing policy is a material differentiator.
For US-domiciled ETFs, securities lending information typically appears in the fund prospectus, the annual report, or the Statement of Additional Information (SAI). Look for the percentage of gross lending revenue passed through to the fund versus retained by the manager. That number tells you how much of the partial offset actually reaches your returns.
Once you understand what drives the gap, the practical question is how to use that knowledge when selecting a fund. Here is a four-step evaluation sequence, ranked by priority:
| Fund type | Typical tracking difference range | Key friction driver | Expected tracking error | Primary due-diligence question |
|---|---|---|---|---|
| Broad market (e.g., S&P 500) | Small, stable | Cash drag, dividend timing | Low | Is the tracking difference consistently near the expense ratio? |
| Sector or thematic | Moderate to large, variable | Rebalancing costs, front-running in less liquid names | Moderate to high | How frequently does the index reconstitute, and in what liquidity? |
| Factor (e.g., value, momentum) | Moderate, variable | High turnover, concentrated rebalancing trades | Moderate | What is the annual turnover rate, and how does the fund manage execution? |
An investor who switches their evaluation framework from expense ratio to tracking difference will sometimes find that the cheaper fund by fee is not the cheaper fund by outcome. That is the central practical insight here.
Cross-border investors should also factor applicable withholding tax rates when comparing funds tracking the same index from different domiciles. This is a permanent performance component, not a recoverable timing difference.
For investors wanting to apply these criteria to an actual fund selection decision, our comprehensive walkthrough of ETF due diligence covers eight sequential steps — from verifying actual holdings to assessing total cost of ownership across tracking difference, bid-ask spreads, and brokerage commissions — giving you a structured process for converting tracking difference literacy into a repeatable screening framework.
This article is for informational purposes only and should not be considered financial advice. Investors should conduct their own research and consult with financial professionals before making investment decisions.
The tracking difference number you find in fund data is not a management quality score. It is the accumulated fingerprint of every structural friction operating simultaneously: rebalancing costs paid to traders who anticipated the fund’s moves, dividends sitting idle while the index assumed they were working, cash balances that never fully deploy, and securities lending revenue that only partially flows through.
These effects compound rather than simply add. Addressing one without accounting for the others still leaves you exposed to a gap larger than the expense ratio explains. As ETF markets mature and fee competition pushes expense ratios toward zero, the differentiating variable between otherwise similar products will increasingly be operational efficiency. Tracking difference literacy is a durable investor skill, and it starts with understanding that the number on the fee card was never the full picture.
Passive index fund underperformance relative to the theoretical benchmark is therefore a separate question from the more commonly discussed passive versus active debate: even a fund with a 0.03% expense ratio that beats 90% of active managers can still trail its own index by a material margin through the operational frictions described here, a distinction that matters when evaluating passive strategies on their own terms rather than only against actively managed alternatives.
Tracking difference is the cumulative return shortfall between an ETF and its benchmark over a given period, capturing every operational friction including fees, rebalancing costs, and cash drag. Tracking error measures the volatility of that gap from period to period, telling you how consistently the fund replicates the index rather than how large the total shortfall is.
The expense ratio only captures the management fee deducted from assets; it does not account for rebalancing costs paid to traders who front-run index changes, dividends sitting idle in cash before reinvestment, persistent cash balances that earn less than equities, and securities lending revenue that only partially flows through to the fund.
Professional traders monitor published index eligibility criteria and buy anticipated additions before the official announcement, pushing prices higher; when the ETF is obligated to purchase those stocks at inclusion, it pays inflated prices while the index records the change as a costless accounting adjustment, creating a real transaction cost that the benchmark never bears.
Cash drag occurs because ETFs must hold working cash balances at all times to cover dividend processing, creation and redemption flows, and operational needs; that cash earns significantly less than equities, and because equity markets tend to rise more than they fall over time, the drag compounds into a measurable shortfall that no amount of efficient management can eliminate entirely.
Look up the historical tracking difference for each fund first, since this single number captures every friction in practice; a fund with a slightly higher expense ratio but a consistently smaller tracking difference will often be the better deal by outcome, and you should also check the securities lending revenue-sharing policy, because the proportion passed through to the fund is a material differentiator between otherwise identical products.