
AI, Railways, and the Case for Surviving the Bubble First
13 hrs ago

Most investors have watched a stock double or triple in days and assumed the company suddenly got much better. Sometimes it did. But sometimes the buying had almost nothing to do with the business, and everything to do with traders who were betting against it being forced to reverse course at the worst possible moment.
The term “short squeeze” entered mainstream vocabulary after GameStop’s extraordinary January 2021 run, but the mechanics behind it are older, more universal, and more relevant to everyday investing than most people realise. Understanding how a squeeze works protects you from two very different mistakes: misreading what is actually driving a price spike, and buying into one too late.
By the end of this piece, you will understand exactly why short squeezes happen, which signals suggest one may be building, and how to use that knowledge to make smarter decisions, whether you are considering a position or simply trying to make sense of a stock that seems to be defying gravity.
To understand a squeeze, you need to understand the position that makes it possible. Short selling is a three-step trade:
The logic is straightforward: if you believe a stock is overvalued, you sell shares you do not own and repurchase them once the price falls. When it works, the gain is the gap between the selling price and the lower repurchase price. But the risk profile is deeply lopsided.
The asymmetry that defines the trade: A short seller’s maximum gain is capped at 100% of the position’s value (the stock drops to zero and you keep everything). Losses, however, are theoretically unlimited, because a stock price has no ceiling.
On top of that asymmetry, the clock is always running. Borrowed shares accrue interest costs over the holding period. If the company issues a dividend, the short seller must pay that dividend to the lender. And as the position moves against them, brokers can demand additional collateral or force the position closed entirely.
This is the single fact that makes short squeezes possible: unlike a long investor who can simply wait out a drawdown, a short seller faces mounting costs and margin pressure the longer a trade goes against them. Time and price both work against them simultaneously.
Borrow fees, margin requirements, and dividend obligations mean the short selling costs accumulate daily regardless of whether the trade is working, a structural drag that compounds timing errors into outsized losses even when the directional thesis eventually proves correct.
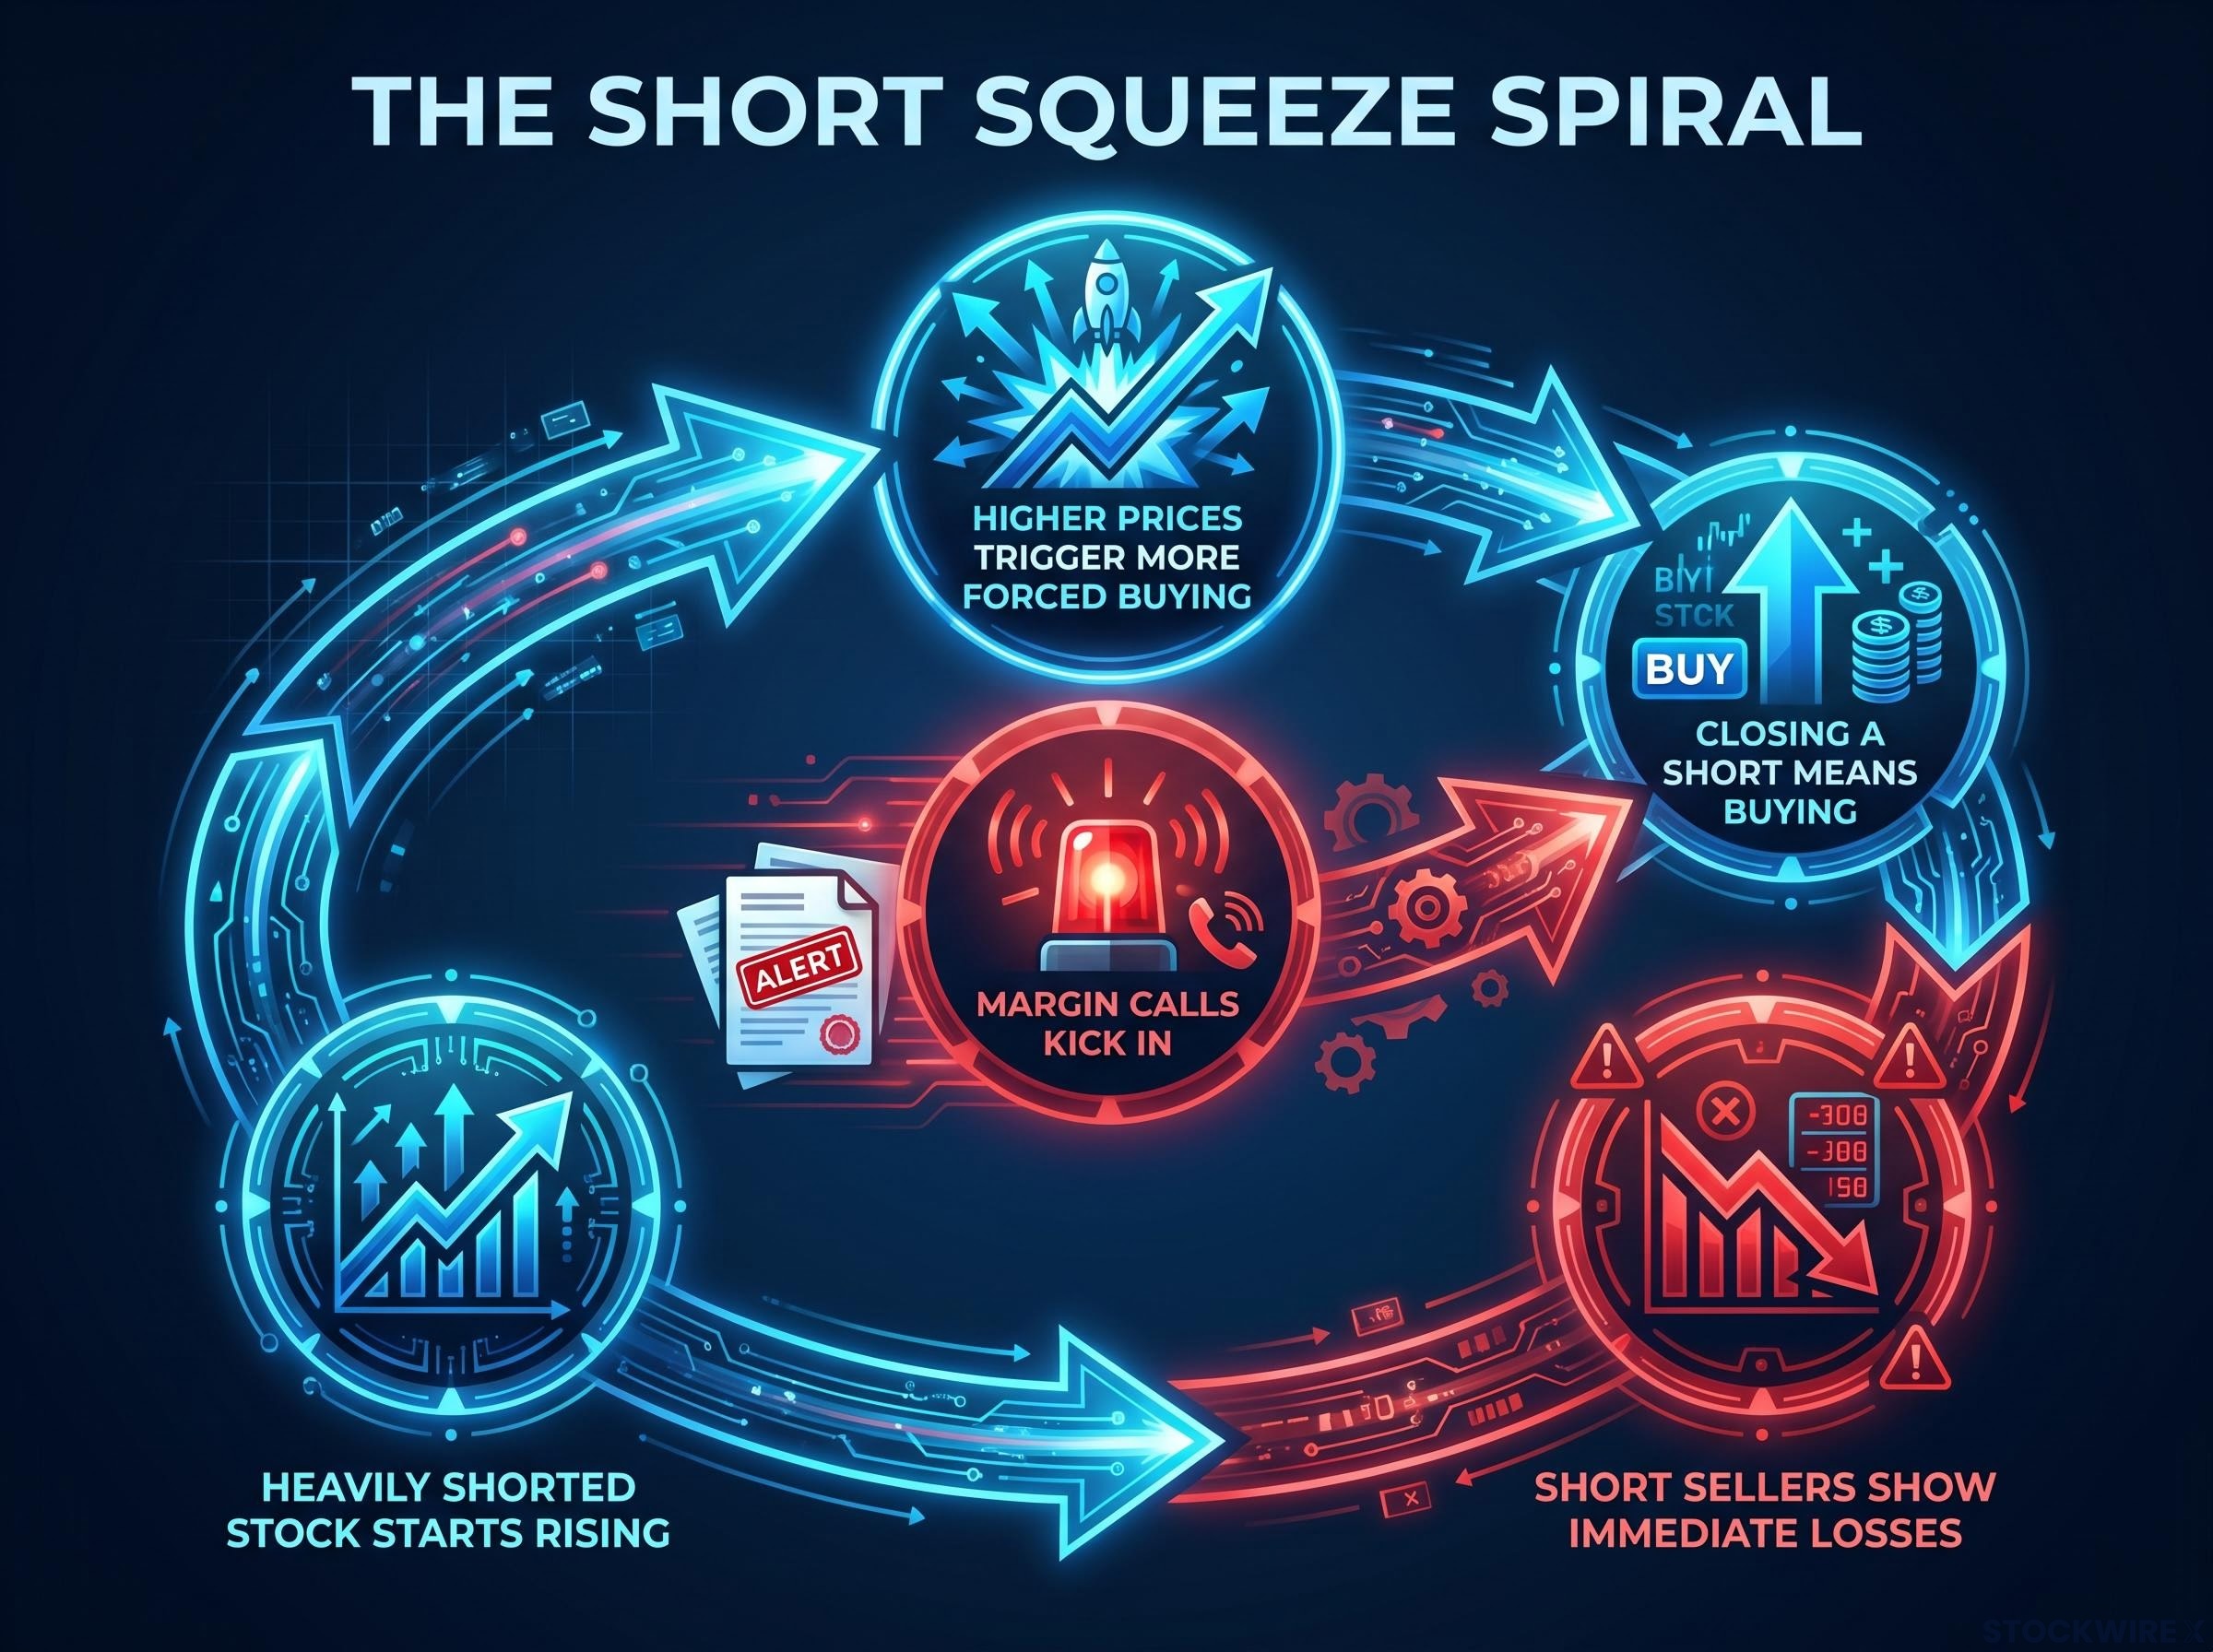
A squeeze is not one event. It is a sequence of cause and effect, and once you see the chain, the outcome starts to feel almost inevitable.
Each forced purchase adds buying pressure that pushes the price higher, which triggers additional short sellers to close. The spiral feeds itself.
A rally built on improving fundamentals tends to build gradually. Volume is elevated but not frenetic, and the gains hold because real business improvement underpins them.
A squeeze looks nothing like that. The price spikes over days, sometimes hours. Volume explodes to many multiples of normal levels. And when the forced buying exhausts itself, there is no fundamental reason for the price to stay elevated. The reversal can be as violent as the spike itself. Recognising that distinction is what prevents you from interpreting a parabolic price move as a signal of genuine business improvement, which is the mistake that draws late buyers into the worst entry points.
No single signal predicts a squeeze. These are conditions that raise the odds. Think of them as a cumulative probability framework: the more that stack together, the more elevated the risk for everyone involved.
The first three signals are structural. They tell you the conditions are present. The next three are dynamic; they tell you something may already be happening.
The gamma squeeze effect: Market makers who sold call options hedge by buying shares. As the stock rises, they must buy more. That dealer hedging adds a second layer of forced buying on top of short covering.
Volume confirmation applies well beyond squeeze detection: a price breakout lacking strong volume participation carries a materially higher probability of failure and reversal, which is why traders treat volume as a primary sanity check on every price signal, not just the extreme moves that squeezes produce.
| Signal | Key threshold | Why it matters |
|---|---|---|
| Short interest (% of float) | Above ~20% | Large pool of traders who must eventually buy back shares |
| Days to cover | Above ~7-10 | Shorts cannot exit quickly at normal volume |
| Borrow costs | Elevated and rising | Holding the short position is increasingly expensive |
| Catalyst | Present or imminent | Provides the trigger that can ignite forced covering |
| Call options activity | Unusual volume in short-dated calls | Dealer hedging adds a second forced-buying layer |
| Volume | Several multiples above normal | Signals buying pressure may already be overwhelming supply |
When several of these signals stack together on the same stock, it tells you the conditions for a violent forced-buying event are present. That matters whether you own the stock, are considering it, or are simply trying to understand why a name is moving.
Short interest (percentage of float and days to cover) is reported twice monthly through the Financial Industry Regulatory Authority (FINRA) and major exchanges, and is available on most retail brokerage platforms and financial data sites without requiring a premium subscription. The key limitation: because reporting occurs twice monthly, the publicly available data may be up to two weeks old. Treat it as directional context rather than a real-time snapshot. For a more current picture, combine reported short interest with real-time price action, volume, and options activity.
FINRA short interest reporting requires firms to submit positions twice monthly, with public data released on the seventh business day after settlement, which is why the figures available on retail platforms can lag real-world positioning by up to two weeks.
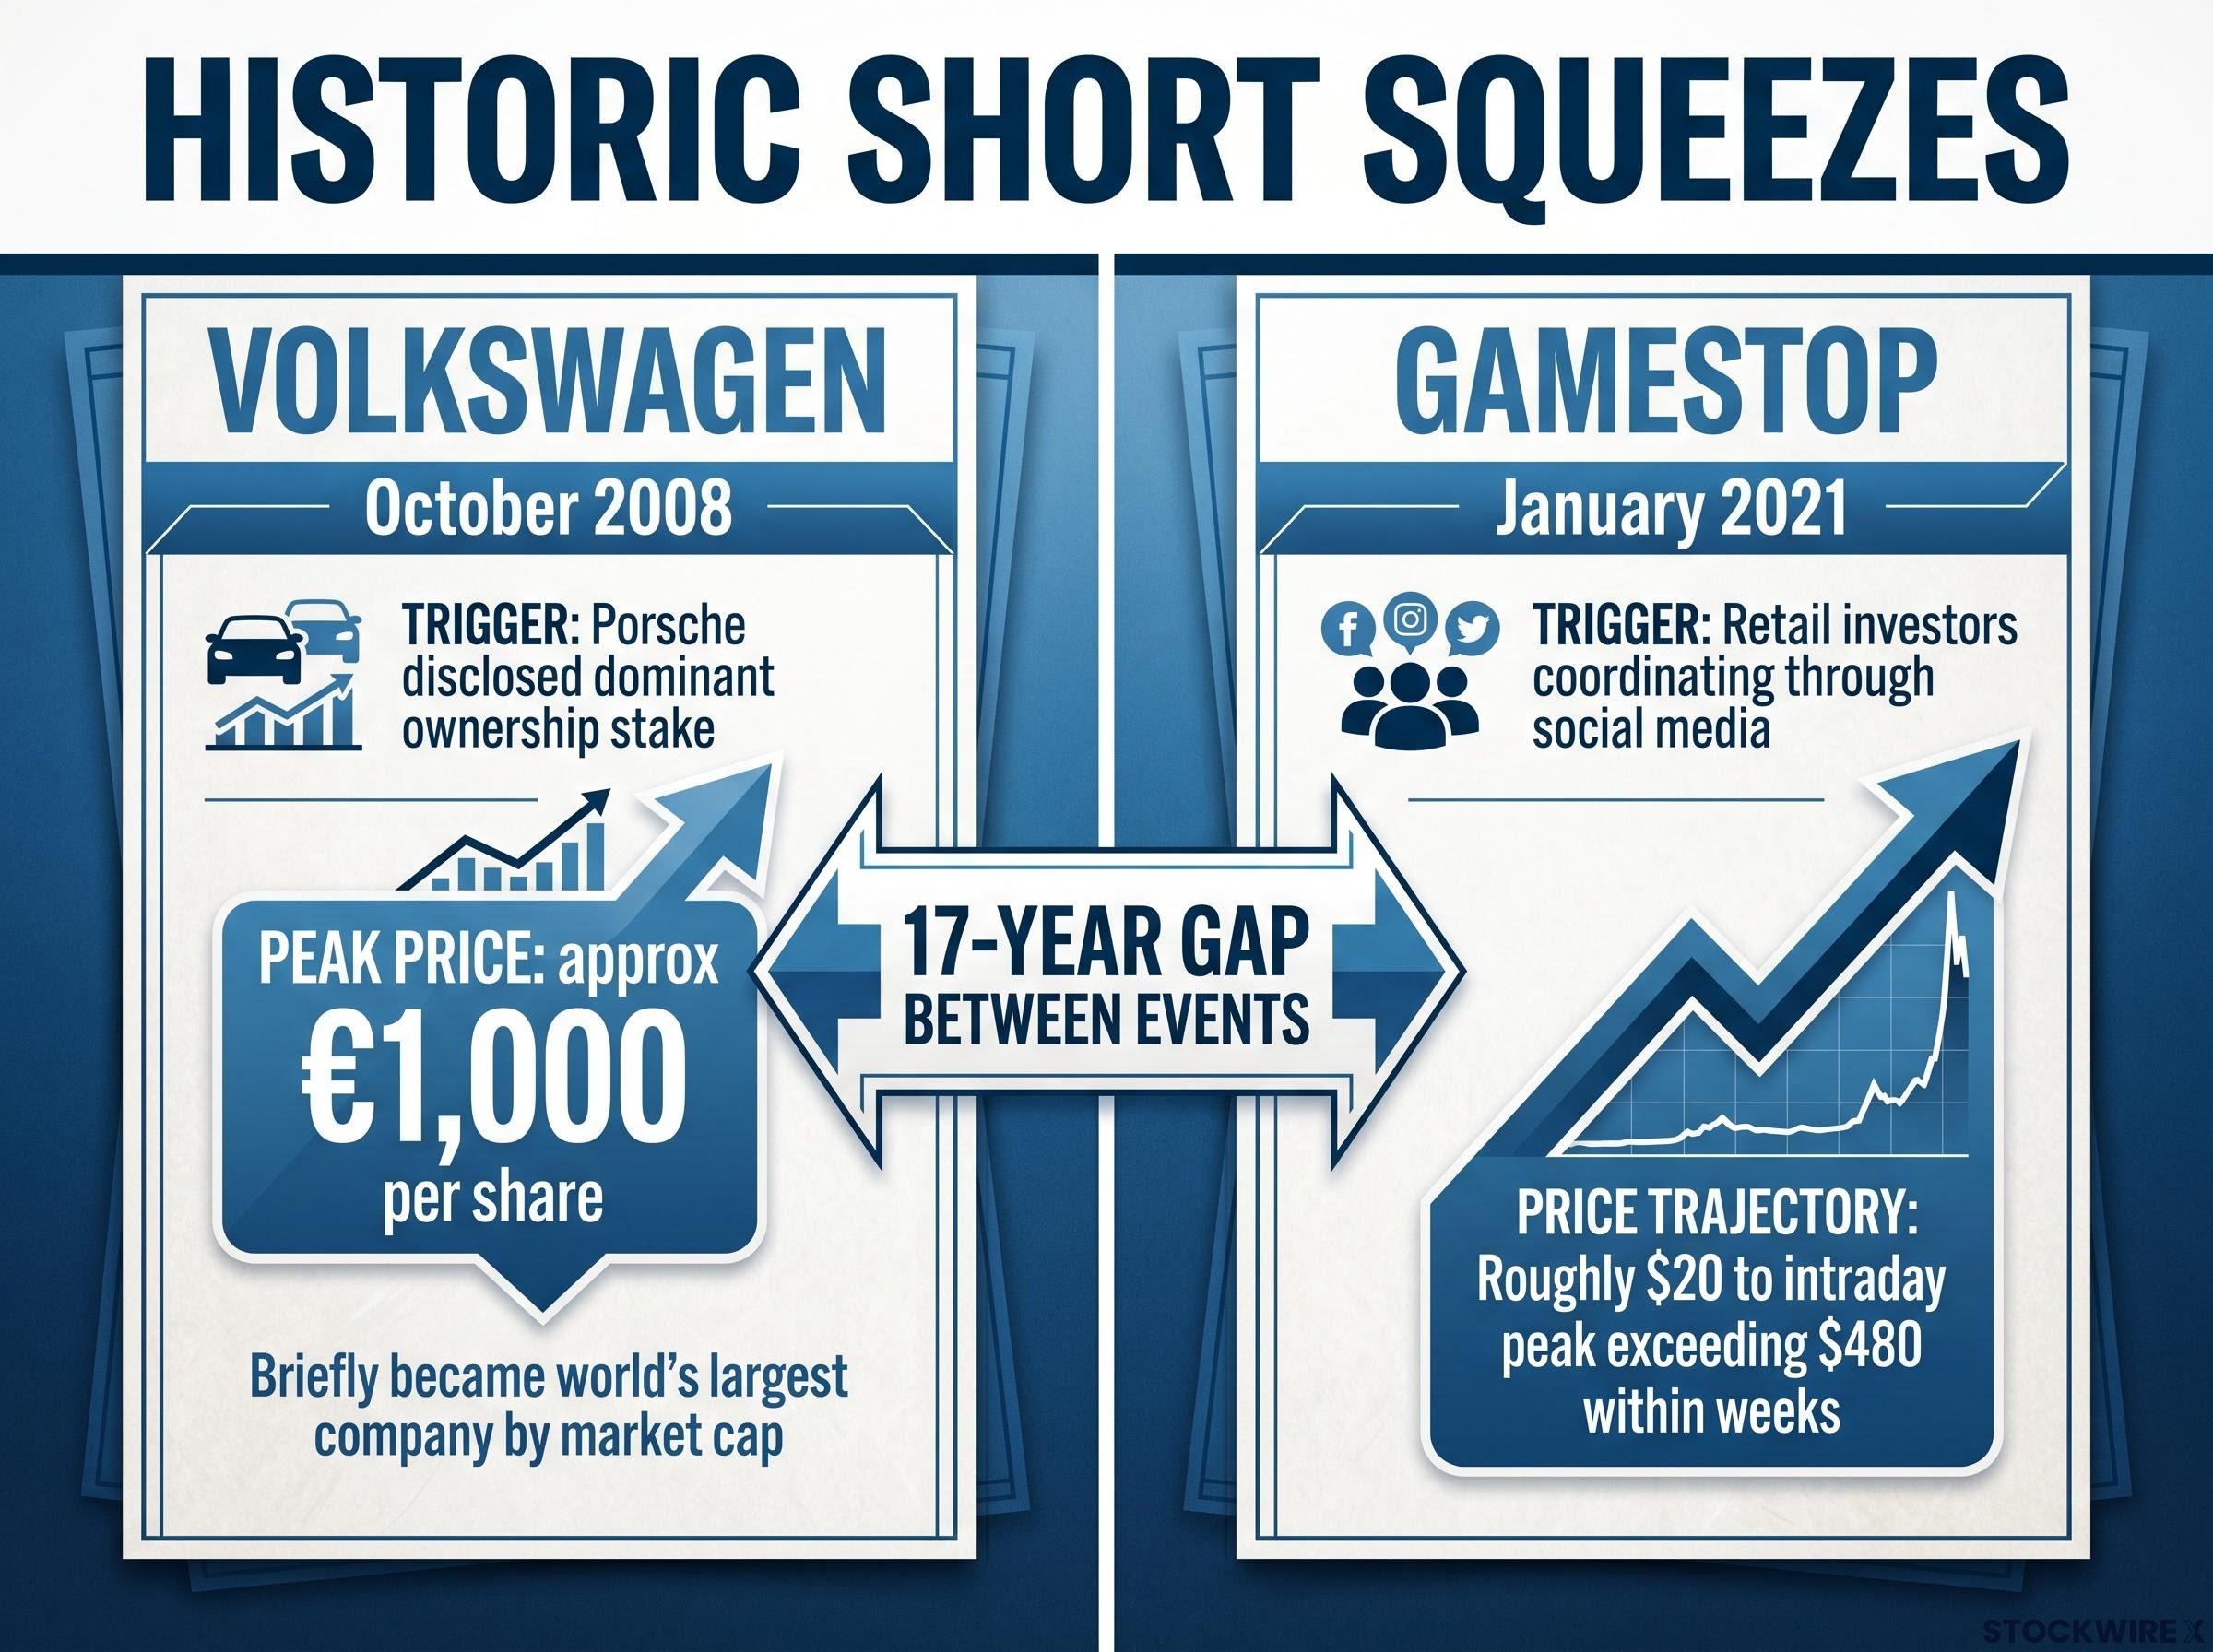
The mechanics above are not hypothetical. Two episodes, separated by more than a decade and driven by completely different forces, played out in almost identical fashion.
In October 2008, Porsche disclosed an undisclosed dominant ownership stake in Volkswagen, which suddenly left short sellers with very few available shares to purchase for covering. Volkswagen’s share price surged to approximately €1,000 per share before rapidly reversing. Volkswagen briefly became the world’s largest company by market capitalisation during the episode, a position that had nothing to do with its underlying business value and everything to do with the structural trap short sellers found themselves in.
In January 2021, GameStop shares climbed from roughly $20 at the start of the month to an intraday peak exceeding $480 within weeks. Retail investors, coordinating through social media platforms, piled into a stock where short interest was extraordinarily high. The episode demonstrated how options market dynamics (the gamma squeeze described above) could amplify a traditional short squeeze through forced dealer hedging, layering one wave of forced buying on top of another.
The shared structural pattern across both cases is worth noting:
The 17-year gap between these two events, and the completely different contexts (institutional manoeuvring versus retail social media coordination), tells you this is a durable market structure phenomenon. It will happen again in some form. The mechanics are the same every time.
Understanding the pattern is one thing. Profiting from it is another. Six specific risks make squeeze trading genuinely dangerous:
Post-earnings short strategies illustrate the timing problem from the opposite direction: institutional short sellers in several documented cases added to bearish positions immediately after 9-31% selloffs, using confirmed downgrade momentum as an entry signal rather than anticipating the decline, a discipline that sidesteps the carrying costs and margin pressure that punish positions held through earnings uncertainty.
The SEC staff report on 2021 meme stock market conditions examined the structural dynamics behind the GameStop episode in detail, including the interaction between short covering, options dealer hedging, and digital retail coordination, and identified areas of market structure that regulators considered examining further.
The exit liquidity problem: If you only notice the stock after it is already up 200-400%, you could be buying just as shorts are finishing their covering, with limited forced demand left behind.
The same signals that tell you a squeeze may be building also tell you the stock is in a high-risk zone for everyone involved, including buyers. Recognising conditions is not the same as having an edge over the people who created those conditions.
The six signals covered earlier are most valuable not as a trading trigger, but as a risk-awareness framework. When several stack together on a single stock, it tells you the conditions for a violent forced-buying event are present, which means elevated risk for both shorts and longs.
Here is the practical checklist:
If multiple boxes are checked, the stock is in a high-squeeze-risk zone. For you, the value of knowing that depends on your position. If you already own a heavily shorted stock and the price suddenly spikes, recognising that a squeeze may be driving the move helps you make a more deliberate decision about whether to hold or exit, rather than assuming the business suddenly improved.
You can also use short interest data retroactively. If you see a dramatic price spike and, in the next reporting period, short interest has dropped sharply, that confirms short covering played a major role. The price move may not reflect genuine business improvement, and that distinction matters for any decision about whether to buy, hold, or stay away.
Institutional short positioning can also foreshadow price dislocations before they occur: published short interest data showed institutional bears lifting stakes in Lotus Resources to approximately 11% of shares in the weeks before the stock fell 34%, a timeline that illustrates how rising short interest sometimes functions as a leading indicator of stress rather than simply a coincident one.
Using this checklist as a lens rather than a signal means you are building better situational awareness of what is actually driving prices in any given stock. That is valuable regardless of whether you ever trade a squeeze directly.
The core distinction worth carrying forward is this: understanding squeeze mechanics is genuinely useful. Predicting squeeze timing is not reliably achievable. Those are different skills, and only one of them is consistently available to you.
What you now hold is practical. You can read short interest data, interpret days to cover and borrow costs, watch for catalyst timing, spot unusual options activity, and distinguish a squeeze-driven spike from a fundamentally driven one. That is a meaningful upgrade to your ability to interpret price action.
Use it to size risk, avoid late entries into parabolic moves, and make sense of unusual price action. That is where the value lives, not in chasing the next squeeze candidate.
This article is for informational purposes only and should not be considered financial advice. Investors should conduct their own research and consult with financial professionals before making investment decisions.
A short squeeze occurs when a heavily shorted stock rises in price, forcing short sellers to buy back shares to cover their losses. That forced buying pushes the price even higher, creating a self-reinforcing cycle that can drive a stock far above its fundamental value.
Six key conditions raise the probability of a squeeze: short interest above roughly 20% of float, days to cover above 7-10, elevated and rising borrow costs, an upcoming catalyst, unusual short-dated call options activity, and a volume spike several multiples above normal. The more of these that stack together on a single stock, the higher the squeeze risk.
Days to cover is calculated by dividing total short interest by average daily trading volume, and it shows how many trading days it would take all short sellers to exit their positions at normal volume. A reading above roughly 10 days is commonly cited as a threshold for elevated squeeze risk, because a mass exit would sustain buying pressure over many sessions.
A gamma squeeze adds a second layer of forced buying on top of short covering. When traders load up on short-dated call options, market makers who sold those calls must hedge by buying shares, and as the stock rises those calls become more price-sensitive, forcing market makers to buy even more shares alongside the short sellers who are already covering.
If a stock has already climbed 200-400% by the time most investors notice it, the forced buying from short covering may be nearly exhausted, meaning late buyers risk purchasing near the peak just as short sellers finish their exits and professional traders begin selling. Extreme intraday volatility, widening spreads, and deteriorating liquidity compound the risk further.