
Why 68% of Australian CFD Traders Lose, and What 2027 Changes
12 mins ago

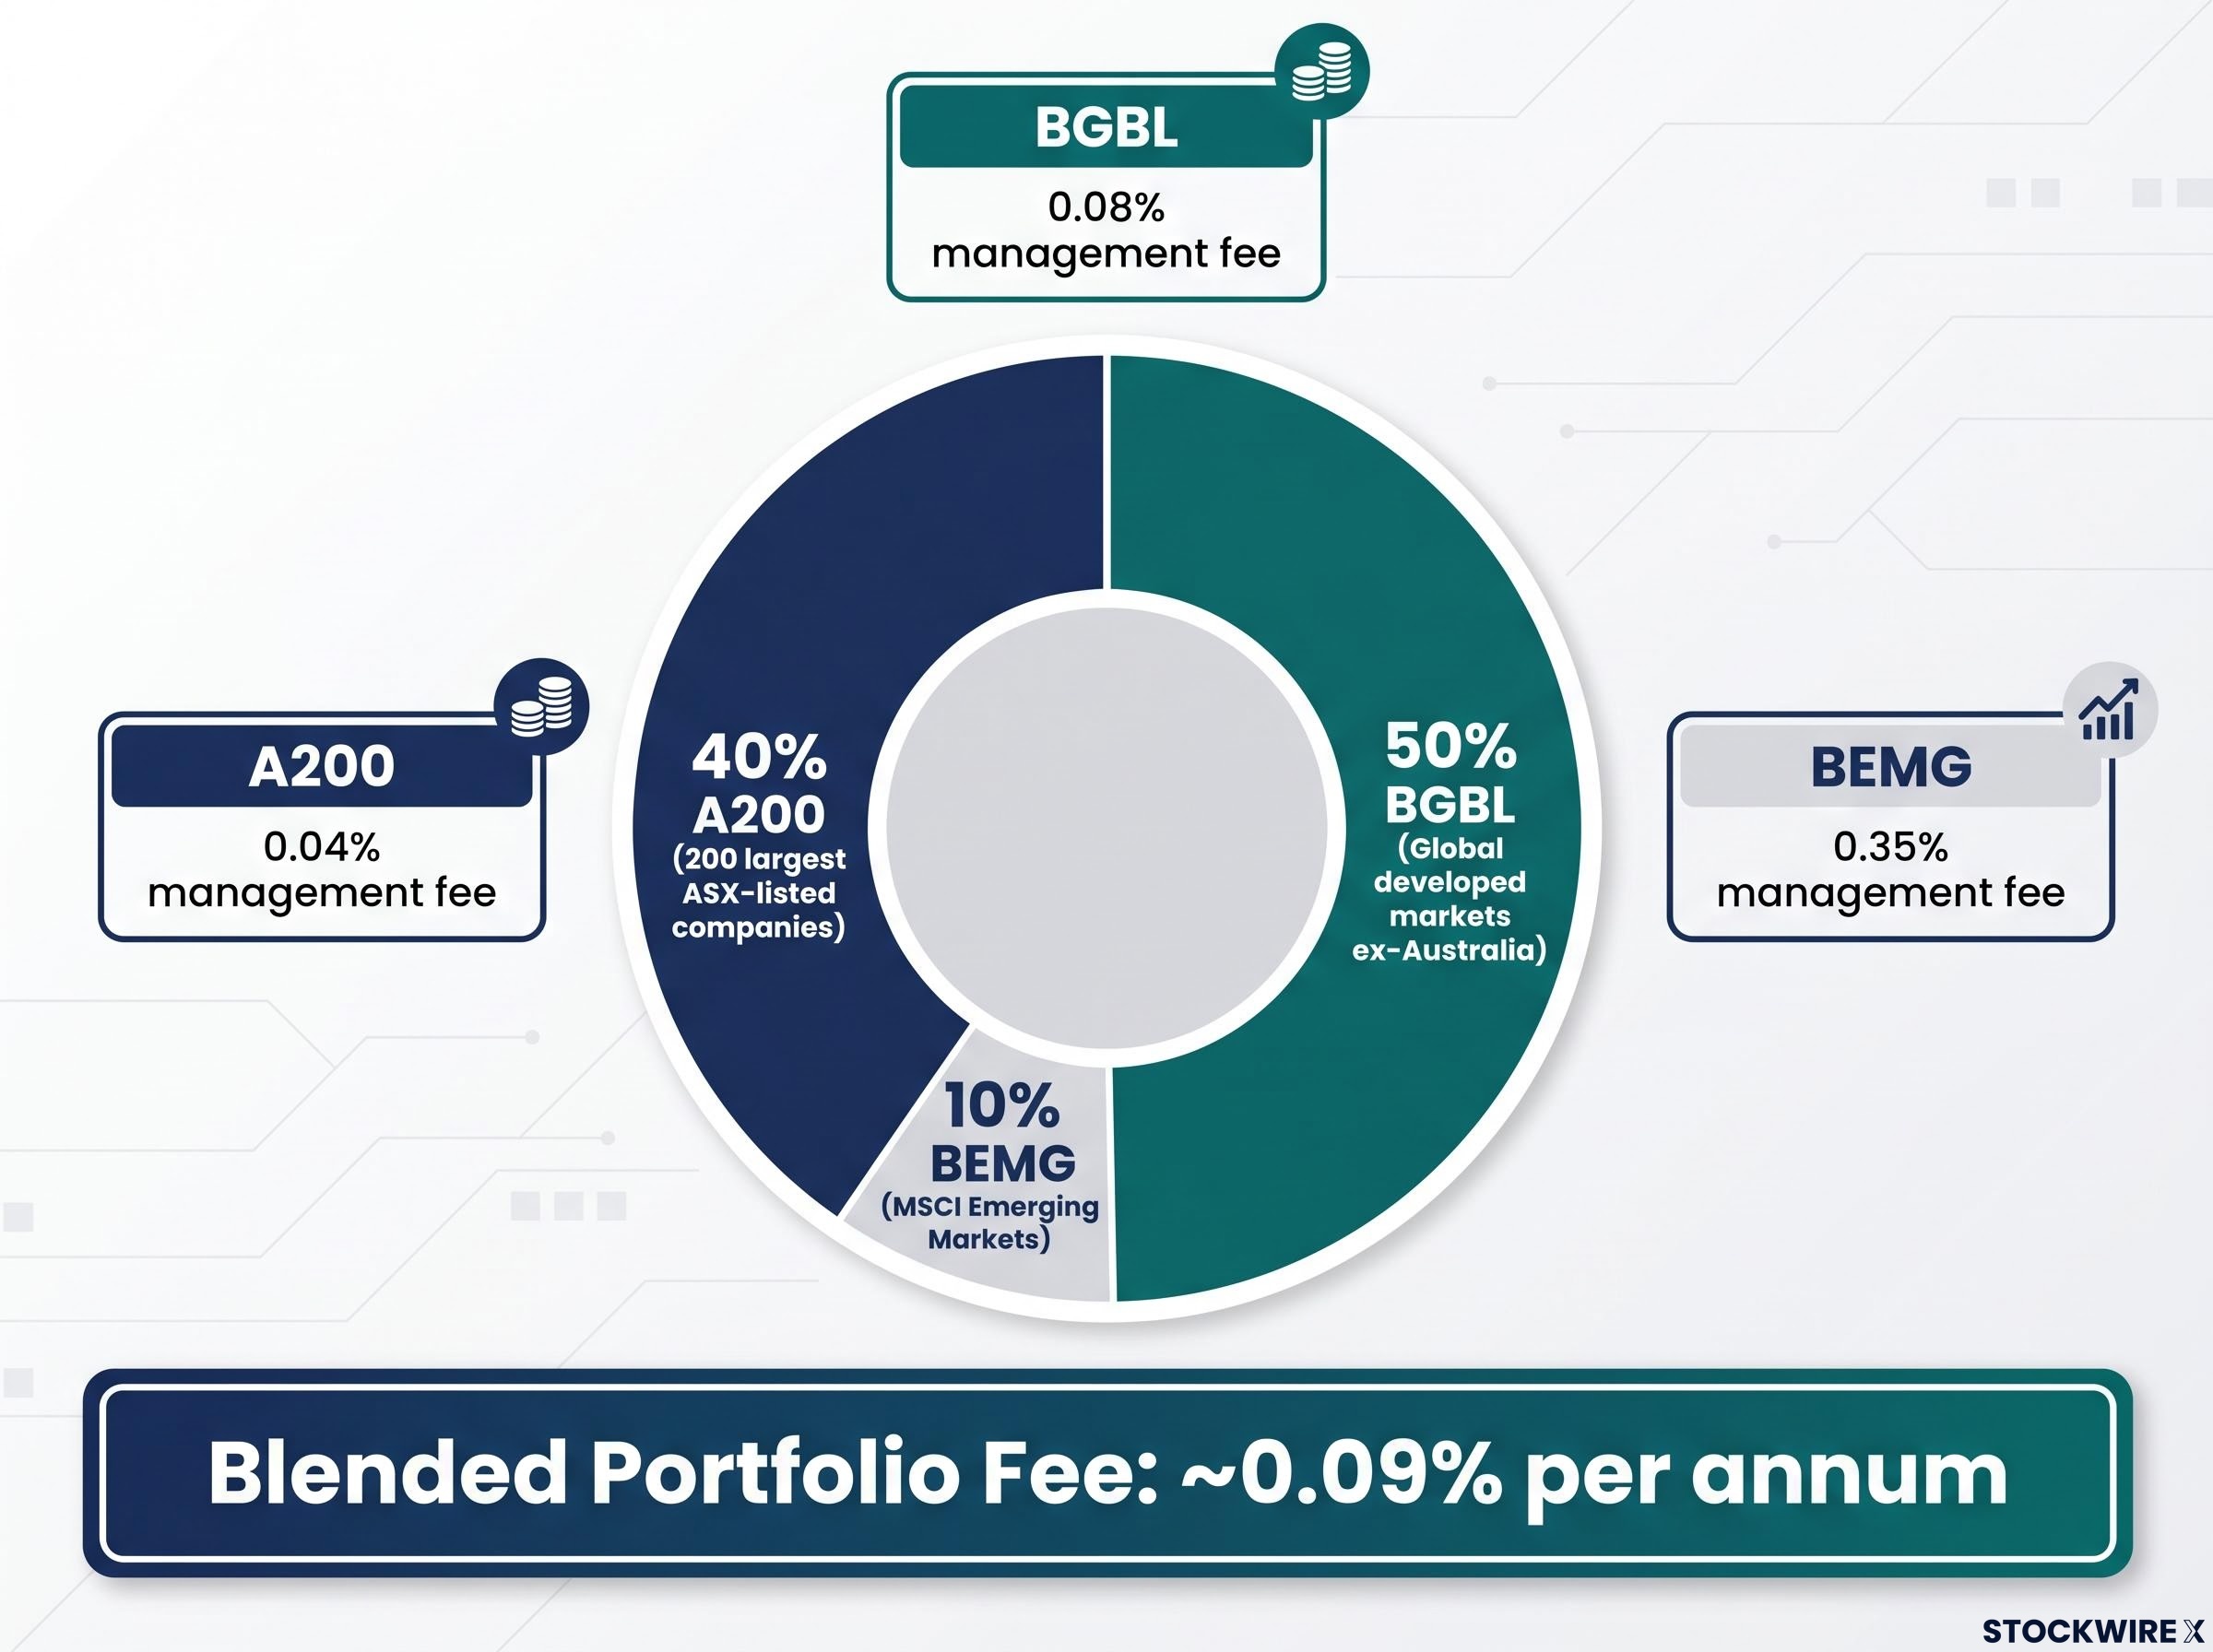
A three-ETF portfolio built from A200, BGBL, and BEMG at a 40/50/10 allocation costs roughly 0.09% per annum in management fees. That is less than half the 0.19% charged by DHHF, the single-ETF alternative most often cited as its competitor. For Australian investors in their 30s seeking broad global diversification without paying for complexity they do not need, this three-fund structure offers a low-cost, low-maintenance framework designed to compound quietly alongside a mortgage, young children, and a busy life. What follows is a complete breakdown of what each ETF does, why the allocation is weighted the way it is, how the model compares to DHHF on cost and effort, and when a leveraged version might or might not make sense.
Consider a couple, both 34, with young children. They have $50,000 invested and contribute $1,000 per month. Their mortgage is manageable, their jobs are stable, and they have no plans to touch their invested capital for at least 20 years.
At 34, the majority of lifetime wealth is still unearned. Future salary income dwarfs the current portfolio several times over, which means the most valuable financial asset this couple holds is their capacity to keep earning and keep contributing. That single fact shapes everything about the portfolio’s design.
Before adopting a 100% equity structure, four preconditions should be in place:
If any of these conditions is absent, a defensive allocation or a shorter-horizon structure may be more appropriate.
Time horizon and risk capacity are directly linked. An investor with 20-plus years before drawdown can absorb short-term volatility that a retiree cannot, because they have decades of future contributions to deploy into lower prices during downturns.
Defensive assets such as bonds or cash serve a behavioural function in growth portfolios: they reduce volatility enough to help investors stay invested during drawdowns. For this investor profile, that buffer is assumed to be unnecessary. The preconditions above, particularly psychological resilience and emergency fund adequacy, substitute for the stabilising role defensive assets would otherwise play.
The priority at this stage is not portfolio optimisation. It is consistency. Monthly contributions of $1,000, applied steadily regardless of market conditions, are the single most important driver of long-term outcomes for this profile.
Each of the three funds covers a distinct slice of global equity markets, and each carries a fee that reflects the structural complexity of accessing its underlying holdings.
| ETF Ticker | Market Exposure | Management Fee (% p.a.) | Approx. Annual Cost per $10,000 |
|---|---|---|---|
| A200 | 200 largest ASX-listed companies | 0.04% | $4 |
| BGBL | Global developed markets (ex-Australia) | 0.08% | $8 |
| BEMG | MSCI Emerging Markets | 0.35% | $35 |
A200 is one of the lowest-cost ETFs available in the Australian market, providing market-capitalisation-weighted exposure to the ASX’s largest companies for just 4 basis points per year. BGBL extends coverage to developed markets outside Australia, including the United States, Europe, and Japan, at 8 basis points.
BEMG is the most expensive of the three at 0.35%, but the higher fee reflects real structural costs rather than inefficiency. Three factors make emerging market ETFs inherently more expensive to manage:
BEMG launched in August 2025, giving it live performance data since launch. In that period, the fund has tracked its benchmark index with a deviation of approximately 6 basis points below the index return, net of fees. That tracking efficiency suggests the fund is managing the complexity of its underlying markets well. Its fee is estimated at approximately half the cost of comparable emerging market ETFs available in Australia.
Australia represents roughly 2% of global market capitalisation. Allocating 40% of the portfolio to Australian equities is therefore a large, deliberate overweight, not a passive result of market-cap weighting.
Two practical considerations underpin the decision. First, Australian dividend imputation passes franking credits through to investors, reducing or eliminating additional tax on dividend income for Australian residents.
The ATO guidance on franking credit refunds confirms that Australian resident investors can apply imputation credits against their income tax liability, with any excess refunded directly, an outcome that materially improves the after-tax return of domestic equity holdings relative to unimputed international distributions.
Franking credits and after-tax returns: Australian companies that pay tax on their profits attach imputation credits to dividends paid to shareholders. For Australian resident investors, these credits reduce or eliminate the additional tax owed on that dividend income, effectively boosting the after-tax return of domestic equity holdings relative to international alternatives that do not carry this benefit.
Second, Australian equities provide a natural currency hedge. An investor whose mortgage, childcare, and grocery bills are denominated in Australian dollars benefits from holding a meaningful portion of their portfolio in AUD-denominated assets, reducing the impact of currency fluctuations on their net worth relative to their liabilities.
Cameron Gleason of BetaShares has noted that the firm’s internal multi-asset modelling supports approximately 40% domestic allocation based on risk-adjusted return optimisation under their own assumptions. The 40/60 domestic-to-global split is a design choice grounded in both tax and currency logic.
The trade-off is concentration. The ASX is dominated by two sectors: financials (led by the four major banks) and materials (mining and resources). A 40% allocation to A200 means 40% of the portfolio is exposed to a sector-skewed slice of the Australian economy rather than a diversified cross-section of global industries.
This concentration ties the domestic component’s performance to commodity cycles and interest rate movements more than a globally diversified allocation would. It is a known limitation rather than a flaw. The 50% allocation to BGBL and 10% to BEMG provide the sector and geographic diversification that the Australian component lacks.
ASX sector concentration, with financials and materials together representing roughly 52% of the S&P/ASX 200, is the structural reality that makes a 40% domestic allocation a deliberate choice rather than a neutral one; the remaining 60% in BGBL and BEMG is doing the diversification work across technology, healthcare, and consumer sectors that the domestic index systematically underweights.
At 0.35% per annum, BEMG is the most expensive fund in the portfolio by a significant margin. That is the first objection most investors raise, and it is worth addressing directly.
The affirmative case rests on structural economic weight. Emerging markets represent a substantial share of global GDP and contain the economies most likely to drive long-term growth over the next two decades. Four countries illustrate the breadth of the opportunity:
The 10% allocation is deliberately modest. It reflects the complexity premium embedded in BEMG’s fee and acknowledges that the investor’s primary exposure to equities runs through developed markets via BGBL. The emerging markets slice is a structural complement, not a performance bet.
Early tracking evidence: Since its August 2025 launch, BEMG has tracked its benchmark with a deviation of approximately 6 basis points below the index return, net of fees. This suggests the fund is slightly outperforming its stated cost in tracking terms, an early signal that the higher fee is being managed efficiently.
DHHF is a single-ETF all-growth solution offered by BetaShares. Its underlying structure covers Australian equities, global developed markets, and emerging markets, making it the most natural single-fund comparison to the three-ETF model. It charges 0.19% per annum.
The blended management fee for the three-ETF portfolio at the 40/50/10 allocation is approximately 0.091% per annum, calculated as: (0.40 x 0.04%) + (0.50 x 0.08%) + (0.10 x 0.35%). That is roughly 0.10 percentage points cheaper than DHHF each year.
What the fee difference means in dollar terms: On a $100,000 portfolio, the annual fee saving is approximately $100. On a $500,000 portfolio, it is approximately $500 per year. At portfolio sizes below $100,000, the dollar saving is modest; the question becomes whether the time spent managing three positions is worth the difference.
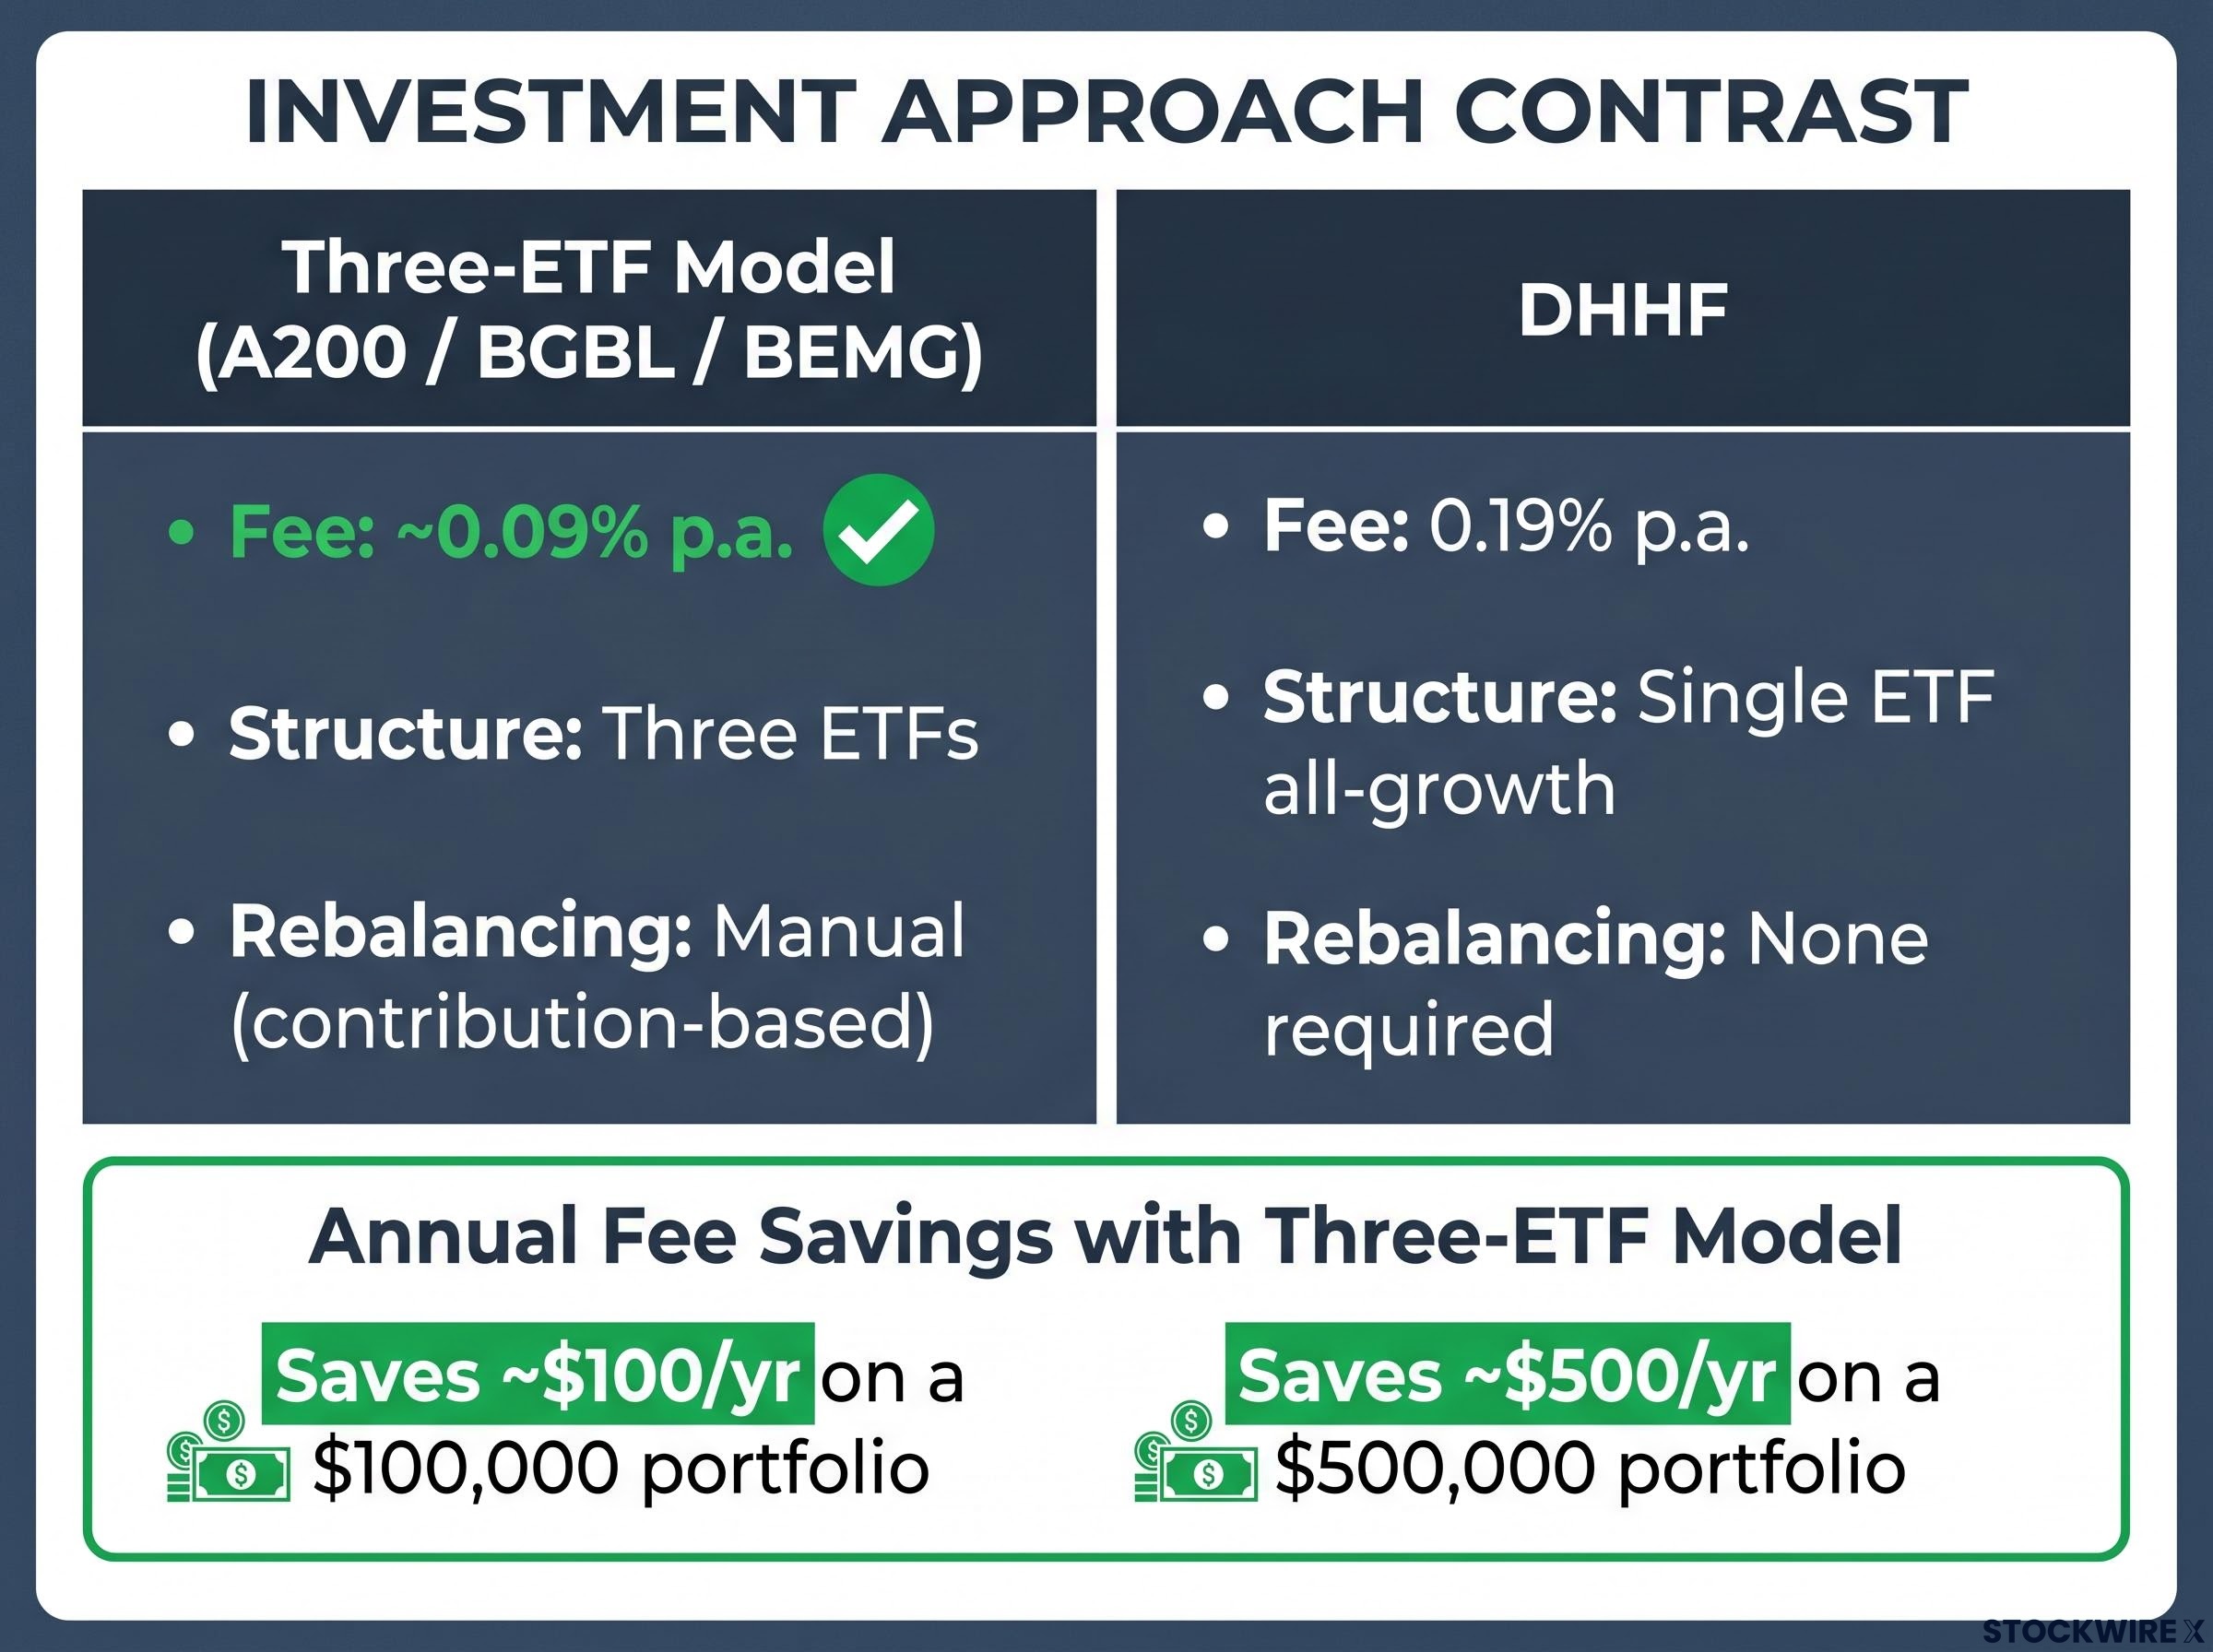
The cost of choosing DHHF is the higher fee. The cost of choosing the three-ETF model is manual allocation across three positions and periodic contribution-based rebalancing. Neither answer is wrong; they serve different preferences.
| Option | Structure | Fee (% p.a.) | Rebalancing Required | Emerging Markets Included |
|---|---|---|---|---|
| A200 / BGBL / BEMG | Three ETFs, manual allocation | ~0.09% | Yes (contribution-based) | Yes (BEMG at 10%) |
| DHHF | Single ETF, all-growth | 0.19% | No | Yes |
| VDHG | Single ETF, ~90% growth / ~10% bonds | Higher than DHHF | No | Yes |
VDHG includes approximately 10% defensive assets (bonds), making it a different product category rather than a direct comparator to the all-equity three-ETF model. Its fee is also higher than DHHF’s 0.19%.
The debate over diversified ETF fee structures has expanded beyond the DHHF versus three-ETF comparison: VanEck launched three actively managed ASX diversified ETFs in April 2026 charging 0.39% per annum, targeting CPI-plus returns across balanced, growth, and high-growth profiles, introducing a third point on the cost-and-complexity spectrum that investors should be aware of.
BetaShares offers leveraged equivalents of its core equity ETFs: G200 (the geared version of A200) and GGBL (the geared version of BGBL). These products allow investors to access leverage without a separate line of credit or mortgage redraw.
ASIC RG 282 on exchange traded products sets out the regulatory framework governing complex ETPs in Australia, including leveraged and geared products, and specifies the disclosure and suitability obligations that issuers must meet before distributing these instruments to retail investors.
Gearing compounds most effectively when markets rise by more than the cost of borrowing over an extended period. For an investor with a stable income, a long time horizon, and no near-term liquidity needs, the mathematical case for modest leverage can look attractive on paper.
Before considering G200 or GGBL, four conditions should be met:
Geared ETF mechanics, including the internal leverage ratio, daily rebalancing drag, and variable borrowing costs that sit outside the stated MER, differ materially from external gearing through mortgage redraw or margin lending, and understanding those differences is important before treating G200 or GGBL as a simple amplifier of the ungeared strategy.
A geared portfolio introduces more decision points. During a 30% drawdown, the leveraged investor faces amplified losses and must resist a stronger emotional pull to sell. Every additional decision point is an additional opportunity for behavioural error.
The investor profile described in this guide has young children and limited time. Simplicity is not merely a convenience; it is a form of risk management. A portfolio that requires less monitoring, fewer decisions, and no leverage-related stress is one that compounds more reliably across decades, because the investor is more likely to maintain it.
For this profile, the ungeared three-ETF model is the stronger starting point. Gearing remains a future consideration for investors whose financial stability, time horizon, and understanding of leverage mechanics are all confirmed.
The three-ETF model is not built to be theoretically optimal. It is built to be sustainable: low-cost, broadly diversified, and easy to maintain through monthly contributions at the 40/50/10 split. The blended fee of approximately 0.09% per annum is roughly half the cost of DHHF’s 0.19%, and the structure covers Australian equities, global developed markets, and emerging markets in three positions.
Monthly contributions applied in approximate proportion to the target allocation reduce the need for formal rebalancing trades and the capital gains events they trigger. Three practical actions are available this week:
A portfolio investors can maintain through drawdowns, life changes, and market noise is more valuable than a theoretically superior portfolio that gets abandoned or over-managed.
For investors wanting broader context on where Australian retail portfolios are moving, our detailed coverage of the international ETF shift examines Q1 2026 flow data showing global equity ETFs attracted AU$17.3 billion in net inflows compared with AU$10.6 billion into domestic funds, the first time international products overtook domestic as the most purchased category on record.
This article is for informational purposes only and should not be considered financial advice. Investors should conduct their own research and consult with financial professionals before making investment decisions. Past performance does not guarantee future results.
A three ETF portfolio is a simple investment structure that uses three exchange-traded funds to cover distinct slices of the global equity market. For Australian investors, a common version uses A200 for domestic equities, BGBL for global developed markets, and BEMG for emerging markets, combined at a set allocation such as 40/50/10.
The blended management fee works out to approximately 0.091% per annum, calculated by weighting each ETF's fee by its allocation: 0.40 multiplied by 0.04% plus 0.50 multiplied by 0.08% plus 0.10 multiplied by 0.35%.
The overweight to Australian equities is deliberate, reflecting two practical benefits: Australian franking credits reduce or eliminate additional tax on dividend income for resident investors, and holding AUD-denominated assets provides a natural currency hedge against domestic liabilities such as a mortgage.
The three ETF model costs approximately 0.09% per annum versus DHHF's 0.19%, but requires manual allocation across three positions and contribution-based rebalancing; DHHF is a single fund that rebalances automatically, making it simpler to manage at the cost of the higher fee.
Emerging markets are most suitable for investors with a long time horizon of 20 or more years who want exposure to economies such as India, China, South Korea, and Brazil that represent a significant share of global GDP and are projected to drive long-term growth; the 10% allocation to BEMG in this portfolio treats emerging markets as a structural complement rather than a performance bet.