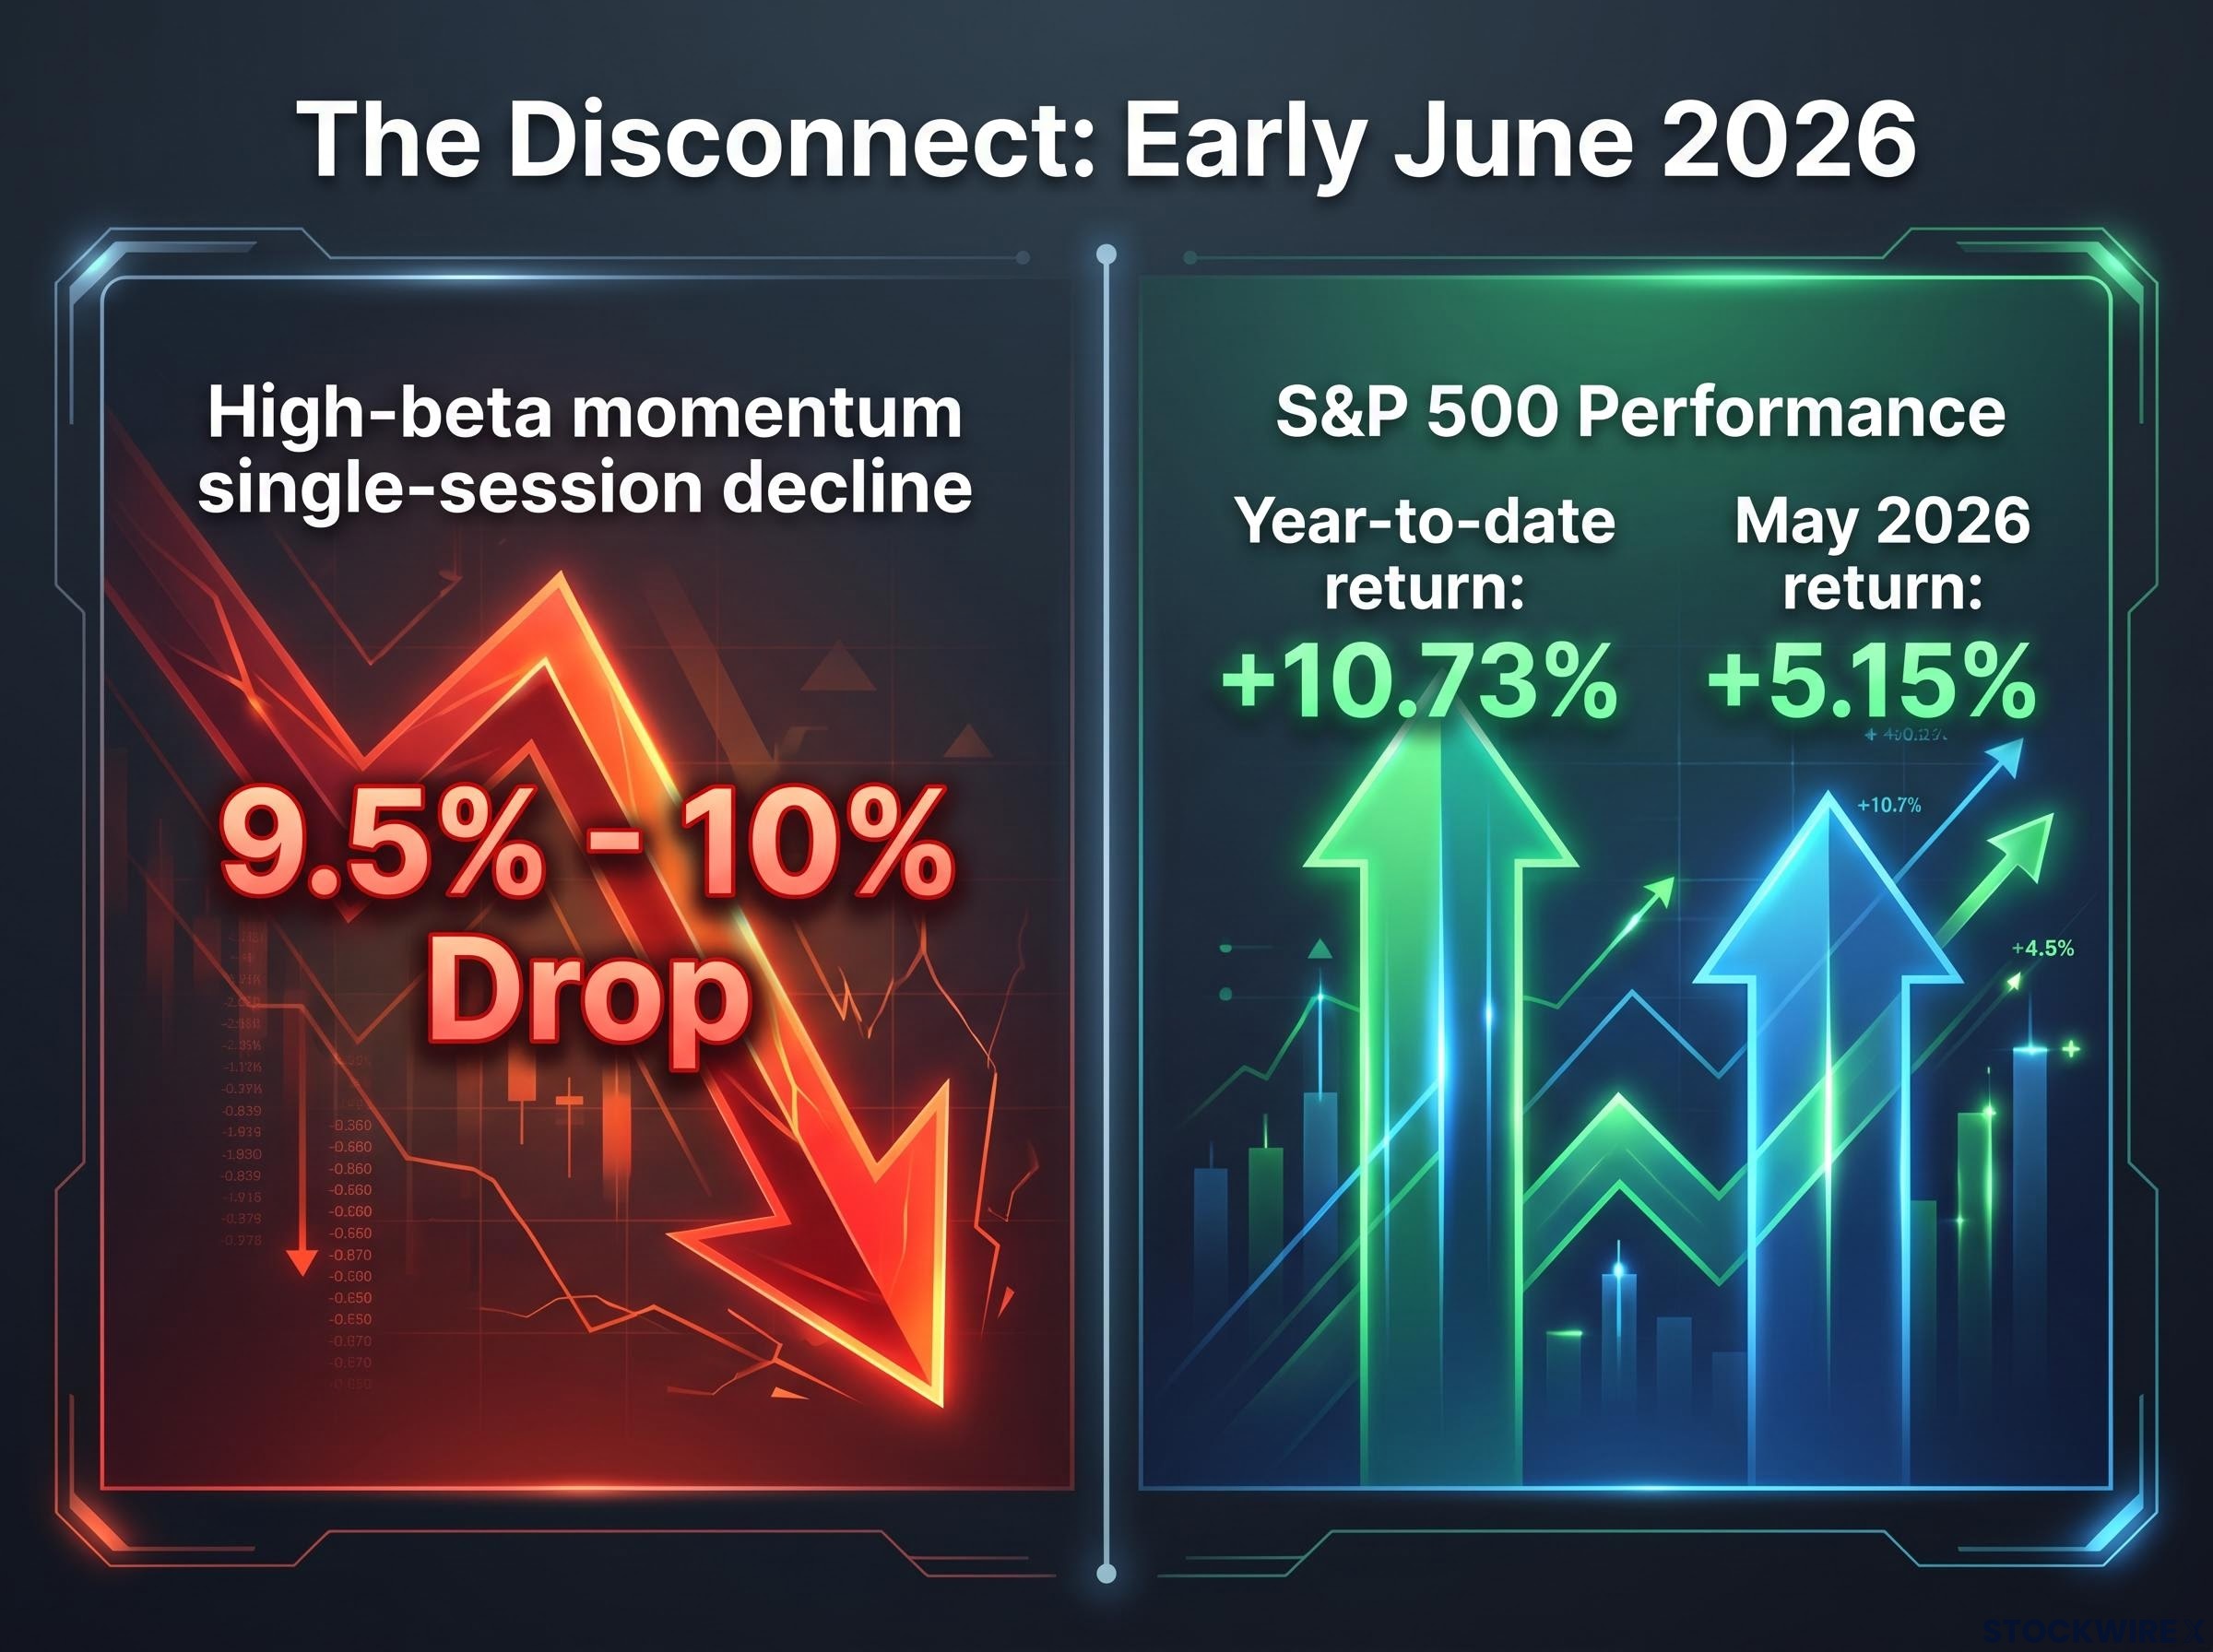
High-beta momentum equities suffered their worst single-session decline since the COVID-19 era on Friday, falling approximately 9.5%-10% in a day that forced a reckoning with one of the market’s most crowded trades. The selloff did not arrive in a deteriorating macro environment. The S&P 500 remained up 10.73% year-to-date entering June, and May alone delivered a 5.15% gain for the broad index. That disconnect, a near-historic factor collapse inside a still-strong bull market, is what makes the early-June momentum factor unwind structurally significant rather than routine.
What follows explains what a momentum unwind is, why it happened now, where BTIG analyst Jonathan Krinsky sees the selling pressure standing, and where capital appears to be rotating. The aim is to give readers the full picture to assess whether this was a one-day flush or something more durable.
A single session that rewrote the recent record books
The scale of the decline deserves to land first. According to BTIG’s Jonathan Krinsky, high-beta momentum equities fell approximately 9.5%-10% in a single Friday session in early June 2026, a magnitude not seen since the pandemic-era dislocations of 2020.
Historical context: BTIG identified the single-session decline as the worst one-day loss for high-beta momentum equities since the COVID-19 period, placing it among the most severe factor-level selloffs in recent market history.
That this happened on a Friday compressed the full weight of the positioning pressure into one session, with no opportunity for intraday stabilisation across a weekend.
The broader market told a different story entirely:
- High-beta momentum single-session decline: approximately 9.5%-10%
- S&P 500 year-to-date return: +10.73%
- S&P 500 May 2026 return: +5.15%
The selloff was not a broad market event. It was a factor-specific collapse concentrated in the names that had led the prior rally, while the index itself remained firmly positive for the year.
When big ASX news breaks, our subscribers know first
What a momentum factor unwind actually means
The signal a reader would have seen on Friday was straightforward: popular high-growth names dropped sharply while sectors that had barely moved for months suddenly surged. The mechanics underneath that surface explain why the move was so violent.
Quantitative and factor-based funds hold long positions in recent winners and short positions in recent losers. When the winners begin falling and the laggards begin rising simultaneously, these funds face forced rebalancing, selling their longs and covering their shorts at the same time. Multiply that dynamic across dozens of funds holding similar positions, and the result is a concentrated, self-reinforcing selloff.
The dispersion that preceded the unwind made the setup particularly acute. Consider how unevenly sectors performed in May 2026:
| Sector | May 2026 Return |
|---|---|
| Technology | ~+16% |
| Healthcare | +2.6% |
| Consumer Cyclicals | +2.1% |
BTIG described this gap as “extreme market dispersion” accumulated over prior months, precisely the condition that loads the spring for a disorderly unwind.
Why concentrated positioning makes the exit more disorderly
When many funds own the same winners and short the same losers, any reversal in price leadership forces selling pressure to concentrate at the same moment. There is no orderly queue; every fund hits the same exit simultaneously.
The positioning excess that produced Friday’s unwind did not emerge in isolation: US equity market concentration had reached a level with no modern historical precedent in the weeks before the selloff, with five companies controlling roughly 30% of total market capitalisation and passive index holders carrying that concentrated exposure by default.
Morningstar’s June portfolio commentary recommended a “barbell strategy” balancing deep value with growth and AI exposure, a positioning response that reflects professional recognition that broadening market leadership is a real risk after prolonged concentration.
Analyst estimates suggest further selling pressure ahead
The selloff may not be finished. BTIG’s Jonathan Krinsky estimated that an additional 11%-12% of downside risk remains from continued long/short momentum factor unwinding.
Goldman Sachs issued a momentum reversal warning in mid-May 2026, identifying the AI-driven surge as one of only 11 comparable episodes since 1980, each of which reversed within roughly one month of peaking, and noting that hedge fund gross leverage and net momentum exposure were near five-year highs at the time, conditions that amplify forced deleveraging well beyond what fundamentals alone would produce.
Forward risk estimate: Jonathan Krinsky of BTIG estimates an additional 11%-12% of downside risk from ongoing momentum factor unwinding, based on the positioning imbalances that remained after the initial selloff.
That figure warrants careful framing. It represents a forward-looking risk assessment, not a confirmed outcome. The estimate reflects the residual positioning concentration that had not yet been unwound as of early June.
The competing interpretation carries weight as well. Because this unwind is mechanical, driven by positioning rather than a fundamental re-rating of earnings or growth prospects, it can reverse quickly once forced selling exhausts itself. The macro backdrop as of early June 2026 did not show deteriorating conditions: no material change in rate expectations, no earnings shock, and the S&P 500 still up 10.73% for the year.
Investors with concentrated high-growth exposure face a genuine fork. Krinsky’s estimate suggests meaningful additional risk; the still-healthy macro context suggests the floor may hold sooner than the positioning data implies.
Where the money appears to be going instead
As momentum names sold off, capital rotated into the market’s most neglected corners. Healthcare and financials, identified by BTIG as the bottom two S&P 500 sectors on a year-to-date basis through 2 June 2026, began breaking out of multi-month consolidation patterns during early June.
They were not alone. Four sectors showed simultaneous breakout signals:
- Healthcare
- Financials
- REITs
- Consumer staples
| Sector | YTD Status Before Selloff | Breakout Signal During Early June |
|---|---|---|
| Healthcare | Bottom two S&P 500 YTD | Multi-month consolidation breakout |
| Financials | Bottom two S&P 500 YTD | Multi-month consolidation breakout |
| REITs | Underperformed tech significantly | Renewed strength during early June |
| Consumer Staples | Underperformed tech significantly | Renewed strength during early June |
Each of these sectors significantly underperformed technology during the prior momentum surge, making their simultaneous technical moves consistent with the mechanics of a factor unwind. The laggards receiving inflows are the mirror image of the winners facing forced selling.
The breadth dynamics underlying the momentum unwind had been signalling a small-cap rotation for weeks before the Friday selloff: fewer than 60% of S&P 500 constituents were trading above their 200-day moving average despite index-level gains of approximately 14% over 23 trading days, a narrow breadth foundation that historically precedes the kind of leadership broadening now visible in healthcare, financials, and consumer staples.
Temporary dip or structural shift in market leadership?
Two cases compete, and the evidence as of early June does not settle the question.
- Case for a temporary crowding flush:
- Macro conditions have not materially changed; no rate shock or earnings deterioration has occurred.
- Factor unwinds are mechanical phenomena driven by positioning, not fundamentals, and they can reverse once forced selling completes.
- The S&P 500 remains up 10.73% year-to-date, suggesting the broader growth regime is intact.
- Case for a structural leadership shift:
- The single-session decline’s magnitude was comparable only to COVID-era drawdowns, well beyond routine volatility.
- BTIG’s estimate of 11%-12% remaining downside implies the unwind was not complete after a single session.
- Four lagging sectors breaking out of multi-month consolidation patterns simultaneously suggests more than a one-day technical reaction.
The honest assessment: the research base as of early June 2026 does not permit a definitive verdict. The signal to monitor over the following weeks is whether the technical breakouts in healthcare, financials, REITs, and consumer staples sustain. If they do, the rotation argument strengthens materially. If they fade, the temporary-flush reading gains the upper hand.
What market history tells us about the aftermath of extreme factor unwinds
Momentum unwinds driven by crowded positioning rather than fundamental deterioration have historically tended to be disorderly but finite. The recovery pace has depended heavily on whether the underlying macro regime actually changed during the selloff period.
The COVID-era comparison that BTIG invoked is instructive in both directions. That selloff was severe, but the recovery in growth names was also swift, driven in large part by unprecedented fiscal and monetary stimulus. The mid-2026 environment differs on this count: stable rates and a healthy economy provide a floor, but there is no comparable stimulus catalyst to accelerate a snapback.
How the current cycle differs from the COVID-era precedent
The structural distinction matters. The 2020 unwind was triggered by an exogenous macro shock, a global pandemic, while the early-June 2026 unwind appears positioning-driven within a still-healthy economy. Positioning-driven unwinds can reverse faster, but they can also persist longer if the underlying concentration was severe enough to require extended rebalancing.
Practitioner positioning: Morningstar’s June 2026 commentary recommended a barbell strategy, balancing deep value with growth and AI exposure, a historically grounded response to post-unwind environments where market leadership remains uncertain.
The barbell framing acknowledges both possibilities: that growth may reassert itself and that value and defensive sectors may sustain their breakouts. In environments where the verdict is genuinely unresolved, diversified positioning across both sides of the barbell has historically served as a risk management tool rather than a directional bet.
A market in transition, not in crisis
The early-June momentum selloff was historically severe in magnitude but occurred within a broadly positive, still-functioning market. That combination shapes the range of plausible outcomes: this is a market adjusting its internal leadership, not an index-level crisis.
The forward signal to watch is whether the technical breakouts in healthcare, financials, REITs, and consumer staples sustain over the coming weeks. Durability in those moves would strengthen the case for a genuine rotation in market leadership.
For investors with concentrated exposure to high-beta momentum names, BTIG’s estimate of 11%-12% additional downside risk remains a live consideration. Broadening portfolio exposure toward lagging sectors is a practitioner response actively under discussion, not a speculative call.
Investors exploring how to restructure holdings in response to a momentum unwind will find our comprehensive walkthrough of factor portfolio construction, which covers drift-based rebalancing triggers, sector concentration caps, and the specific skill of distinguishing temporary factor underperformance from structural implementation drift, with worked examples that address the kind of positioning decisions now relevant after a crowded momentum trade unwinds.
This article is for informational purposes only and should not be considered financial advice. Investors should conduct their own research and consult with financial professionals before making investment decisions. Past performance does not guarantee future results. Forward-looking estimates, including BTIG’s downside projections, are subject to market conditions and various risk factors.