
Why Bitcoin Failed the Inflation Test Gold Passed in 2022
2 hrs ago

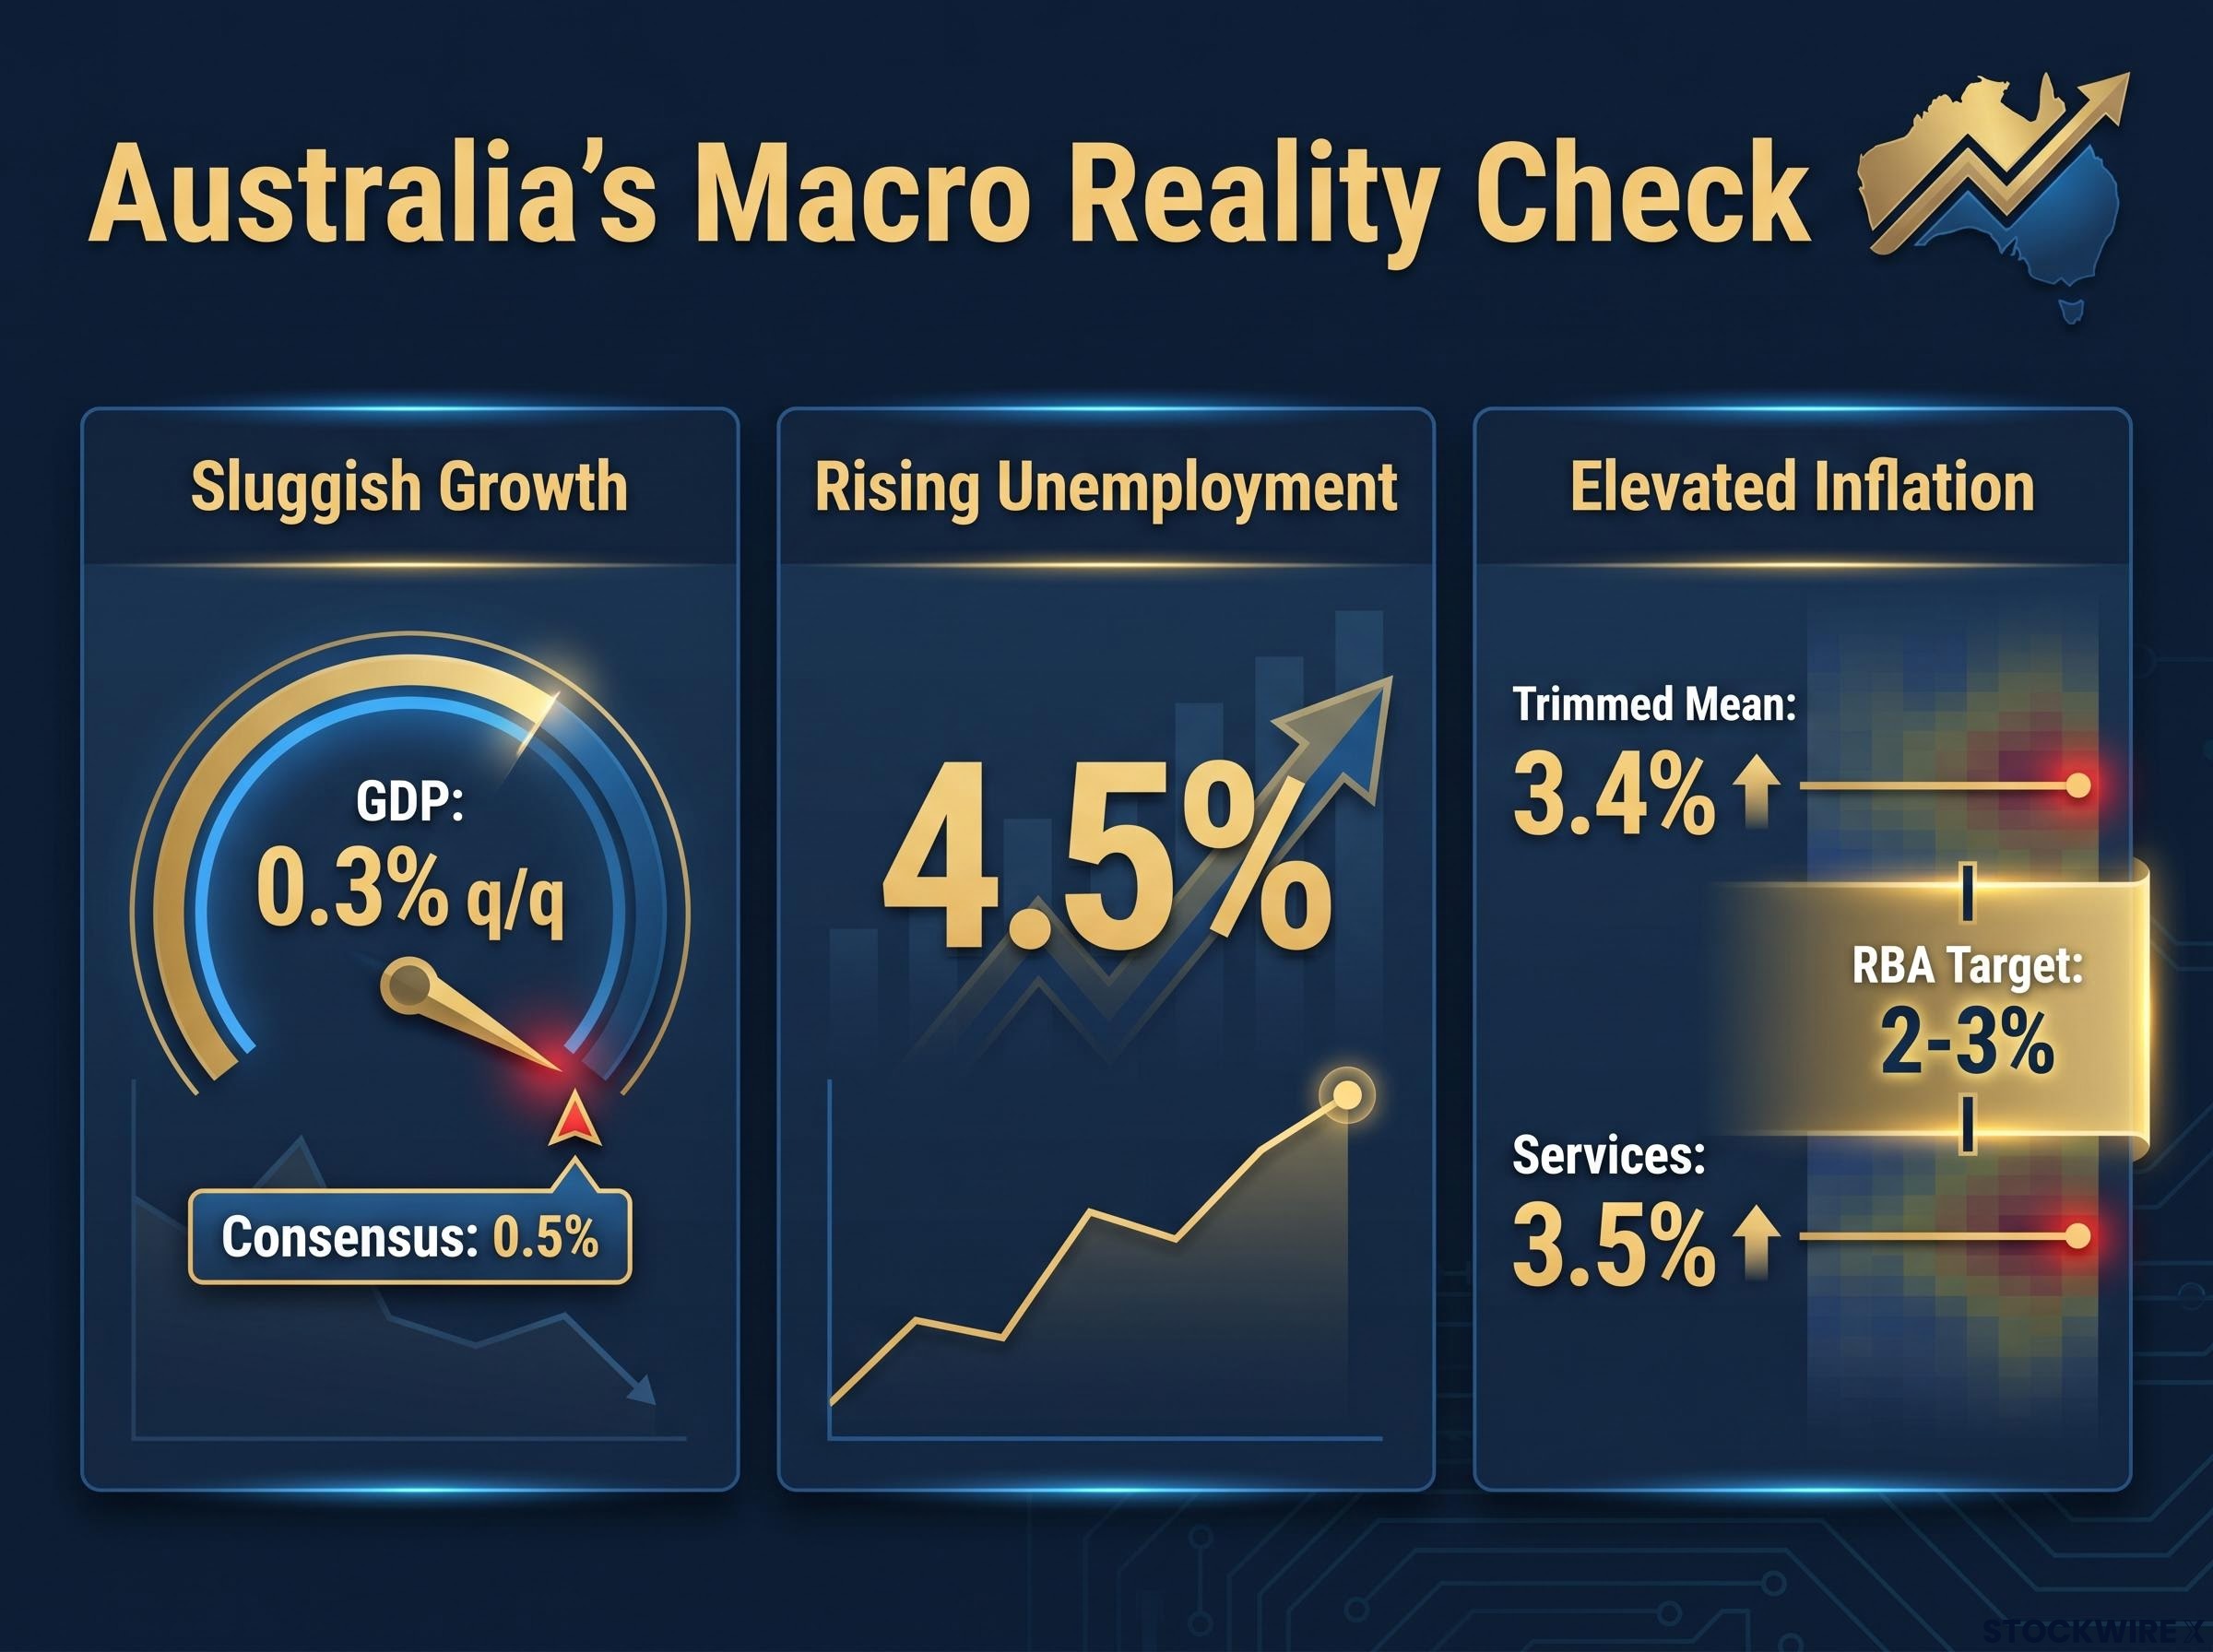
Australia’s unemployment rate hit 4.5% in April 2026, its highest reading since late 2021. In the same month, trimmed mean inflation printed at 3.4% and quarterly GDP growth came in at 0.3%, both below market expectations. All three indicators moved in the wrong direction at the same time.
These data points did not arrive in isolation. The ABS released the labour force figures on 21 May 2026, the inflation data landed days later, and the Q1 2026 national accounts followed on approximately 4 June 2026. Together, they forced a question that Australian markets and policymakers have been reluctant to answer directly: is this stagflation, or just an uncomfortable stretch of below-trend growth? The distinction matters because the policy responses to each are largely incompatible.
The ABS Labour Force release on 21 May 2026 confirmed the unemployment rate at 4.5%, the highest reading since late 2021, alongside national accounts data showing GDP growth of 0.3% in the March quarter, placing both the labour market and output figures below market expectations in the same reporting window.
What follows maps the April to June 2026 data against the defining characteristics of stagflation, examines what credible institutional voices are actually saying, and draws out the practical implications for ASX investors navigating a market where sector positioning now hinges on how this macro story resolves.
The unemployment number came first. The ABS Labour Force release on 21 May 2026 put the April 2026 unemployment rate at 4.5%, up from 4.3% in March and above market forecasts of 4.3%. It was the highest reading since late 2021, confirming that the labour market softening flagged in earlier months was accelerating.
The April 2026 labour force data revealed a gender divergence beneath the headline number: female employment fell by 32,000 across full-time and part-time categories while male employment rose by 13,000, making the composition of the job losses as significant as the aggregate figure for assessing the durability of the trend.
Then came inflation. Headline CPI for April moderated to 4.2% year-on-year, down from 4.6% in March. But the moderation was misleading. A fuel excise reduction, from 52.6 cents to 20.6 cents per litre effective April 2026, artificially suppressed the headline number. The trimmed mean, which strips out these distortions, told a different story.
Trimmed mean inflation printed at 3.4% in April 2026, with services inflation at 3.5%. Both remain firmly above the RBA’s 2-3% target band. This is the cleanest read of underlying price pressure, and it is not falling fast enough.
Finally, the national accounts. Q1 2026 GDP grew 0.3% quarter-on-quarter and 2.5% year-on-year, released approximately 4 June 2026. Consensus had expected 0.5% and 2.7% respectively. The miss confirmed that the economy was losing momentum, not just pausing.
| Indicator | April 2026 reading | Prior period | Market consensus | Direction vs expectation |
|---|---|---|---|---|
| Unemployment rate | 4.5% | 4.3% (March 2026) | 4.3% | Worse than expected |
| Trimmed mean inflation (y/y) | 3.4% | Above RBA target | N/A | Still elevated |
| GDP growth (q/q) | 0.3% | Prior quarter | 0.5% | Below consensus |
Each indicator individually is manageable. Their simultaneous deterioration is what changes the conversation.
Stagflation is not just shorthand for a difficult economy. It describes a specific combination of conditions:
The significance lies not in any one of those conditions but in the policy contradiction their coexistence creates. A standard growth slowdown has a standard remedy. A central bank facing weak output and rising unemployment can cut interest rates, stimulate demand, and wait for the cycle to turn. Stagflation removes that option.
When inflation is simultaneously elevated, cutting rates to support growth risks entrenching price pressures. Tightening to curb inflation risks deepening stagnation and pushing unemployment higher. Neither tool resolves both problems at once.
The RBA, with the cash rate at 4.35%, faces precisely this bind. Its own language describes the task as walking a “narrow path,” a framing that reflects the constraint without naming it directly.
For historical calibration, the 1970s stagflation episode involved double-digit inflation and interest rates well above current levels. Australia’s own early-1980s and early-1990s episodes produced far worse outcomes on both inflation and unemployment. Current conditions are materially milder on standard metrics. But the institutional framework has also changed: the RBA now operates under an explicit inflation-targeting regime, absent in the 1970s, which strengthens its credibility but also constrains its flexibility. The policy challenge is structurally similar even if the severity is not.
The practical implication for investors is specific: the conventional “wait for the RBA to cut” playbook may not apply in a stagflation-risk environment. If the central bank cannot rescue both growth and price stability simultaneously, the rate relief that many portfolios are positioned for may arrive later, or in smaller increments, than the market expects.
The definition is established. The question is how closely Australia’s current data fits it.
On growth, Q1 2026 GDP at 0.3% quarter-on-quarter sits below trend and below consensus. The criterion is met. On unemployment, 4.5% represents the highest reading since late 2021 and exceeded forecasts. The labour market is softening in the direction stagflation requires. On inflation, trimmed mean at 3.4% and services inflation at 3.5% both remain above the RBA’s 2-3% target band. The headline CPI figure of 4.2% is distorted downward by the fuel excise cut, making the core measures the more reliable gauge. The inflation criterion is met.
Per capita output tells a materially different story from the aggregate GDP figure: while Q1 2026 total output grew 0.3% quarter-on-quarter, the per capita measure was negative across the full year to 2025, a distinction that explains why household stress indicators, including consumer confidence and corporate insolvency rates, are tracking at levels associated with far worse headline numbers.
| Stagflation criterion | Definitional requirement | Current Australian reading | Fit assessment |
|---|---|---|---|
| Sluggish growth | Below-trend GDP growth | 0.3% q/q (consensus: 0.5%) | Confirmed |
| Rising unemployment | Labour market deterioration | 4.5% (post-2021 high, above forecast) | Confirmed |
| Elevated inflation | Persistent above-target price growth | Trimmed mean 3.4%, services 3.5% | Confirmed |
The three conditions are present simultaneously. But several factors complicate a definitive verdict. Inflation is trending downward, albeit slowly. Wage growth at 3.4% (per the RBA’s May 2026 snapshot) sits well below the levels that drove 1970s wage-price spirals. Most institutions treat this as a risk scenario rather than a confirmed structural episode.
The RBA’s May 2026 Statement on Monetary Policy projected headline inflation peaking at 4.8% in mid-2026 and flagged that inflation would remain above the 2-3% target range across the forecast horizon, a projection that frames the trimmed mean reading of 3.4% as consistent with the central bank’s own expectations of prolonged above-target price growth.
AMP’s Shane Oliver has described conditions as “not far from a soft form of stagflation,” characterising the environment as “sub-trend growth combined with inflation stuck above the 2-3% target.” This represents some of the most direct institutional language on the stagflation question.
Westpac’s economics team has framed the picture as “below-trend growth and persistent inflation” raising “stagflation concerns,” while the big-four banks and the RBA itself avoid outright declaration. The diagnosis sits somewhere between confirmed risk and structural episode, and where it lands from here depends on the trajectory of the indicators over coming quarters.
Three categories of pressure have converged to produce the current data cluster.
The causal mix matters. A predominantly supply-driven stagflation risk responds differently to policy than demand-driven inflation. Tightening does not easily fix rent or energy costs; easing risks adding demand-pull pressure on top of existing cost-push dynamics.
Supply-side stagflation dynamics respond differently to monetary policy than demand-driven inflation cycles: rate hikes that slow aggregate demand cannot reduce rent costs or repair energy supply chains, which is why cash buffers, short-duration fixed income, and commodity exporters have emerged as the preferred positioning mix when the shock is predominantly cost-push in origin.
The 6.0% minimum wage increase was announced alongside the April 2026 macro data releases, but its impact lags. The cost pressure will filter into Q2 and Q3 2026 business cost structures, particularly for labour-intensive sectors. Hospitality, retail, and care services face the largest margin impact at precisely the moment consumer demand is softening, creating a squeeze from both sides: higher input costs and weaker revenue growth.
The Fair Work Commission’s Annual Wage Review 2026 decision, announced on 2 June 2026, confirmed a 5.97% increase to the National Minimum Wage and a 4.75% increase to modern award minimum rates effective from 1 July 2026, with the cost impact flowing into business expense structures from Q3 2026 onward.
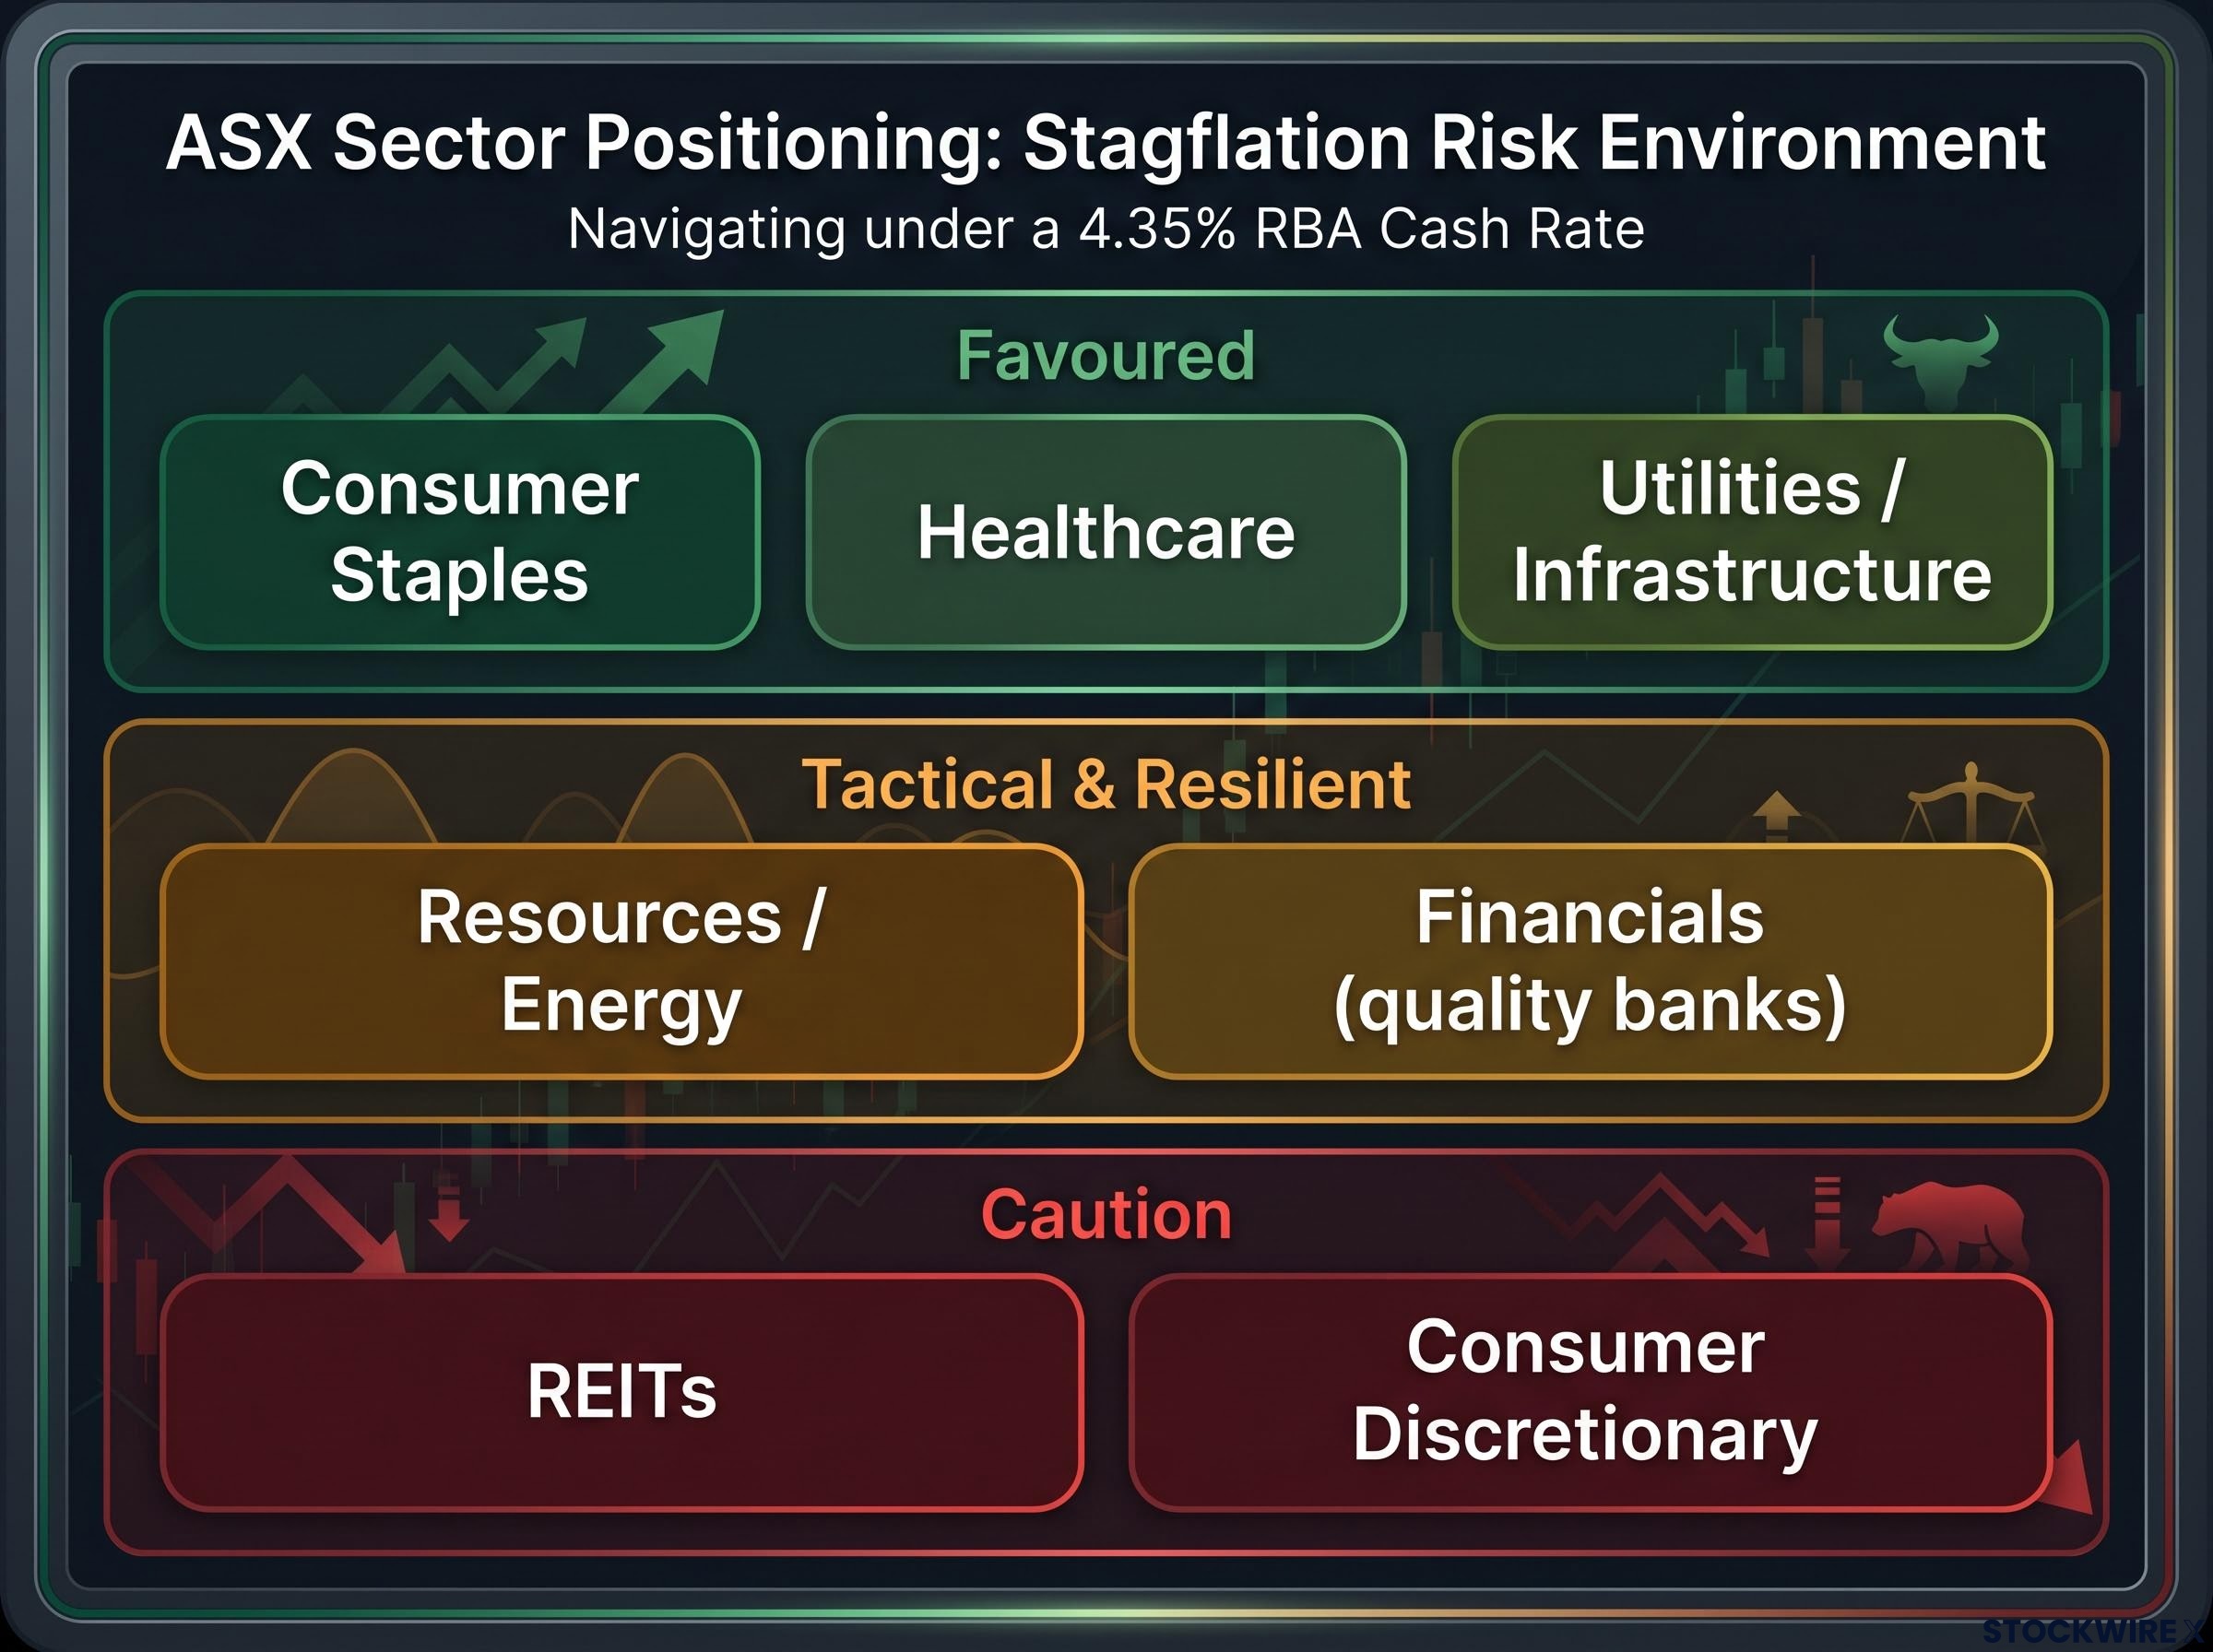
A stagflation-risk backdrop does not apply uniform pressure across the ASX. The investor who can map macro conditions to sector attributes holds a concrete framework for portfolio tilting, even while the macro story remains unresolved.
The RBA cash rate sits at 4.35%, with market pricing via ASX RBA rate indicators suggesting limited near-term cuts. This rate remains the central constraint shaping sector positioning across the board.
| Sector | Positioning signal | Rationale | Key risk to the call |
|---|---|---|---|
| Consumer staples | Relatively favoured | Earnings visibility, demonstrated pricing power | Volume declines if consumer weakness deepens |
| Healthcare | Relatively favoured | Global demand drivers, low local cycle sensitivity | Regulatory or funding changes |
| Utilities / infrastructure | Relatively favoured | Regulated cashflows, inflation-indexed revenues | Rising capital costs on new projects |
| Resources / energy | Tactical consideration | Commodity prices hedge stagflation if global supply tight | Chinese demand disappointment |
| REITs | Caution warranted | Higher discount rates, refinancing pressure | Earlier-than-expected rate cuts |
| Consumer discretionary | Caution warranted | Household income pressure, rising unemployment | Sentiment recovery or fiscal stimulus |
| Financials (quality banks) | Relatively resilient | Well-capitalised, net interest margin support | Rising bad debts, margin compression |
Defensives, specifically consumer staples, healthcare, and utilities, carry the attributes that matter most in this environment: earnings visibility, pricing power, and low sensitivity to the local rate and consumer cycle. Resources offer a tactical hedge when global supply constraints or external demand support commodity prices, but cyclical miners tied to domestic construction face a more complex outlook.
Rate-sensitive names, including REITs, consumer discretionary, and high price-to-earnings growth stocks, require the most caution. With rate cuts priced as a 2026-2027 story at best, relief for these sectors remains distant.
The question of whether Australia’s current episode is a temporary convergence of unfavourable indicators or the beginning of something more durable will be answered by three forward-looking variables:
Australia’s terms of trade provide a partial buffer. If commodity prices remain supported by global supply constraints or sustained Chinese demand, the revenue flow from bulk exports cushions the domestic slowdown and supports the federal budget position.
That buffer is not guaranteed. A Chinese demand disappointment would remove the commodity cushion and compound the domestic slowdown, adding a second adverse force to an already strained growth picture. The domestic and global risk factors operate on different timelines and through different channels, but a simultaneous deterioration in both would materially narrow the RBA’s already constrained path.
Stagflation is a specific policy-trap condition, not a synonym for a difficult economy. Australia’s April to June 2026 data cluster meets the definitional criteria to a degree that warrants systematic attention rather than dismissal. No mainstream institution has declared outright stagflation, but the risk framing has moved from the periphery to the centre of market commentary.
The forward-looking framework is clear: trimmed mean inflation, the unemployment trajectory, and RBA decisions are the three data points that will determine whether this episode is transient or something more persistent. Defensives and inflation-aware positioning remain the most defensible posture until core inflation durably returns toward the 2-3% band.
The investor who waits for a consensus declaration before adjusting will likely be acting on information that the market has already priced.
For investors reconsidering their sector exposure in light of the stagflation-risk backdrop, our dedicated guide to ASX portfolio diversification examines how the structural concentration of the S&P/ASX 200 in financials and materials (approximately 52% of the index) amplifies domestic macro risk, and how international ETFs such as VGS and IVV can be used to access the technology, healthcare, and consumer sectors that the local index structurally under-represents.
This article is for informational purposes only and should not be considered financial advice. Investors should conduct their own research and consult with financial professionals before making investment decisions. Past performance does not guarantee future results. Financial projections are subject to market conditions and various risk factors.
Stagflation describes the simultaneous occurrence of sluggish economic growth, rising unemployment, and elevated inflation, creating a policy trap where central banks cannot cut rates to support growth without risking further price pressure, unlike a standard recession where rate cuts are the conventional remedy.
The April 2026 data showed unemployment rising to 4.5% (the highest since late 2021), trimmed mean inflation holding at 3.4% above the RBA's 2-3% target band, and Q1 2026 GDP growth coming in at just 0.3% quarter-on-quarter, all three indicators missing market expectations simultaneously.
With the RBA cash rate at 4.35% and the central bank constrained from cutting aggressively while inflation remains above target, rate-sensitive sectors including REITs and consumer discretionary face prolonged pressure, while defensives such as consumer staples, healthcare, and utilities are better positioned for earnings resilience.
Consumer staples, healthcare, and utilities are considered relatively favoured during stagflation risk conditions due to their earnings visibility, pricing power, and low sensitivity to domestic rate and consumer cycles, while resources offer a tactical hedge if global commodity prices remain supported.
The Fair Work Commission announced a 5.97% increase to the National Minimum Wage and a 4.75% increase to modern award rates effective 1 July 2026, with the cost impact flowing into business expense structures from Q3 2026 onward, placing particular pressure on labour-intensive sectors like hospitality, retail, and care services.