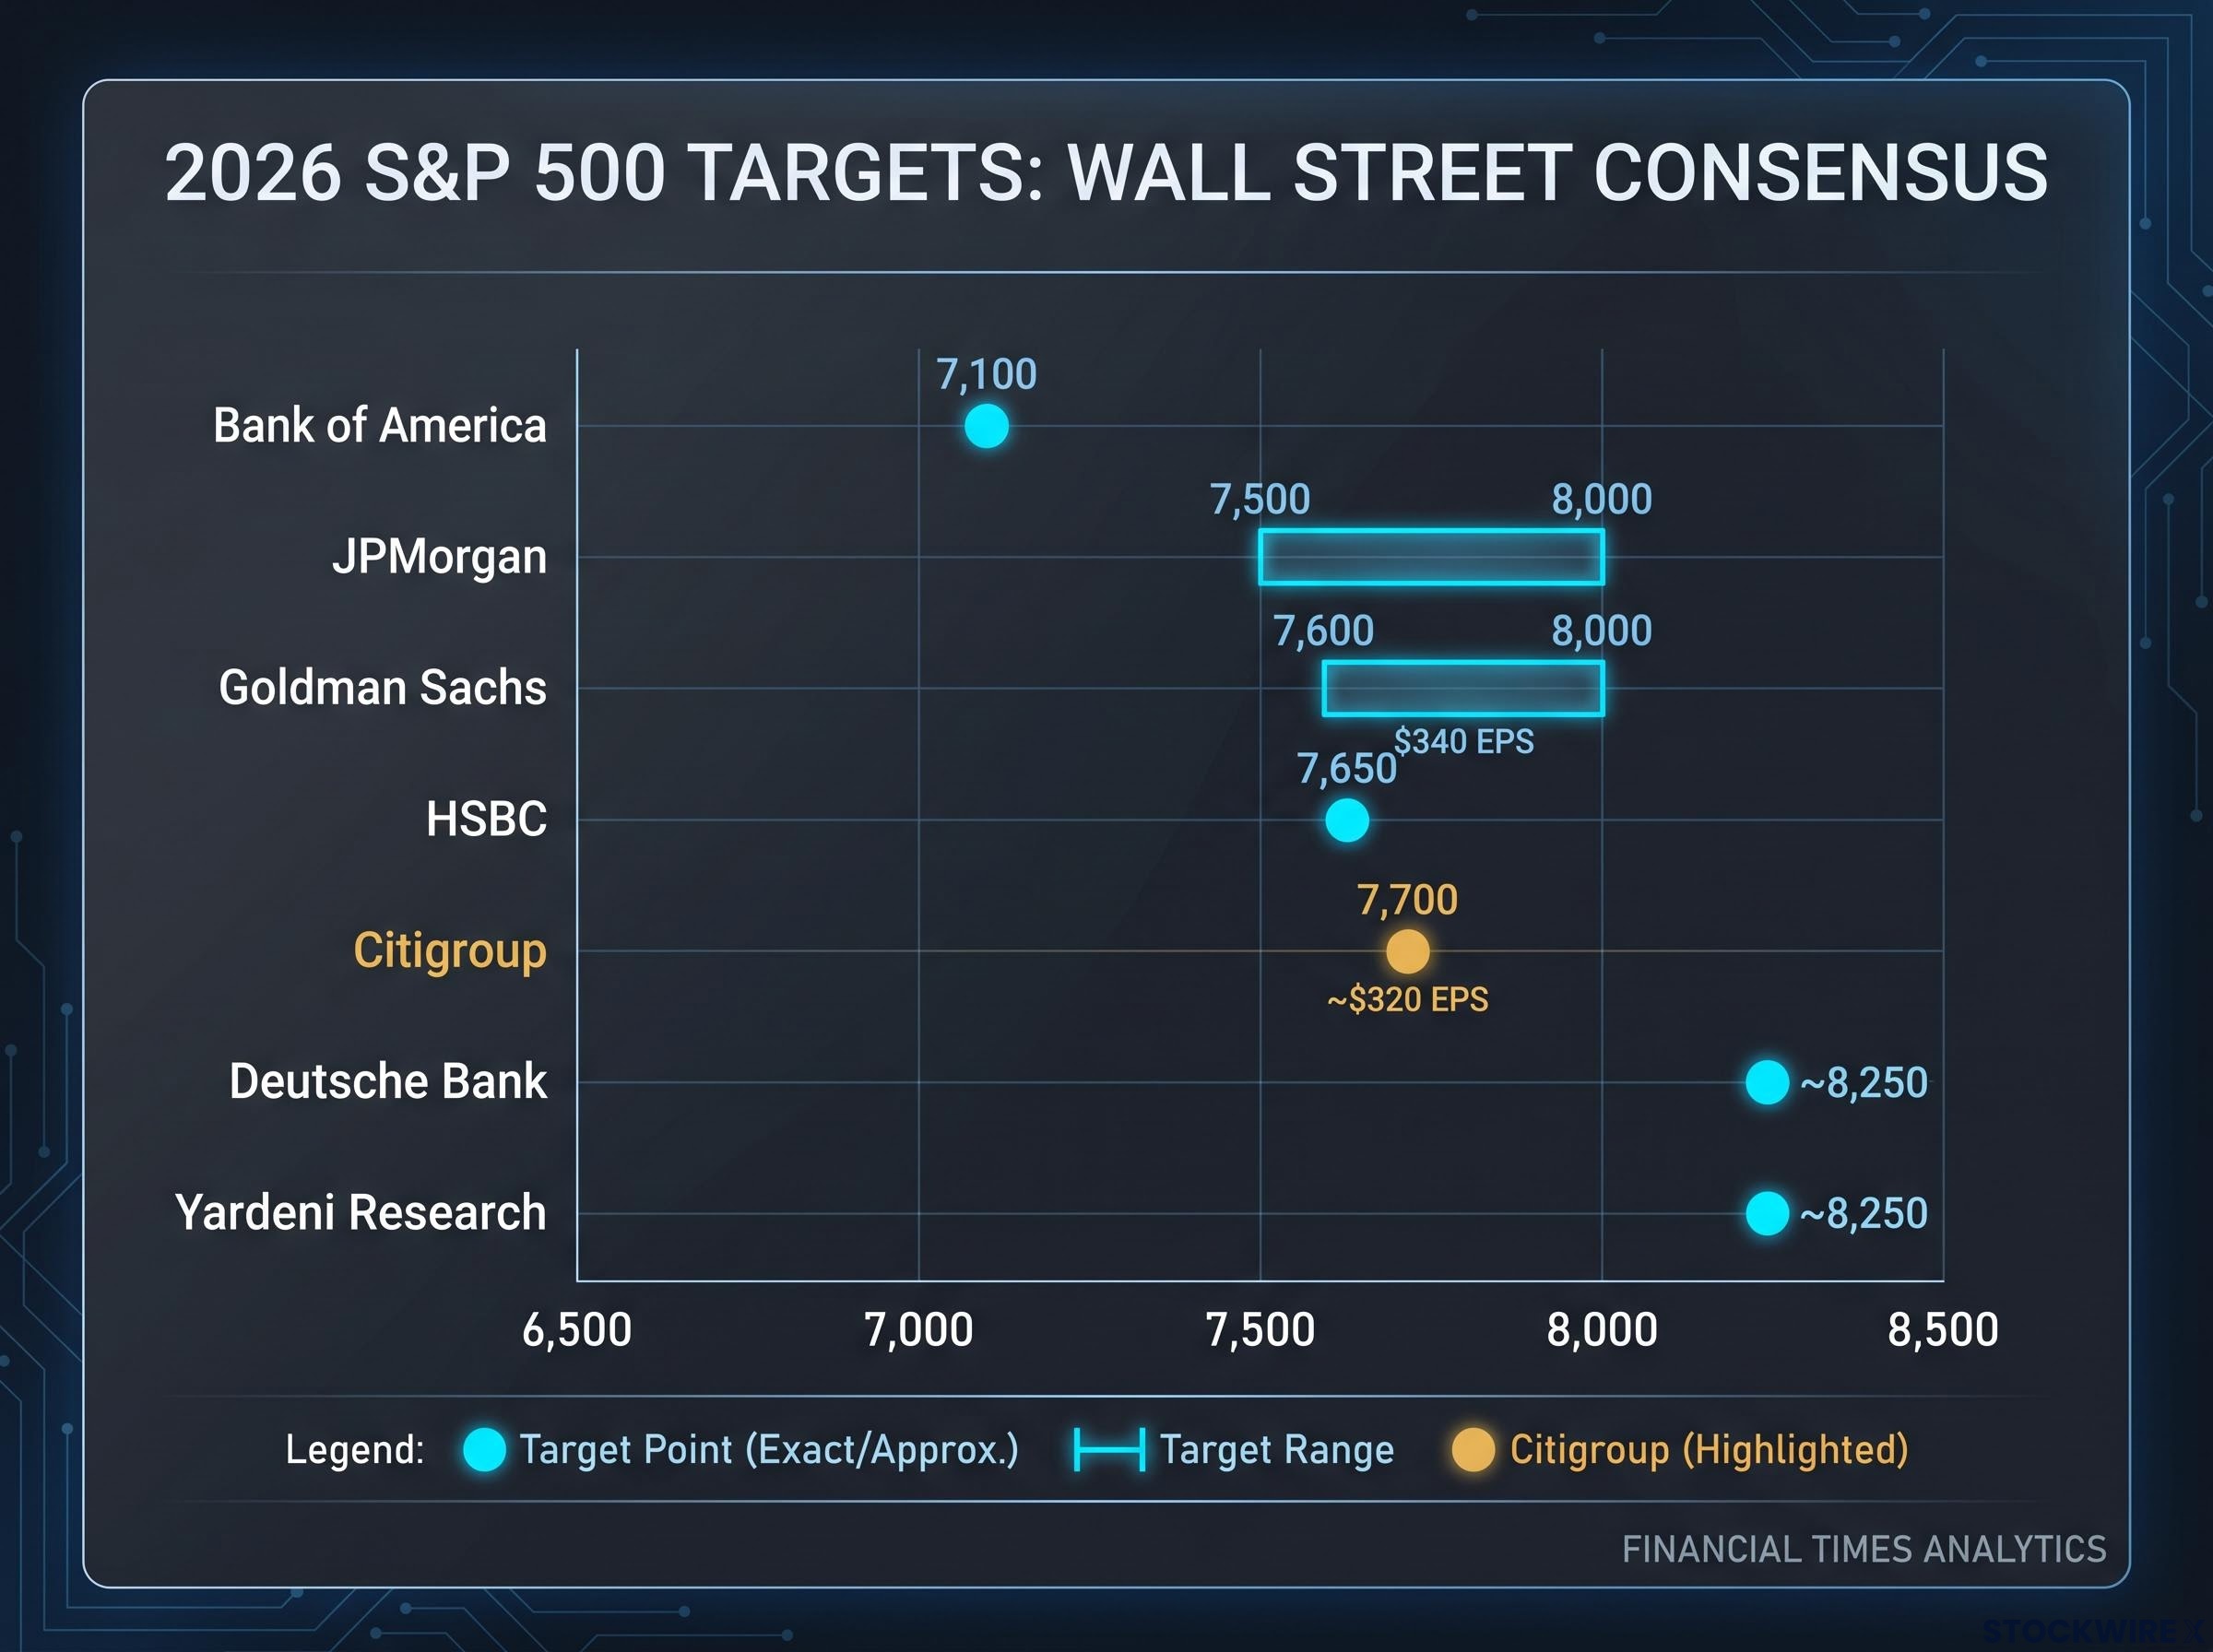
Citigroup’s equity strategist Scott Chronert has held his year-end 2026 S&P 500 target at 7,700, but the reasoning behind the number carries more weight than the number itself. The bull case rests entirely on corporate earnings delivery, with no help expected from expanding valuation multiples. As of early June 2026, the S&P 500 is trading near the 7,100-7,200 range, with Wall Street targets clustering between 7,500 and 8,250 across major firms. What separates the Citigroup call is not its level but its logic: Chronert’s framework explicitly builds in multiple compression as the AI capital expenditure supercycle matures, requiring actual profit growth to carry the index to its destination. What follows unpacks the analytical architecture behind the 7,700 target, examines the shifting earnings composition of the S&P 500, and assesses whether the structural optimism embedded in Wall Street’s outlook is defensible.
Citigroup’s 7,700 call puts all the weight on corporate earnings
Chronert published the 7,700 year-end target on 6 June 2026, and the most notable feature of the call is what it excludes. There is no assumption that investors will pay a higher price per dollar of earnings over the next six months. The model builds in price-to-earnings compression as a headwind, meaning the index has to earn its way to the target rather than ride sentiment higher.
Chronert’s core thesis: Future index gains depend on actual earnings performance rather than speculative momentum, with multiple expansion explicitly removed as a contributor to returns.
Citigroup’s 2026 earnings-per-share projection of approximately $320 sits below the broader sell-side consensus range of $336-$340. That gap matters. Even with a lower earnings assumption, the 7,700 target implies roughly 7-8% upside from current levels, supported by three structural pillars:
- Earnings growth acceleration through the second half of 2026
- Trailing P/E multiple compression as the AI expansion cycle matures
- A structural thesis about AI infrastructure spending reshaping how the index generates profits
The call is conditional, not directional. It works if earnings deliver. It has no backup plan if they do not.
When big ASX news breaks, our subscribers know first
Where Citi stands in a crowded field of Wall Street forecasts
At 7,700, Citigroup’s target lands near the middle of the pack. The average across major firms sits around 7,550-7,650, making the headline number roughly consensus-level. The differentiation is underneath, in the earnings assumptions.
Goldman Sachs projects 2026 EPS at $340 with 24% growth, nearly $20 per share above Citigroup’s estimate. That gap reflects different methodological frameworks rather than a simple disagreement about market direction; Goldman’s model assumes stronger monetisation of AI infrastructure spending, while Chronert’s builds in more conservative conversion rates.
| Firm | 2026 Target | EPS Estimate | Implied Growth |
|---|---|---|---|
| Citigroup | 7,700 | ~$320 | ~15-17% |
| Goldman Sachs | 7,600-8,000 | $340 | 24% |
| HSBC | 7,650 | Revised +8% | ~18-20% |
| JPMorgan | 7,500-8,000 | Consensus range | ~15-20% |
| Bank of America | 7,100 | Below consensus | Conservative |
The real question for investors is not whether they believe in 7,700 or 8,000. It is whether they believe earnings can hit $320 or $340, because that judgment determines whether any 2026 target is realistic.
Bank of America’s 2026 framework represents the sharpest challenge to the consensus earnings narrative: the firm raised its EPS estimate to $335 while holding its year-end price target at 7,100, a deliberate signal that the expected earnings growth is already priced into current valuations on 16 of 20 internal valuation metrics, with the forward P/E sitting approximately 20% above its 10-year historical average.
What a capex supercycle actually means for index-level earnings
The phrase “AI capex supercycle” appears frequently in strategist notes, but the mechanics behind it are what make Chronert’s framework specific rather than thematic.
A supercycle, as Chronert uses the term, is distinct from a conventional economic cycle. It describes a sustained, concentrated infrastructure buildout that reshapes earnings composition across sectors, not one that simply amplifies existing cyclical dynamics.
Chronert characterised the current technology environment as “a distinctive capital expenditure supercycle rather than a conventional economic cycle,” with the market having likely entered the midpoint of this structural transition.
The chain from infrastructure spending to index-level earnings works through three stages:
- Hyperscaler capex deployment: Four companies commit hundreds of billions to AI compute, data centres, and physical infrastructure
- Supplier and ecosystem earnings: Semiconductor manufacturers, cloud service providers, networking firms, and energy suppliers capture revenue from the buildout
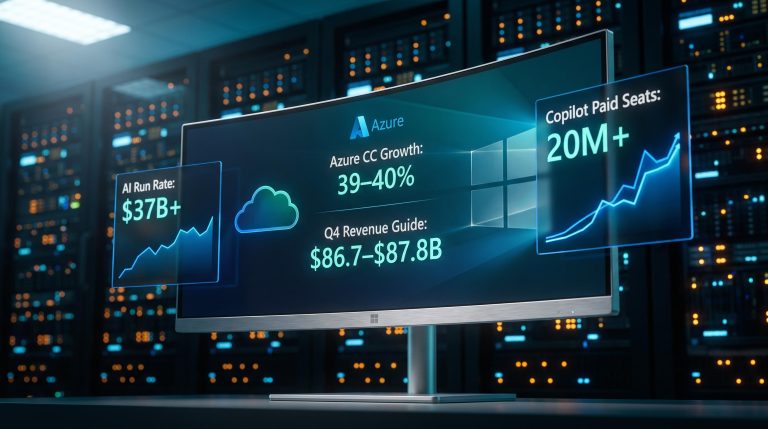
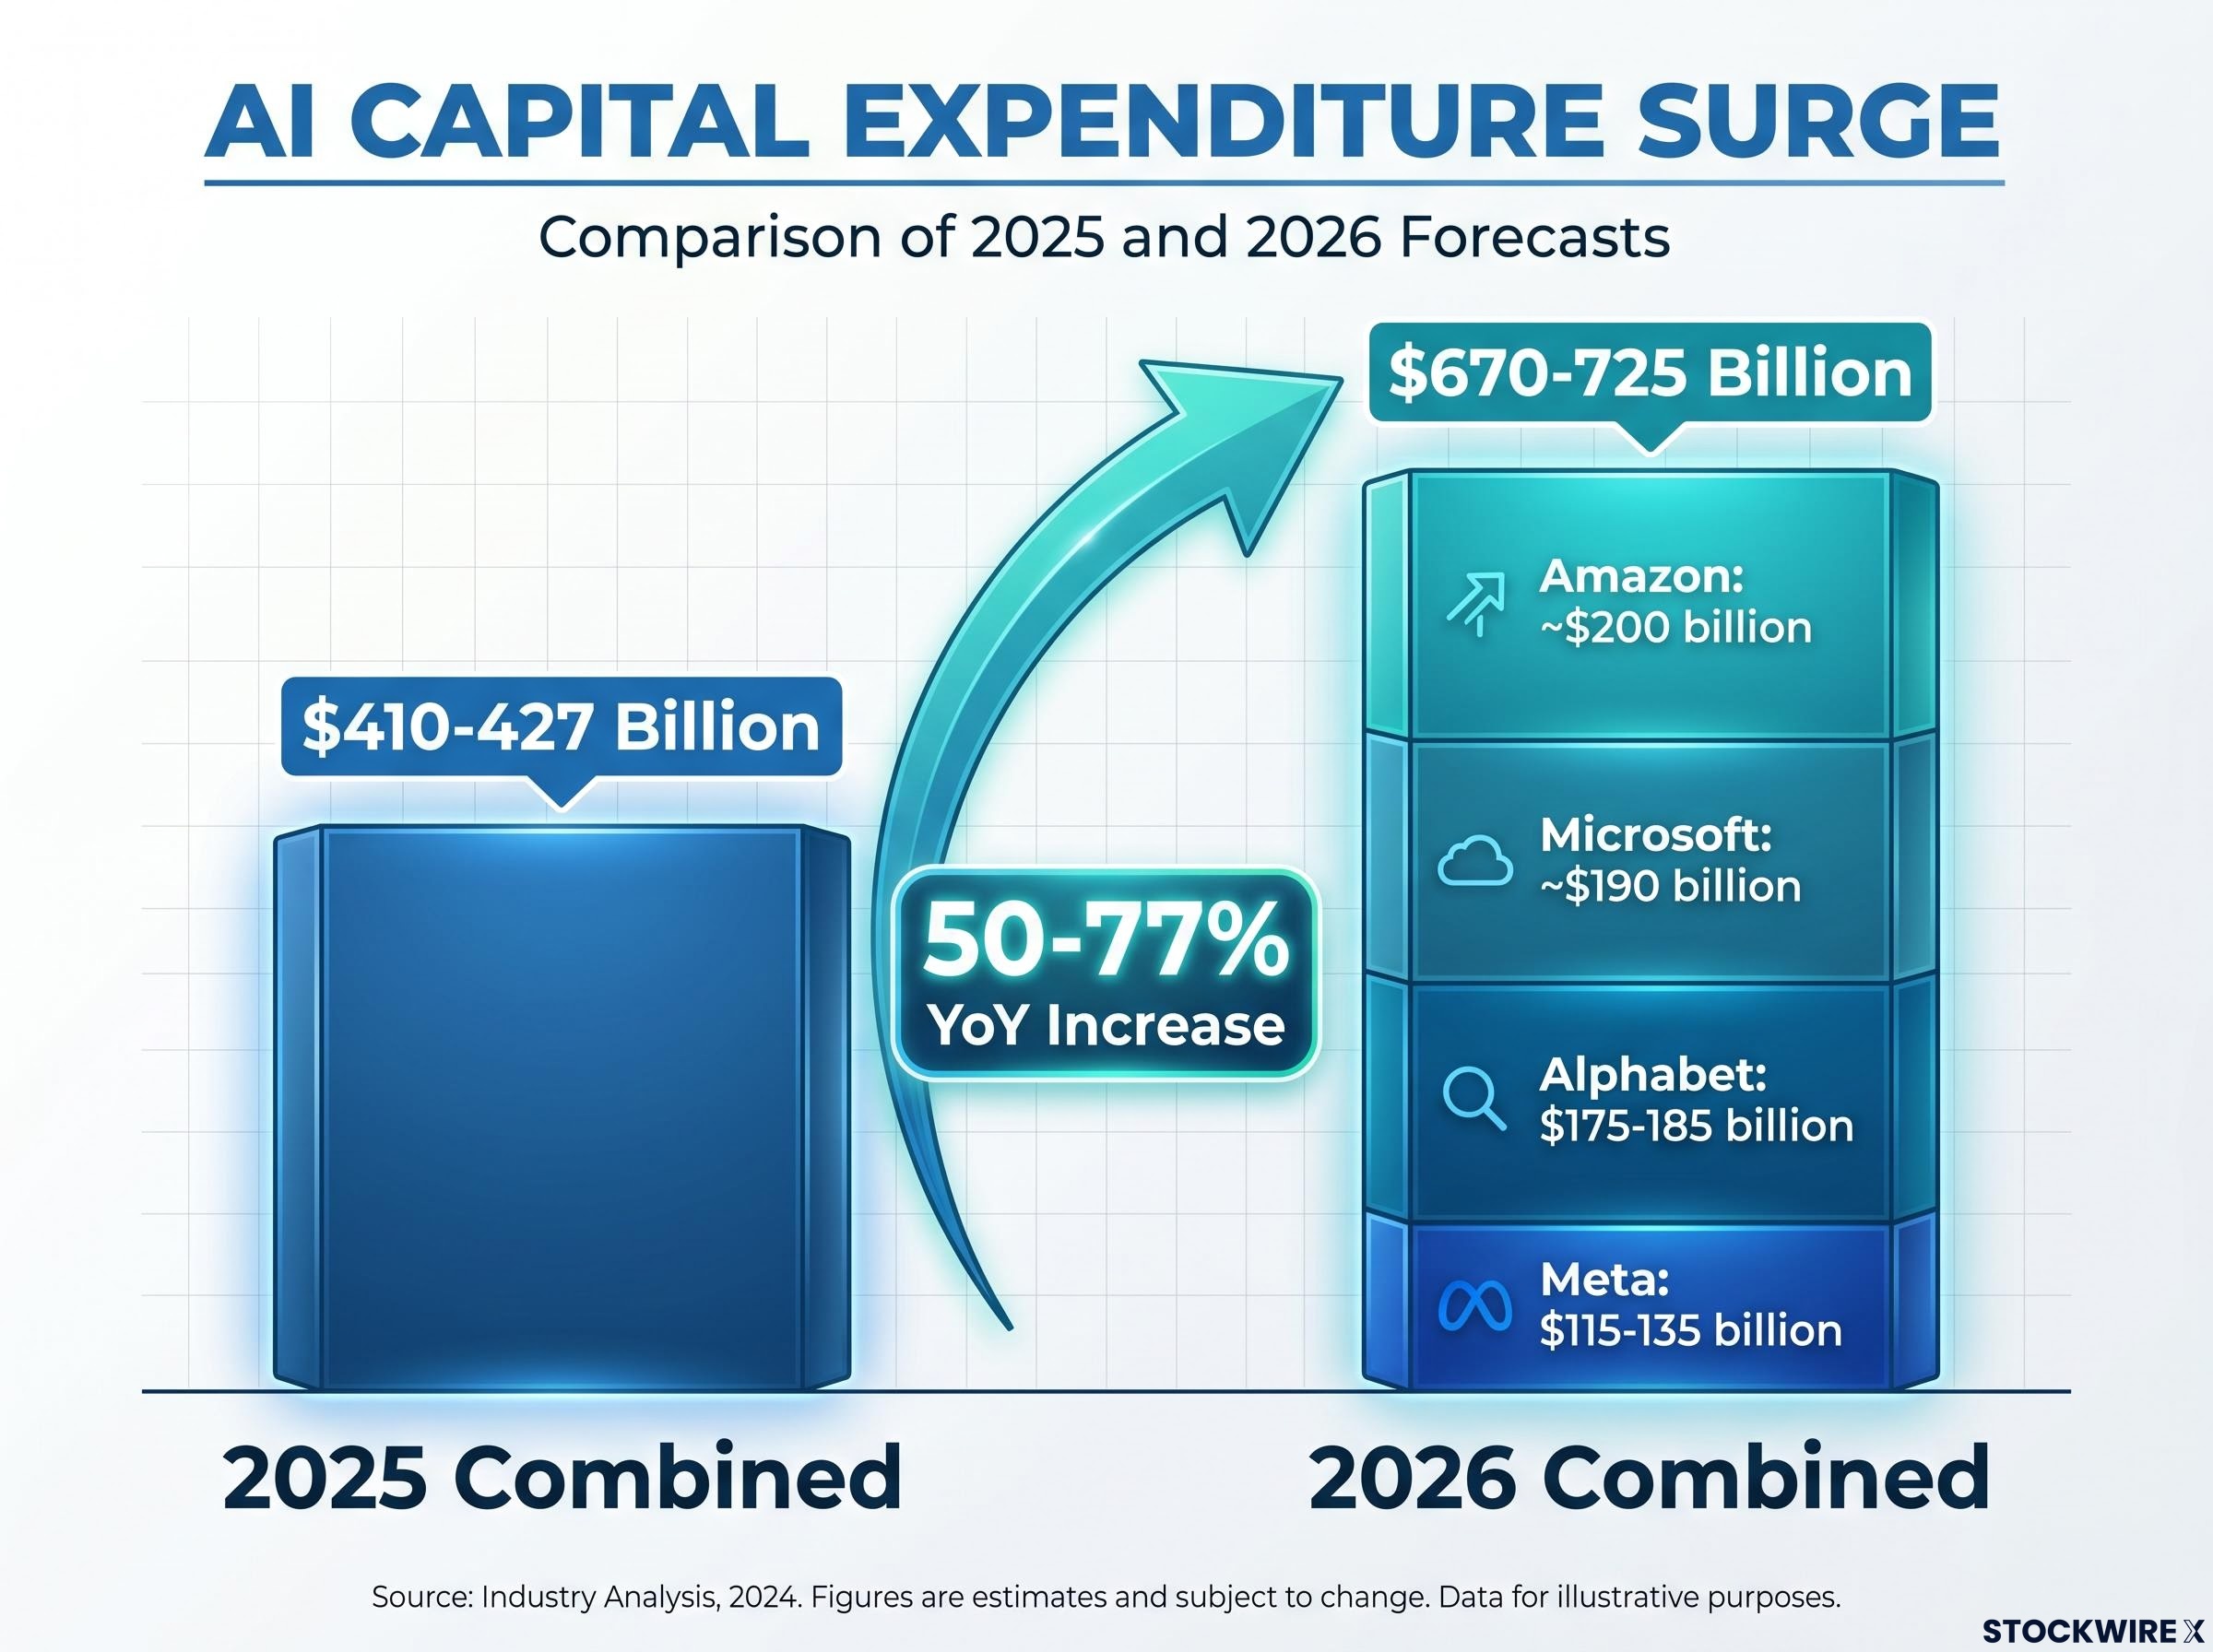
- Index-level EPS uplift: Growth-sector earnings now represent 45% of total S&P 500 earnings, according to Citigroup, meaning the AI infrastructure cycle is a first-order driver of the index, not a sector-specific story
That 45% figure, up from approximately 15% three decades ago, explains why AI capital spending has moved from a thematic investment narrative to a structural determinant of whether the S&P 500 hits its targets.
The four companies reshaping the index’s earnings profile
The scale of individual commitments underscores the concentration. Amazon is guiding for approximately $200 billion in 2026 capital expenditure. Microsoft follows at roughly $190 billion, Alphabet at $175-185 billion, and Meta at $115-135 billion.
Combined, these four firms are guiding for approximately $670-725 billion in 2026, up from roughly $410-427 billion in 2025. That represents a 50-77% increase year on year, and the acceleration is the foundation Chronert’s midpoint thesis depends on continuing.
Why multiple compression changes the math for investors
Chronert’s framework is not naive about valuation. The 7,700 target exists alongside an explicit assumption that the market will pay fewer dollars per dollar of earnings as the AI cycle matures, a dynamic known as multiple compression.
As of early June 2026, the trailing twelve-month P/E ratio sits near 25.73 and the forward twelve-month P/E near 22.21, both above the five-year average in the low 20s. These levels leave limited room for valuation expansion to contribute to returns, and Chronert’s model treats them as a ceiling rather than a floor.
The FactSet Earnings Insight report dated 5 June 2026 placed the forward 12-month P/E ratio at 21.1, above the five-year average of 19.9 and the ten-year average of 19.0, confirming that current valuations already embed a meaningful premium relative to historical norms.
The compression risk factors are specific:
Debt-funded capex sustainability is a specific concern the numbers raise directly: hyperscalers issued approximately $121 billion in debt in 2025, roughly four times their five-year average, with a further $100 billion projected in 2026, adding a financing layer to the return-on-investment question that Chronert’s model builds in as a compression risk.
- Uncertainty around the return on investment from AI infrastructure spending at this scale
- Potential bottlenecks in power supply and physical infrastructure needed to support data centre expansion
- The volume of debt-financed capex requiring demonstrable returns beyond the buildout phase itself
- A monetisation lag between infrastructure deployment and revenue generation, particularly for longer-dated infrastructure plays compared to software firms with shorter monetisation timelines
The core vulnerability is straightforward. If earnings growth of the magnitude Chronert projects does not materialise, there is no valuation cushion. The model has already excluded multiple expansion as a support mechanism, meaning a miss on earnings faces compounding headwinds rather than a safety net.
Chronert’s midpoint diagnosis and what it means for the road ahead
The most analytically specific element of Chronert’s 6 June note is the cycle positioning. Based on corporate fundamentals and price movement, he assessed that the market has likely entered the midpoint of the AI capex supercycle. That placement carries direct implications for what drives returns from here.
Early-cycle dynamics, characterised by multiple expansion as investors price in the potential of a new structural theme, are largely behind the market. The transition to mid-cycle shifts the burden to earnings delivery. The distinction matters: multiple expansion rewards conviction; earnings delivery rewards execution.
With growth-sector earnings now representing 45% of total index profits (up from 15% roughly three decades ago), the composition of the S&P 500 has changed enough that the AI capex cycle is not a side story. It is the central variable. For the 7,700 target to be achievable, the 2026 earnings outlook needs to hold, and the earnings contribution from AI-linked sectors needs to sustain or accelerate its share.
Q1 2026 earnings delivery provided the first concrete evidence of whether the elevated bar was achievable: the quarter produced an 84% S&P 500 EPS beat rate and blended earnings growth of 27.7% year on year, the strongest quarterly result in four years, with revision breadth accelerating sharply as 22% of estimates were revised upward against only 5% downgraded.
Meaningful runway remains in Chronert’s assessment. But the analytical work of distinguishing between durable earnings growth and infrastructure spending that has yet to monetise becomes the defining exercise from this point forward.
An earnings-driven thesis in a market where the stakes just got higher
Citigroup’s 7,700 target is structurally coherent. It rests on a documented earnings composition shift, a quantified capex cycle, and a model that openly accounts for its own valuation headwind. It is also more fragile than the headline number suggests, because every pillar of the thesis requires earnings execution rather than sentiment or momentum.
The broader Wall Street consensus reinforces the same dependency. With major firms clustered in the 7,500-8,000+ range and EPS assumptions running from $320 (Citigroup) to $340 (Goldman Sachs), the range of outcomes in 2026 will be determined almost entirely by whether corporate earnings, particularly in growth sectors, meet the elevated bar already embedded in prices. The widest target spread, from Bank of America’s 7,100 to levels near 8,250 from Deutsche Bank and Yardeni Research, reflects disagreement about execution, not direction.
Three variables deserve monitoring through the second half of 2026:
The rate sensitivity of the bull case is a constraint Chronert’s framework does not foreground but HSBC identified precisely: its analysis placed the 10-year Treasury yield within 9 basis points of the 4.5% threshold where AI capex spending becomes most sensitive to financing costs, making yield direction a co-equal variable alongside earnings delivery for any target in the 7,600-8,000 range.
- Quarterly EPS delivery against the $320-$340 consensus range
- Hyperscaler capex return-on-investment signals from earnings calls and capital allocation updates
- Forward P/E trajectory relative to current levels near 22
The second half earnings season will be the empirical test of whether the AI supercycle is delivering the profit growth that makes these targets defensible.
This article is for informational purposes only and should not be considered financial advice. Investors should conduct their own research and consult with financial professionals before making investment decisions. Forward-looking statements, including price targets and earnings projections, are subject to change based on market developments and company performance.