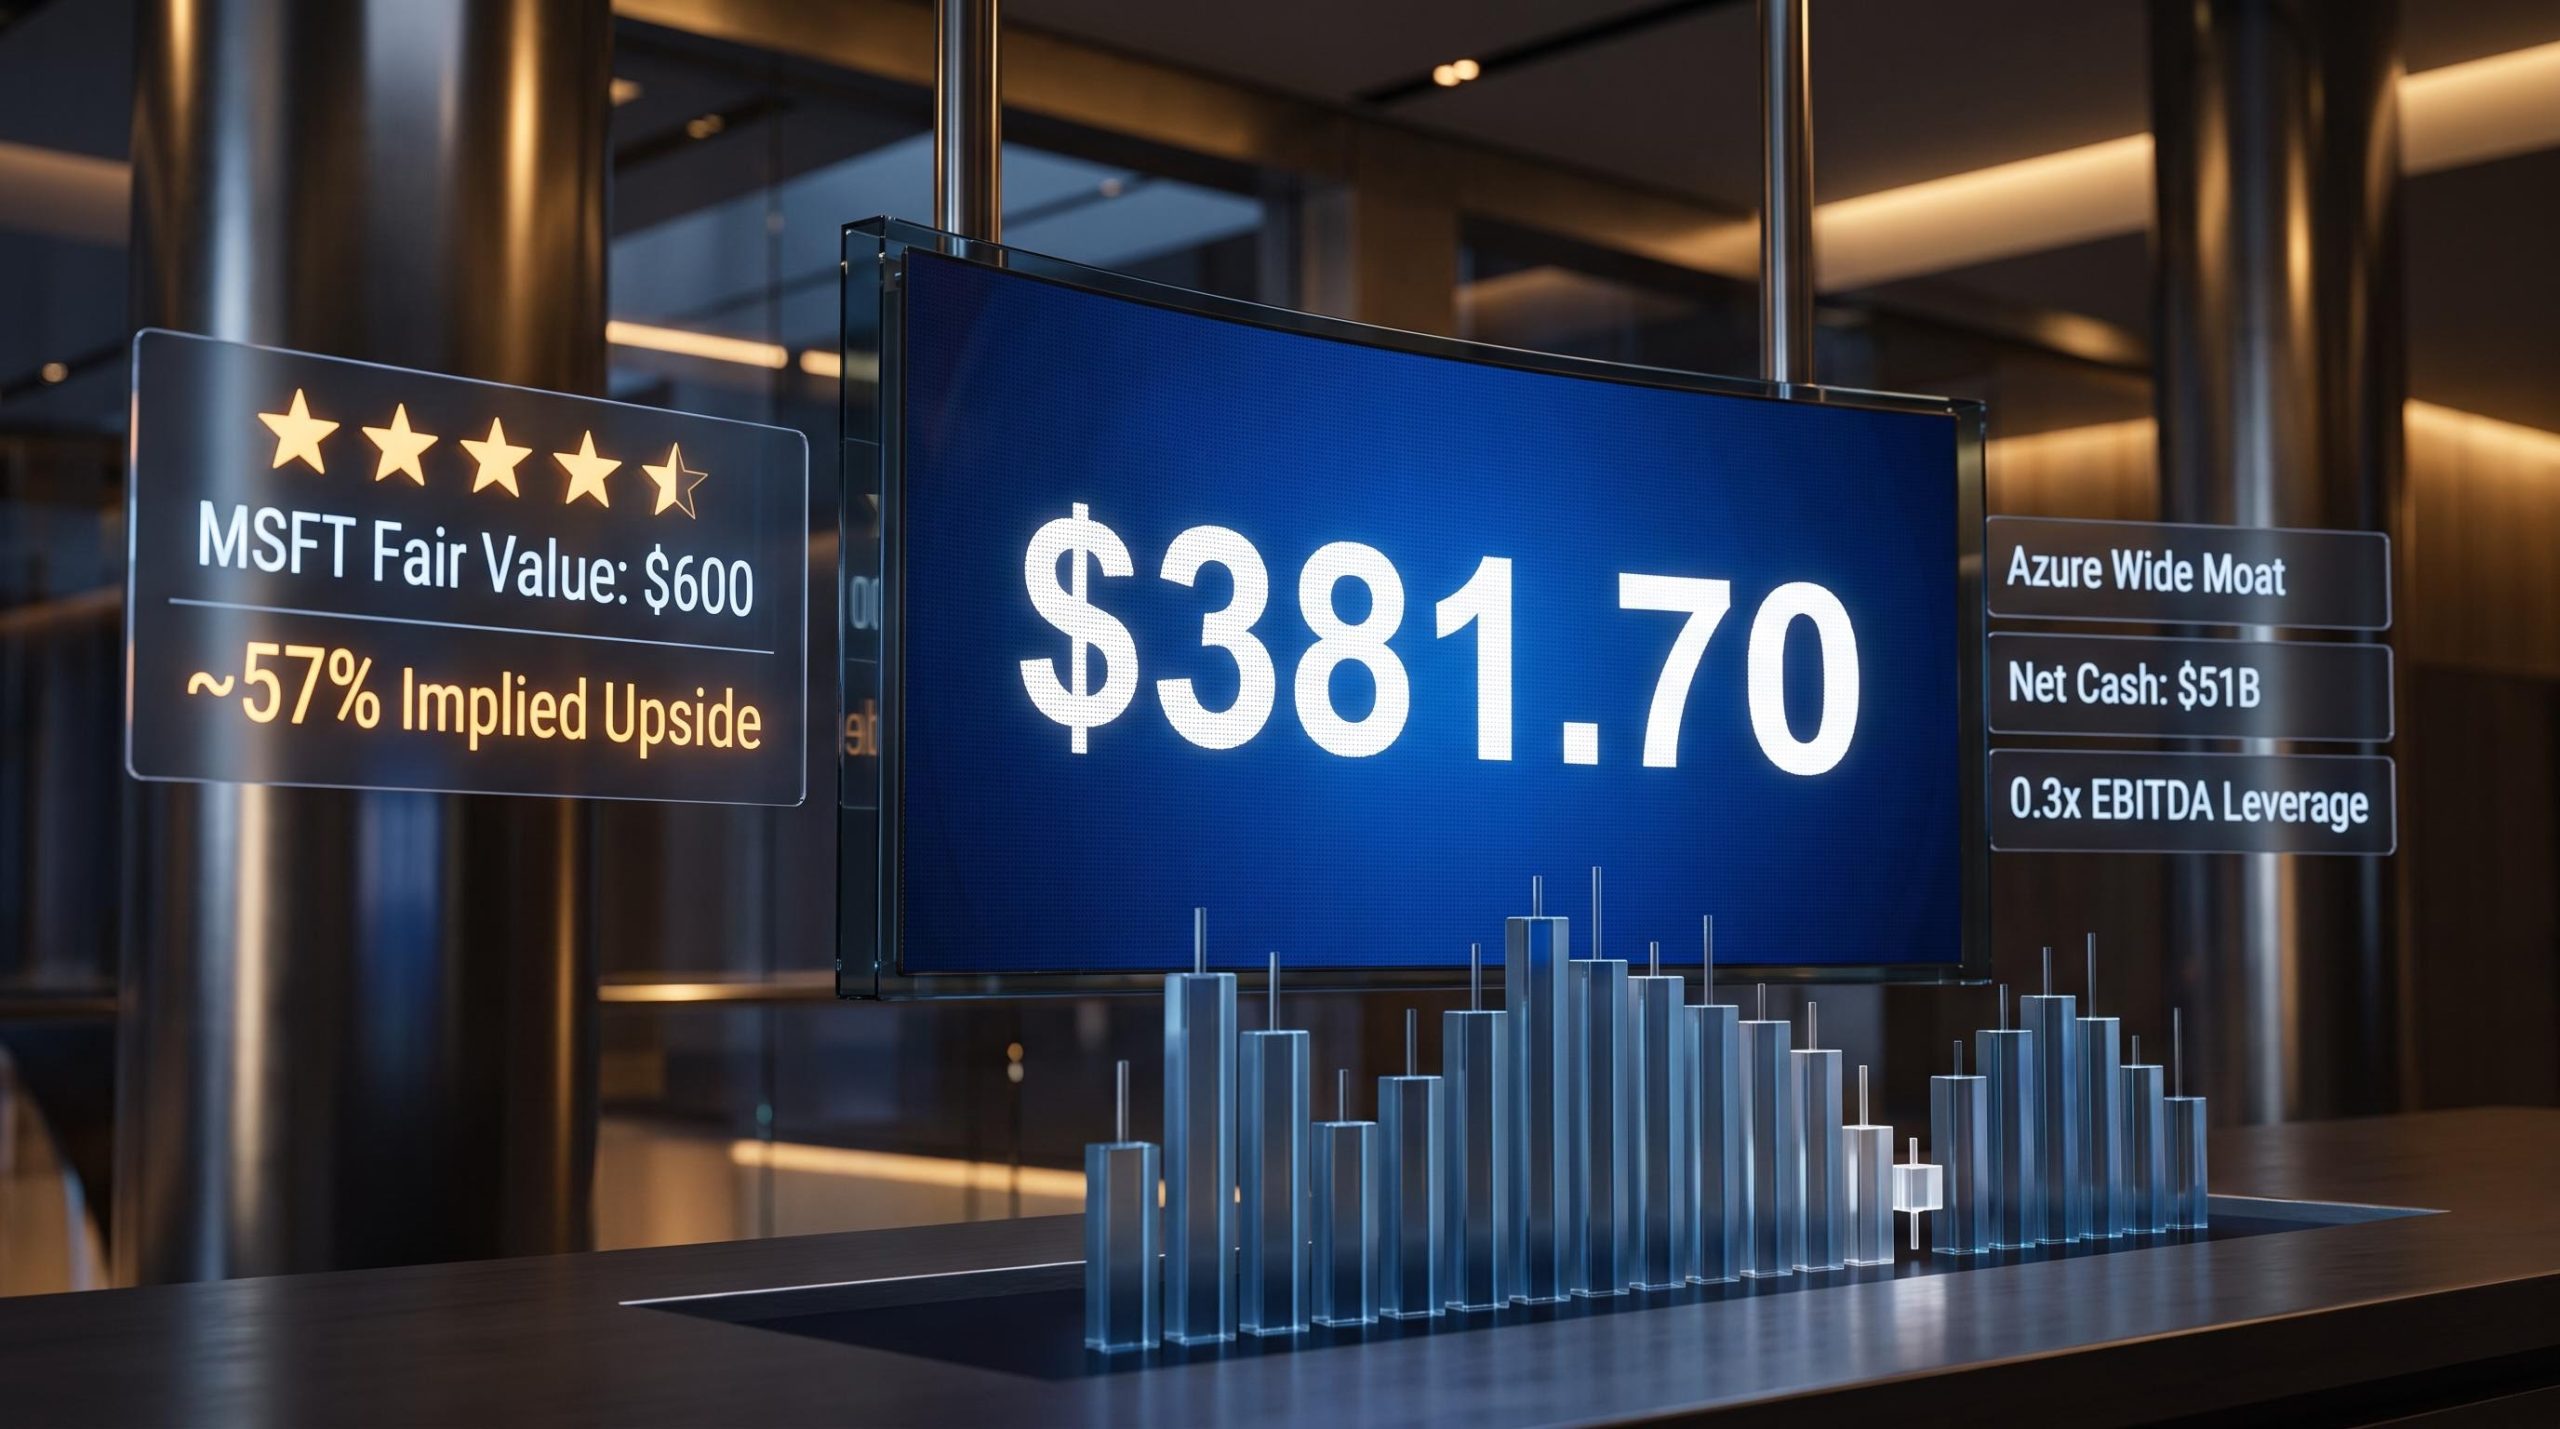
Microsoft is a $2.9 trillion company that the majority of Wall Street rates a Strong Buy. Morningstar’s five-star assessment implies roughly 57% upside from current prices. And yet the stock has quietly shed more than a third of its value from its 52-week high.
That gap between quality and price is the entire story here. As of late July 2026, MSFT trades in the low-to-mid $380s, well below Morningstar’s $600 fair value estimate and a significant discount to the Wall Street consensus target range of $555 to $590. The pullback is not rooted in deteriorating fundamentals. It reflects sector-wide multiple compression, anxieties around the scale of AI capital expenditure, and macro pressure on long-duration growth assets. The practical question facing any investor looking at this stock is whether those concerns are priced in or whether they represent real threats to the thesis.
Here is a clear framework for evaluating that question: where the valuation discount actually comes from, what the moat is built on and how durable it is, how the balance sheet shapes the risk profile, and what specific variables you should be watching before making a decision.
A stock trading at a 36% discount to fair value, and what that actually means
Start with the arithmetic. Microsoft closed at approximately $381.70 on 24 July 2026, against a 52-week range of $349.20 to $555.45. Morningstar’s fair value estimate, published on 17 July 2026 by Dan Romanoff, Senior Equity Research Analyst, sits at $600 per share with a five-star rating and a Medium Uncertainty designation. That combination, the highest star rating paired with only medium uncertainty, signals conviction adjusted for risk, not a speculative call.
Morningstar’s target is not an outlier. It sits at the upper end of a tight mainstream analyst band.
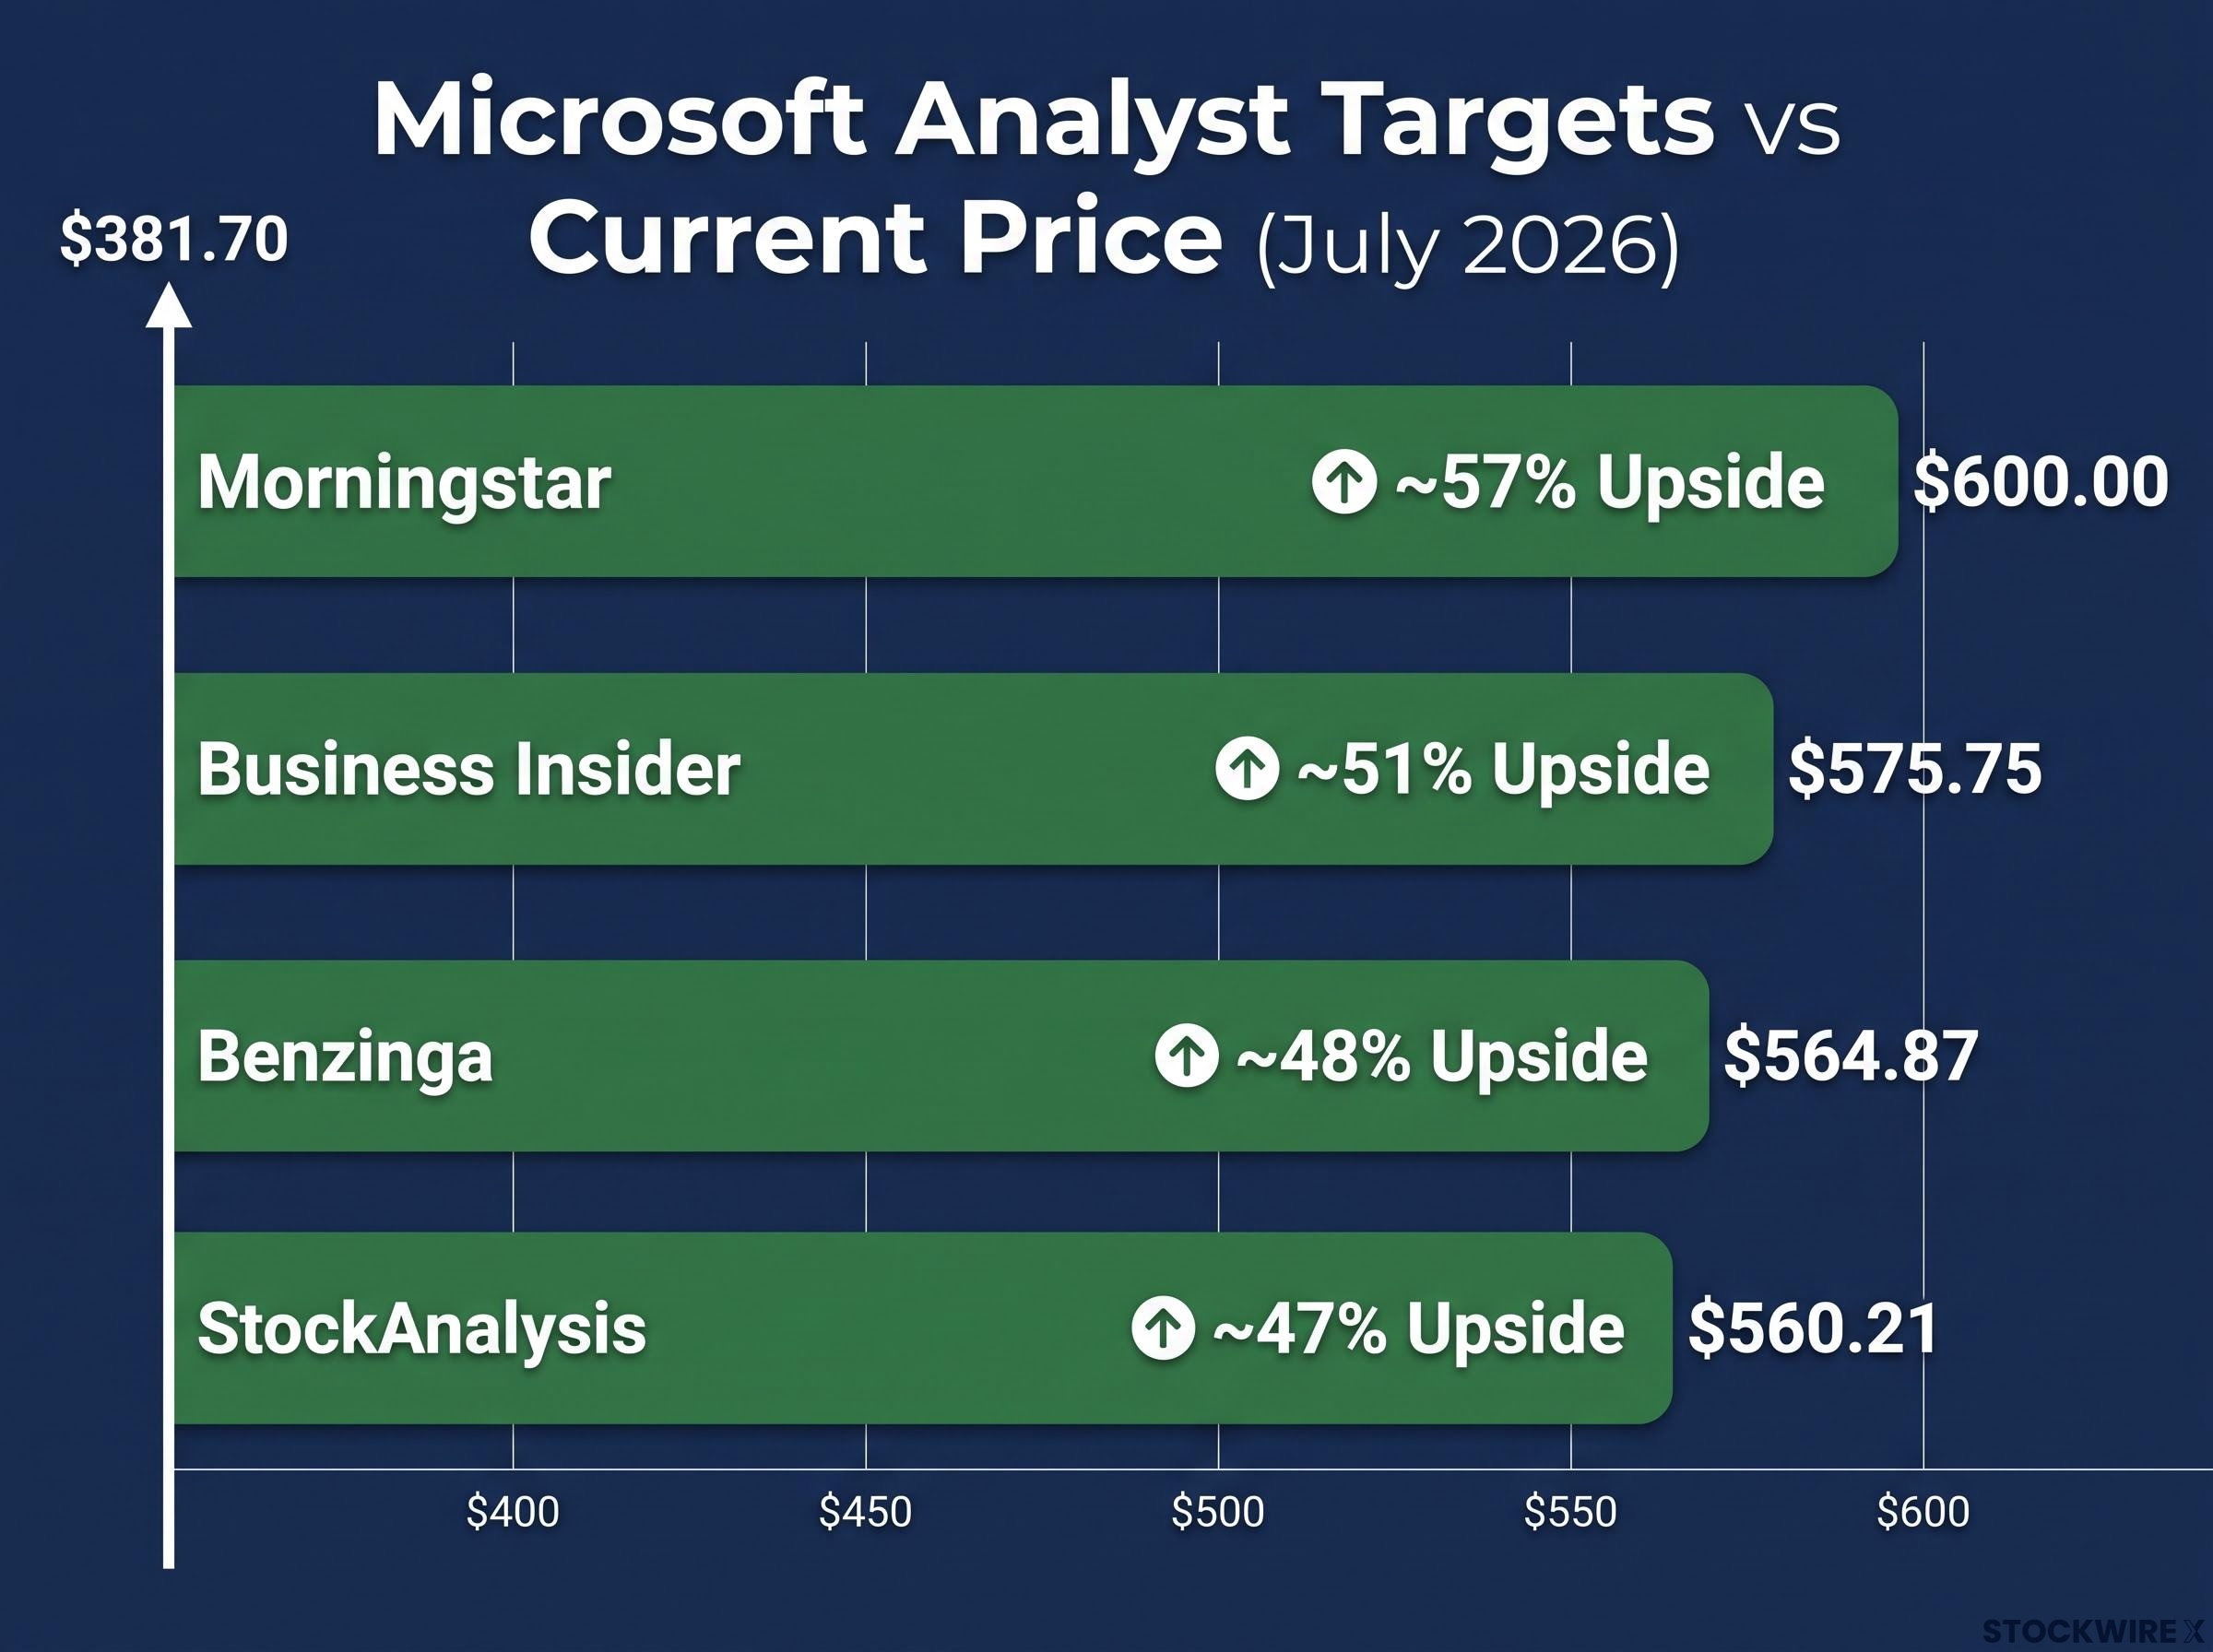
| Source | Fair Value / Target | Implied Upside from $382 | Rating |
|---|---|---|---|
| Morningstar | $600.00 | ~57% | 5 Stars / Wide Moat |
| Business Insider (99 analysts) | $575.75 (median) | ~51% | 99 Buy, 0 Hold, 0 Sell |
| Benzinga | $564.87 | ~48% | Consensus Buy |
| StockAnalysis (56 analysts) | $560.21 | ~47% | Strong Buy |
Morningstar’s five-star rating at $600 implies approximately 57% upside from current prices. That is an unusually wide gap for a company with near-unanimous Buy ratings across every major aggregator.
The convergence of Morningstar’s top rating and a Wall Street consensus where virtually zero analysts carry a Sell tells you something specific: this discount reflects timing and sentiment, not a disputed business quality story. The question is whether the timing resolves in your favour. That requires understanding what drove the stock down.
Pershing Square’s position adds a layer the current consensus targets may not fully capture: the OpenAI stake valuation, estimated at approximately $200 billion based on OpenAI’s post-money valuation, represents an asset Ackman argues is entirely absent from the market price.
When big ASX news breaks, our subscribers know first
Why the stock is down: multiple compression, not a broken business
A 36% decline from a 52-week high invites a natural assumption: something must have broken. In Microsoft’s case, that instinct is wrong, and the distinction matters for how you price the opportunity.
What drove the decline
Three forces account for the majority of the move from $555 to the low $380s:
- Sector rotation away from high-multiple software names. After a strong run from 2023 through mid-2025, investors rotated capital out of long-duration growth assets. Microsoft’s forward price-to-earnings (P/E) ratio, the price investors pay per dollar of expected future earnings, compressed to approximately 21-23x, which appears to be among its lowest levels since 2023.
- AI capital expenditure anxiety. Projected calendar 2026 AI-related capex of approximately $190 billion, up from earlier estimates near $146 billion, raised questions about near-term margin pressure if revenue from AI workloads ramps slower than expected.
- Macro pressure on growth assets. Higher discount rates and tighter financial conditions weigh disproportionately on companies whose value depends on earnings years into the future. Microsoft, as a long-duration compounder, absorbed that pressure directly.
What the decline does not mean
None of these drivers point to structural weakness in Microsoft’s core franchises. Analyst models have not broadly revised down their earnings estimates. The trailing P/E of approximately 22.83x and a dividend yield of 0.93% reflect a business still generating strong cash flows at scale.
The distinction between multiple compression and earnings erosion matters practically. If the business is intact and the multiple has simply reset, you are being offered a lower price for the same future cash flows. That is a fundamentally different proposition than catching a falling knife on a deteriorating franchise.
The economic moat: where Microsoft’s competitive advantages actually sit
A moat, in investment terms, is a durable competitive advantage that allows a company to earn returns above its cost of capital for an extended period. Morningstar assigns Microsoft a Wide Moat overall, but the rating is not uniform across the business. Understanding where the moat is strong, and where it is weak, tells you which parts of the thesis you are actually betting on.
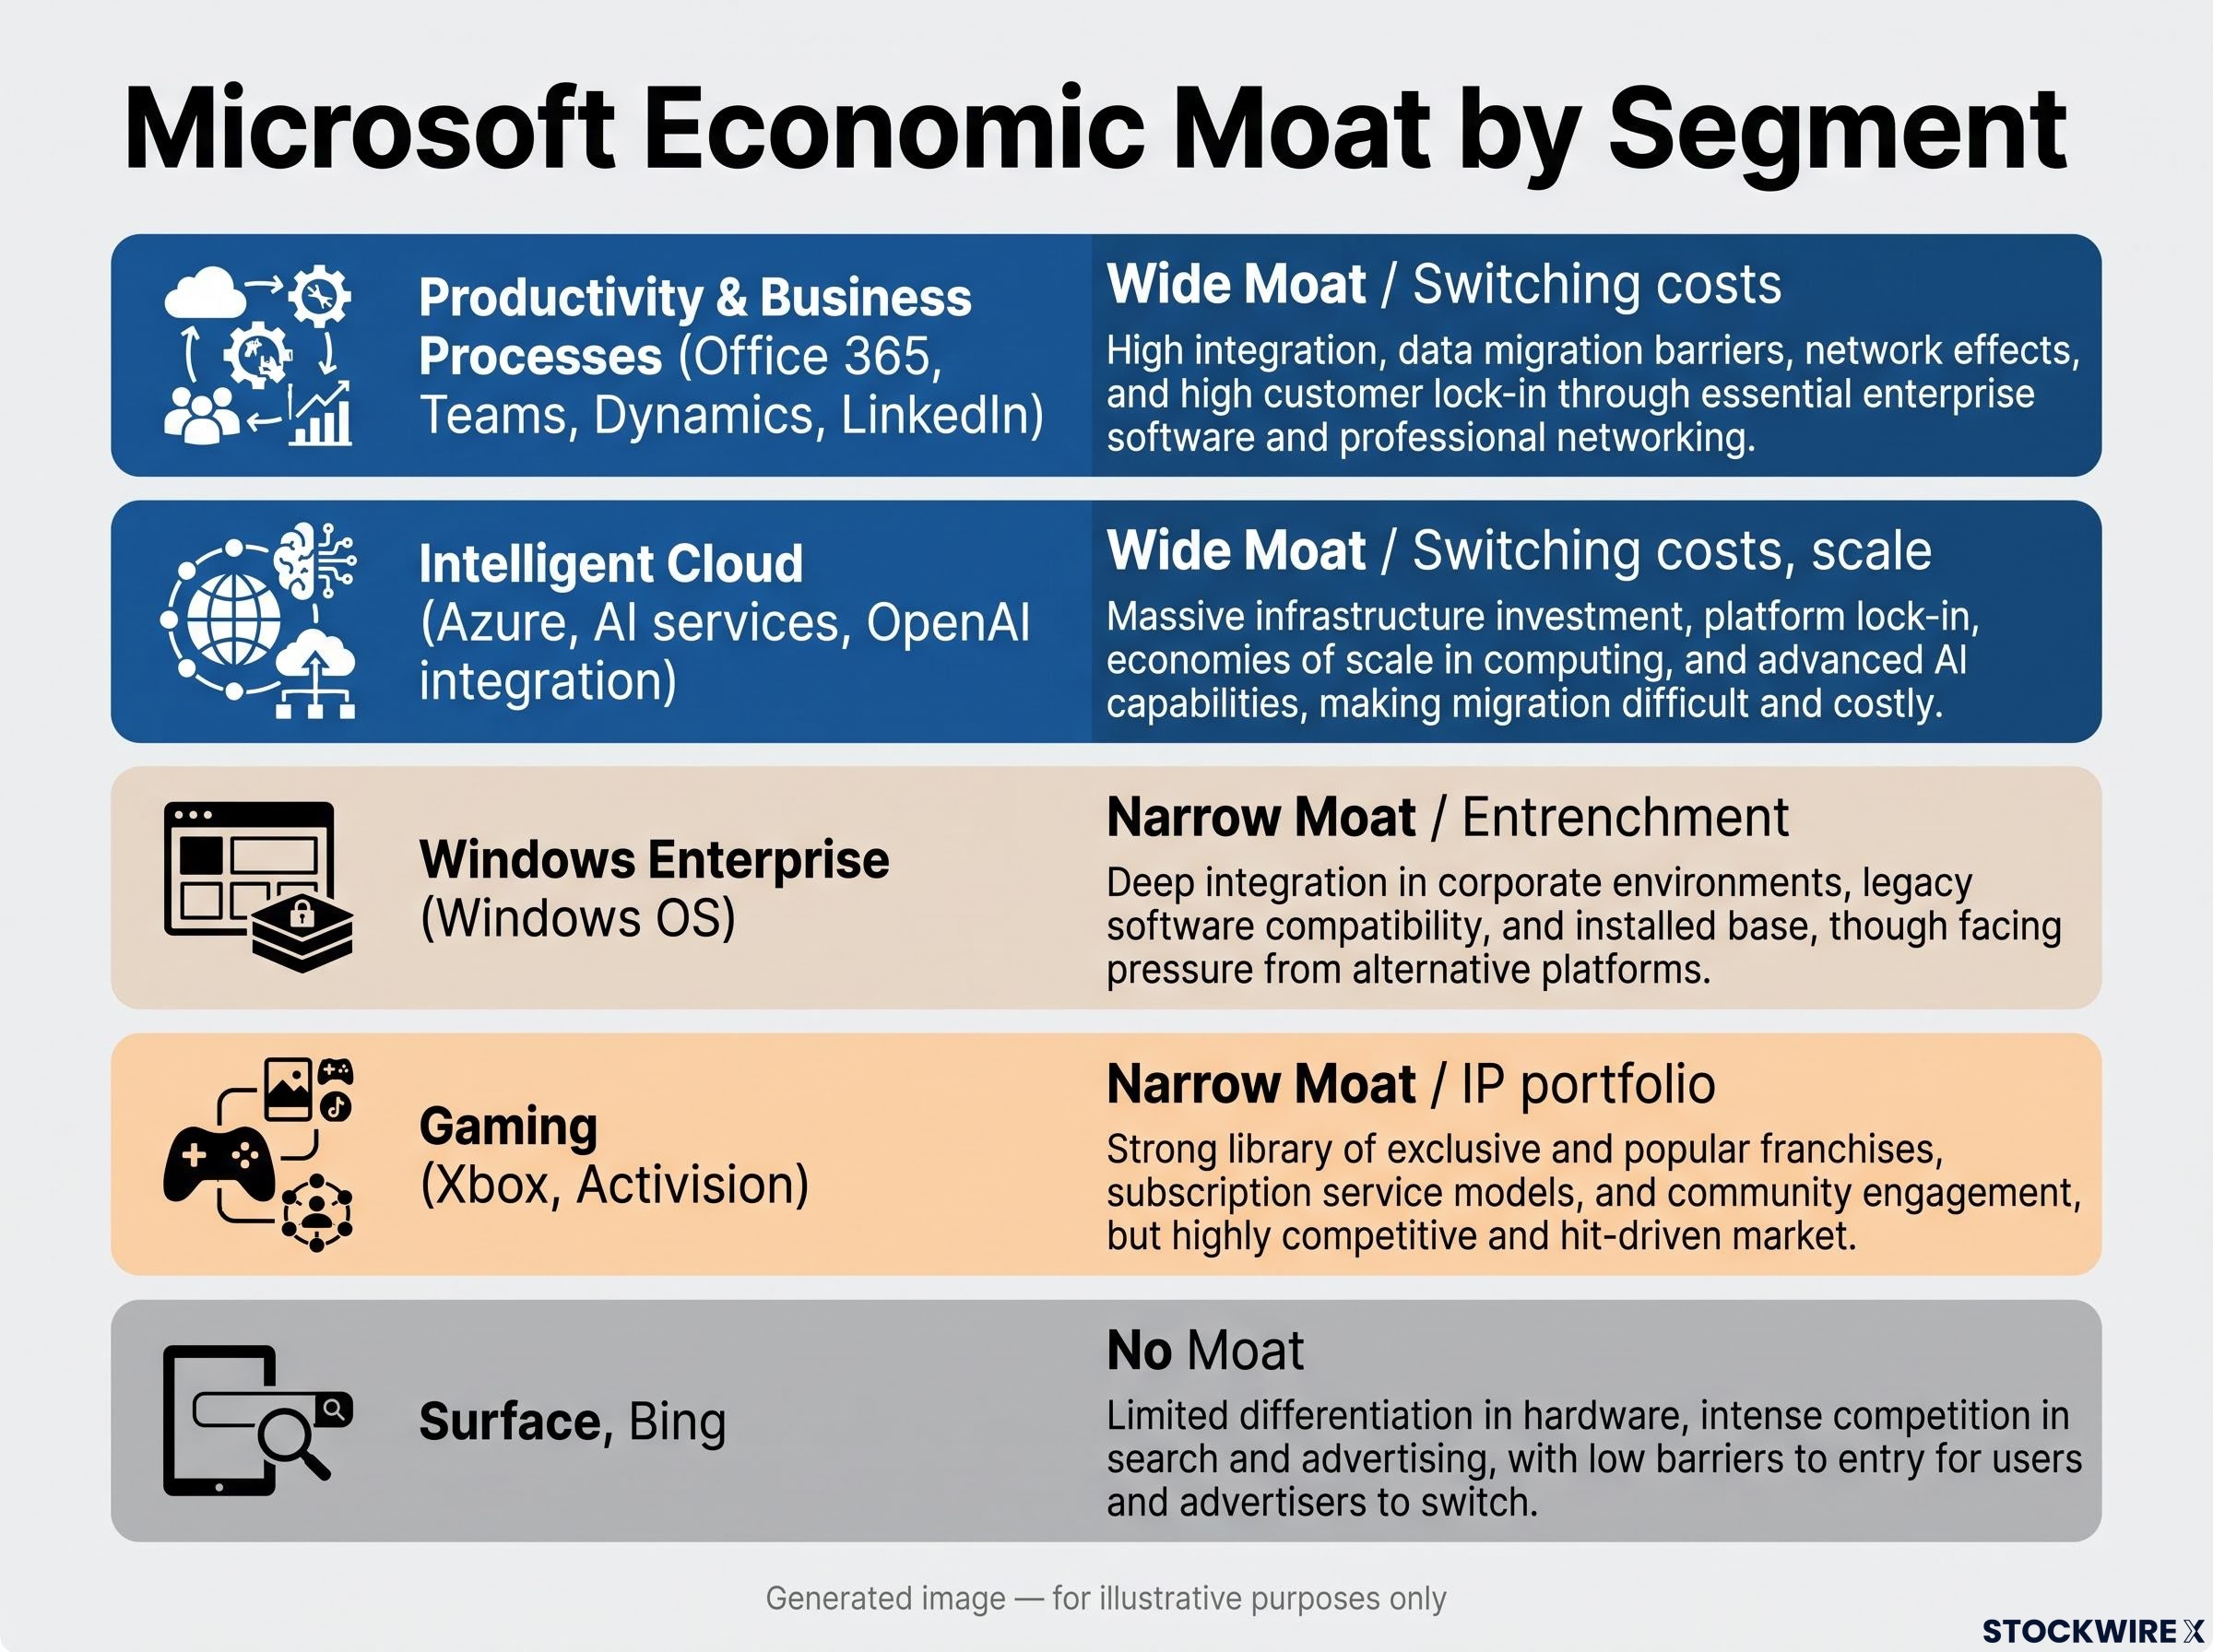
| Segment | Key Products | Morningstar Moat Rating | Primary Moat Source |
|---|---|---|---|
| Productivity & Business Processes | Office 365, Teams, Dynamics, LinkedIn | Wide | Switching costs |
| Intelligent Cloud | Azure, AI services, OpenAI integration | Wide | Switching costs, scale |
| Windows (Enterprise) | Windows OS, enterprise licensing | Narrow | Entrenchment |
| Gaming (Xbox, Activision) | Xbox, Activision IP portfolio | Narrow | IP portfolio |
| Surface, Bing | Surface devices, Bing search | None | N/A |
The Wide Moat is concentrated in two segments. Enterprise customers embed Office 365, Teams, and Dynamics so deeply into workflows that switching carries real operational risk and cost. That creates sticky, recurring subscription revenue with high visibility. In cloud, Azure is one of only two dominant public cloud platforms alongside Amazon Web Services (AWS), and the integration of OpenAI models and Copilot across the Microsoft stack gives Azure a differentiation layer that competitors cannot easily replicate.
Statista’s cloud infrastructure market share data, drawing on Synergy Research Group estimates, shows AWS at approximately 28% and Azure at 21% in Q1 2026, confirming that two platforms hold a commanding structural lead over all other providers in the market.
According to Morningstar, these structural advantages are capable of sustaining returns above the cost of capital for a period of roughly 20 years.
The flip side is equally important. Surface has no assessed moat. Bing lacks a durable competitive advantage in search. Gaming, even with the Activision acquisition, remains competitive and hit-driven.
What this tells you is specific: the investment thesis lives or dies on Azure growth and enterprise software retention. If you are evaluating Microsoft at these prices, your conviction should be anchored in those two segments, not in a generalised view of the whole portfolio.
Balance sheet as a competitive weapon: how financial strength shapes the risk profile
The AI capex question raised in the previous section sounds alarming in isolation: $190 billion in a single calendar year. The balance sheet reframes it entirely.
The hyperscaler capex trajectory provides critical context for evaluating Microsoft’s $190 billion commitment in isolation: Amazon, Alphabet, and Meta combined with Microsoft to reach approximately $725 billion in full-year 2026 AI infrastructure spending, with a $1 trillion annual run rate projected for 2027.
As of June 2025, Microsoft held:
- Cash and equivalents: approximately $95 billion, with total debt of approximately $43 billion sitting against that figure
- Net cash position: approximately $51 billion, reflecting the difference between those two
- Gross leverage: approximately 0.3x fiscal 2025 EBITDA (earnings before interest, taxes, depreciation, and amortisation), indicating an exceptionally unencumbered balance sheet
- Dividend yield: 0.93%, with an ongoing share repurchase programme active
More recent fiscal 2026 quarter estimates place total cash, equivalents, and short-term investments near $89-$95 billion with long-term debt in the $35-$40 billion range. Leverage remains well below 1x EBITDA.
Net cash of approximately $51 billion and leverage of just 0.3x EBITDA. Microsoft is funding the largest AI infrastructure buildout in corporate history from a position of extraordinary financial strength.
This is not a company stretching to fund its AI ambitions. The balance sheet supports aggressive capex, dividends, and buybacks simultaneously without stress. For a leveraged competitor, a $190 billion capex year would raise genuine solvency questions. For Microsoft, it is a deployment of existing financial capacity.
That distinction meaningfully changes the risk calculus. The AI spending may or may not generate the returns bulls expect, but the downside scenario is margin compression, not financial distress. For any investor weighing this stock against other large-cap technology positions, the balance sheet is a differentiator that narrows the range of bad outcomes.
Where the thesis can break: the risks analysts are not dismissing
A 57% implied upside does not come without risk. The consensus view, across 56 analysts at StockAnalysis and 99 Buy ratings at Business Insider, is that these risks are manageable, not that they are absent. Three deserve genuine attention, and each is distinct in character.
- AI capex timing risk. Calendar 2026 infrastructure spending of approximately $190 billion could pressure margins and free cash flow if the revenue ramp from AI workloads is slower than projected. The bad outcome: a multi-quarter period where operating margins compress before AI monetisation catches up. This is a timing question, not a franchise question, but timing matters for returns.
- Copilot monetisation execution risk. There is no guarantee that Copilot adoption matches the pace of investment. If enterprise attach rates disappoint, the market will question whether the AI premium embedded in the stock price is justified. The bad outcome: a narrative shift from “Microsoft is winning AI” to “Microsoft is spending on AI without proof of return.”
The agentic AI threat to Microsoft 365’s bundling logic sits largely outside the scope of near-term analyst models; at 21-22 times forward earnings, that valuation provides limited margin of safety if either Azure concentration risk or bundle disruption materialises before showing up in reported metrics.
- Regulatory and antitrust exposure. Microsoft’s partnership with OpenAI has drawn regulatory scrutiny that could constrain certain strategies or add compliance costs. A material antitrust ruling or settlement could alter the trajectory. This is a structural uncertainty, not a timing question, and it cannot be fully priced in because the range of outcomes is wide.
The forward P/E of approximately 21-23x is low by recent history but still prices in sustained growth. If earnings growth disappoints on any of these dimensions, the multiple has room to compress further.
Understanding these risks as timing and execution questions rather than franchise-level threats is what separates a considered entry from an uninformed one. You should decide explicitly which risks you are willing to accept before acting.
What to watch before acting: the variables that will confirm or challenge the thesis
The analysis above gives you a thesis. The watchpoints below give you a monitoring framework so you are not relying on a static view as conditions evolve. Each maps directly to the risks and assumptions identified in this piece.
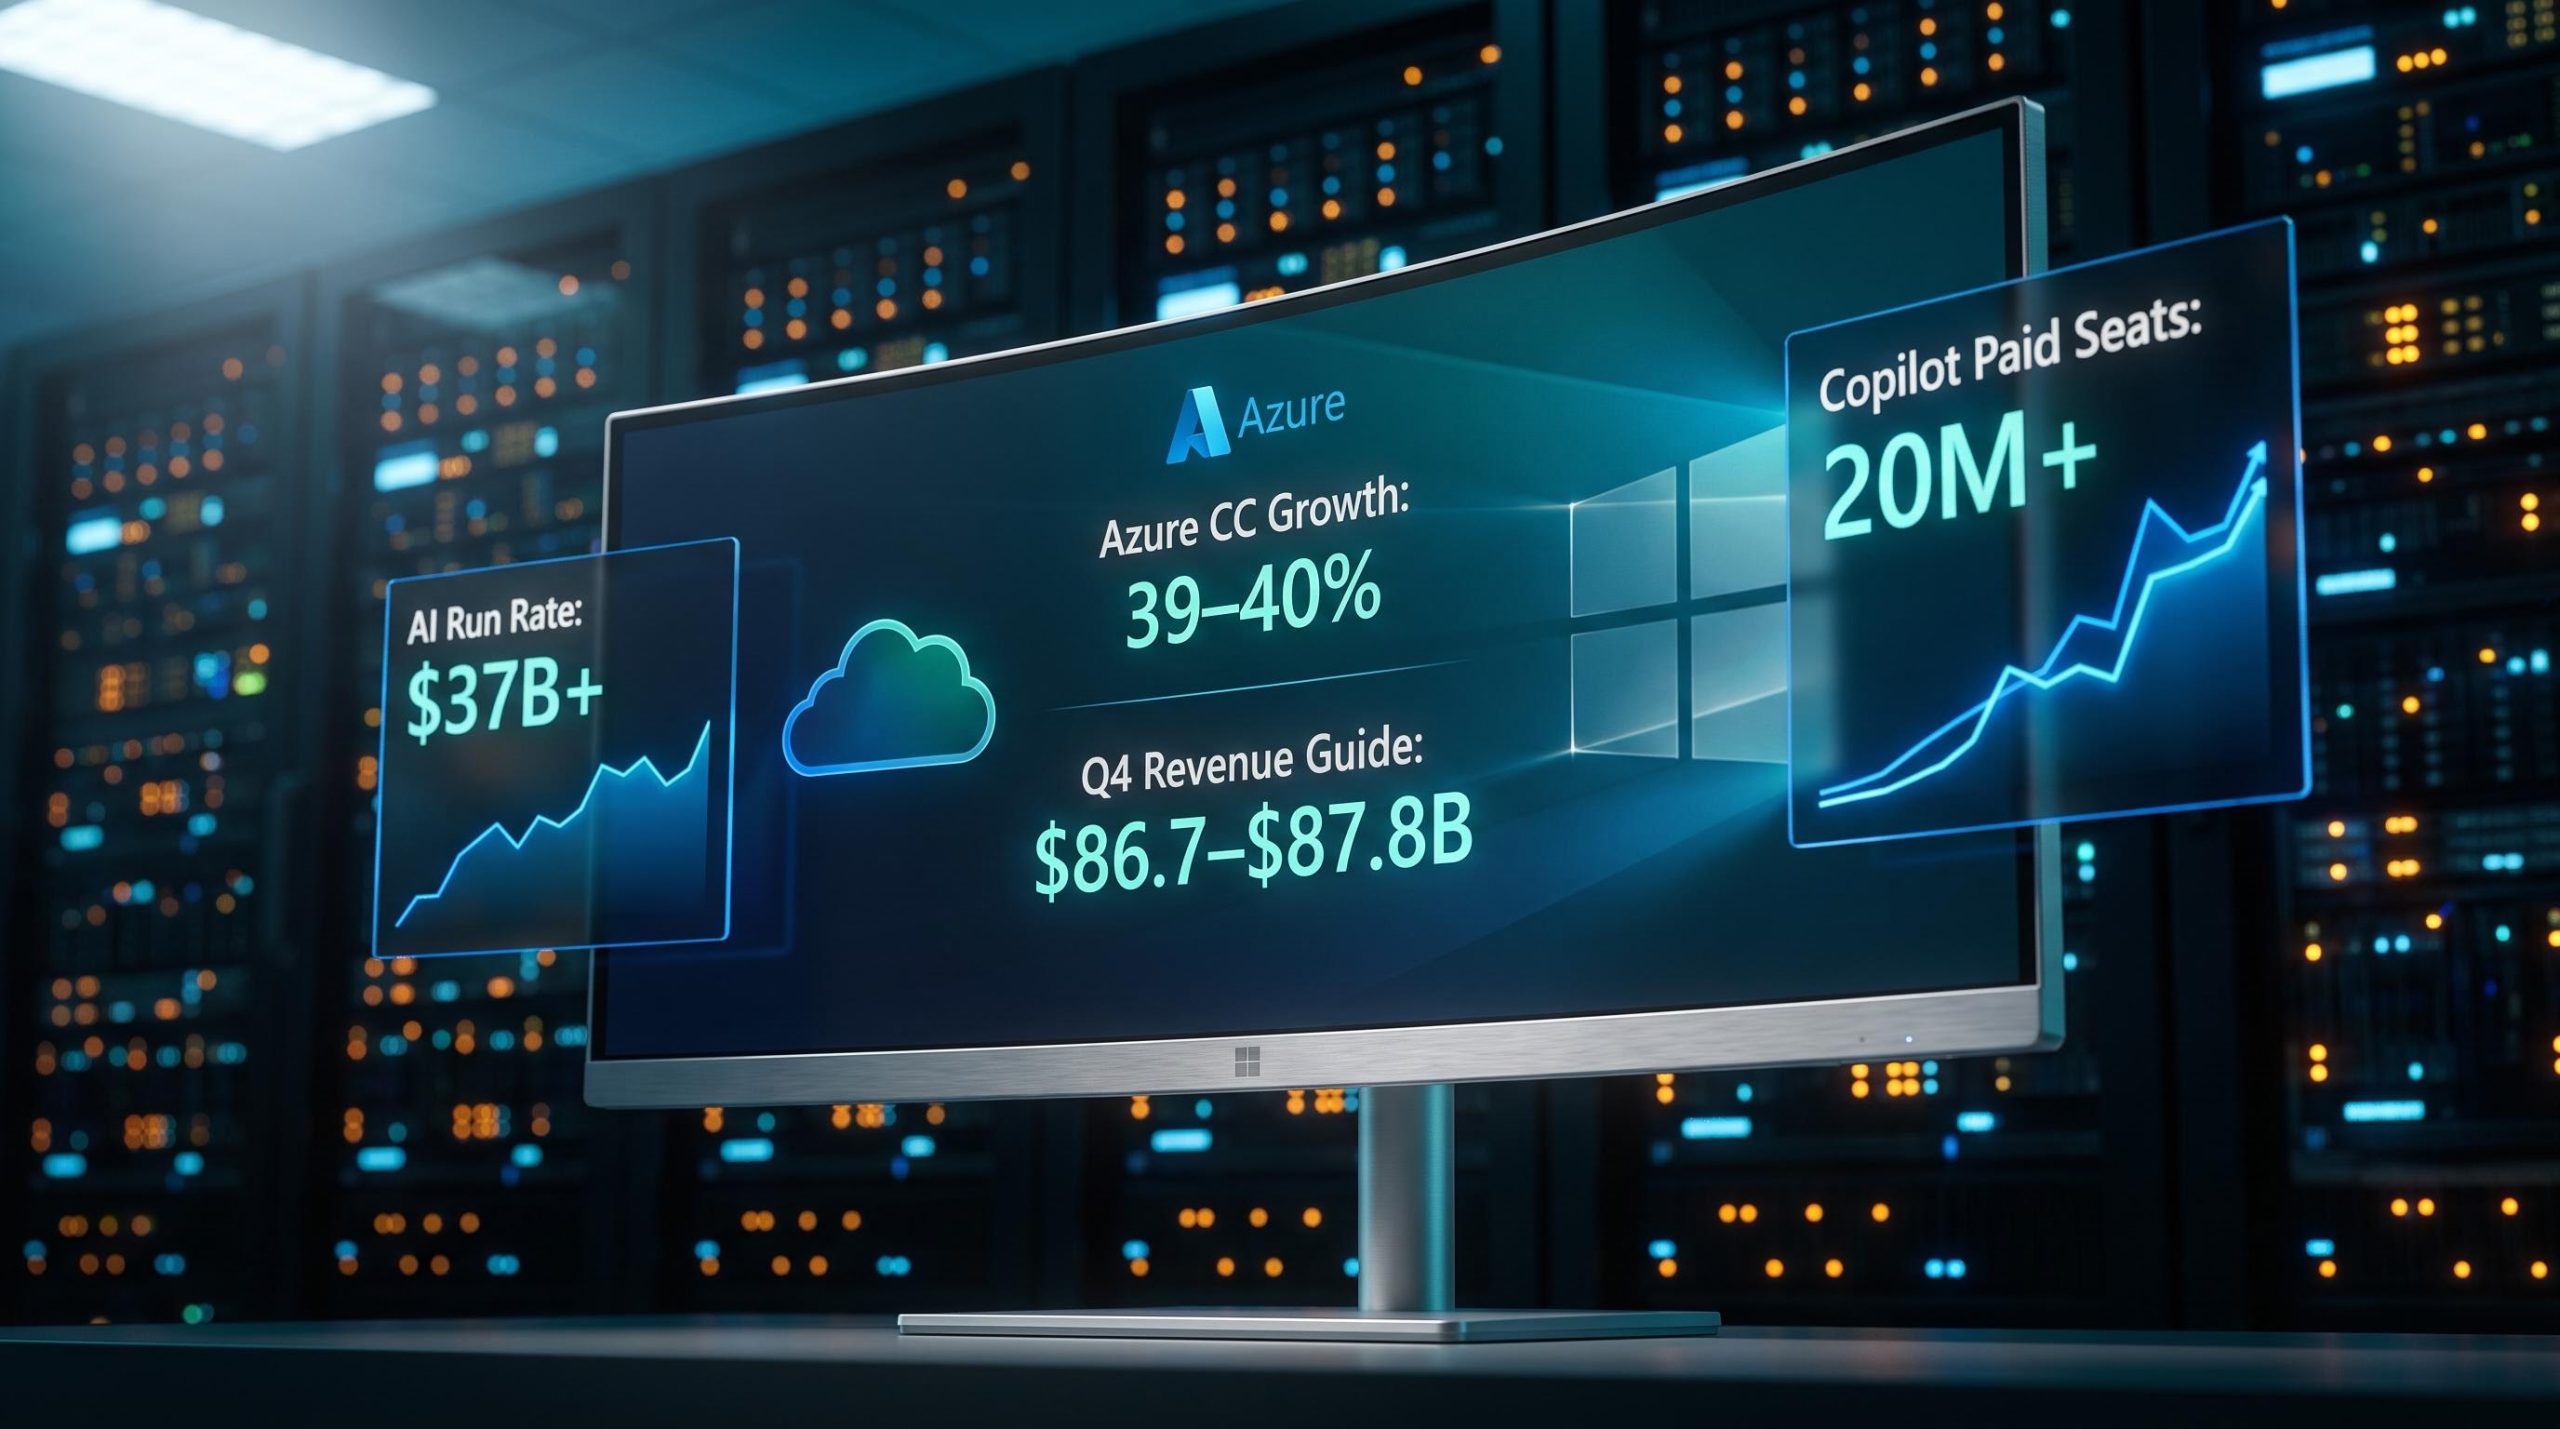
- Azure growth rate on a constant-currency basis. This is the primary revenue signal for the cloud and AI thesis. Acceleration confirms the bull case; deceleration is the clearest grounds for reassessment.
- Copilot and AI annual recurring revenue (ARR) or attach rate disclosures. Any incremental detail on adoption metrics tests whether monetisation is matching the pace of investment. Positive: growing ARR figures. Negative: vague qualitative commentary without hard numbers.
- Operating margin and free cash flow trends. The financial test of whether AI capex is producing operating leverage or margin compression. Watch for margin expansion alongside rising capex as the strongest bullish confirmation.
- Regulatory developments involving Microsoft and OpenAI. Any material antitrust or AI governance ruling that constrains the partnership could alter the trajectory. This is binary: either it happens or it does not.
- Updated capex guidance each quarter. The gap between the $146 billion and $190 billion estimates means company-issued guidance carries high information value. Revisions in either direction will move the stock.
Azure growth on a constant-currency basis carries more weight than any other near-term metric for evaluating this thesis. If cloud growth accelerates, the other risks become more manageable. If it decelerates, the valuation gap may be warranted.
The next earnings release is a near-term catalyst that should provide updated data on all five of these watchpoints. Investing in a thesis without a monitoring framework is speculation. These variables give you grounds to hold, add, or reassess across the next two to three earnings cycles.
A high-quality franchise at a valuation reset: what the evidence adds up to
The evidence across this analysis points in a consistent direction. Microsoft’s Wide Moat, anchored in cloud and enterprise software, is intact. The balance sheet, with $51 billion in net cash and 0.3x EBITDA leverage, provides the financial foundation to execute through the AI investment cycle without stress. And the valuation discount, whether measured against Morningstar’s $600 fair value, the Wall Street consensus of $555-$590, or the stock’s own recent trading history, is driven by identifiable temporary factors rather than franchise deterioration.
The core case in summary:
- Moat quality: Wide Moat in the two segments that matter most, with approximately 20 years of expected excess returns
- Balance sheet: Net cash position and sub-1x leverage provide capacity for aggressive AI spending alongside dividends and buybacks
- Valuation gap: 44-57% implied upside depending on target used, with near-unanimous Buy ratings across major aggregators
- Risk profile: Manageable timing and execution risks, not franchise-level threats
This does not mean the implied upside is a guaranteed short-term trade. The thesis requires patience and execution on AI monetisation. The 57% upside to Morningstar’s fair value is a judgment about intrinsic value over a multi-year horizon, not a price target for next quarter.
For investors looking for a large-cap technology position with durable competitive advantages, strong analyst support, and a meaningful discount to multiple independent estimates of fair value, the evidence is unusually well-aligned. The right next step is deciding whether the risks outlined above are acceptable given your individual time horizon and risk tolerance.
For investors wanting to stress-test the bull case before acting, our deep-dive into Microsoft’s AI position risks examines how OpenAI compute diversification, agentic bundle erosion, and Treasury yield sensitivity interact and can amplify each other during macro tightening cycles.
This article is for informational purposes only and should not be considered financial advice. Investors should conduct their own research and consult with financial professionals before making investment decisions. Past performance does not guarantee future results. Financial projections are subject to market conditions and various risk factors.