Microsoft reports fiscal Q4 2026 earnings on Wednesday, 29 July, and the result will either confirm or complicate one of the most consensus-heavy bull cases in large-cap technology. The thesis rests on three pillars: that Azure is accelerating into AI demand, that heavy infrastructure spending is building durable earnings power, and that margins can expand even as capital expenditure runs at historic levels. All three face a direct test in three days.
The headline revenue and earnings-per-share figures carry modest surprise risk. Wall Street consensus is tightly clustered around Microsoft’s own guidance range of $86.7-$87.8 billion, and EPS estimates sit in a narrow band around $4.21-$4.33. The real information content of the 29 July print lies elsewhere: Azure’s forward growth guidance for Q1 FY27, the trajectory of Copilot and Azure AI monetisation, and whether margin commentary frames the current depreciation headwind as temporary or structural.
Here is the framework for reading each of those signals and understanding which combinations of outcomes keep the long-run thesis, including Morningstar’s projected 13% five-year revenue compound annual growth rate (CAGR) and a path to approximately 46% operating margins by FY29, on track or in need of reassessment.
Why the headline numbers are not the story on 29 July
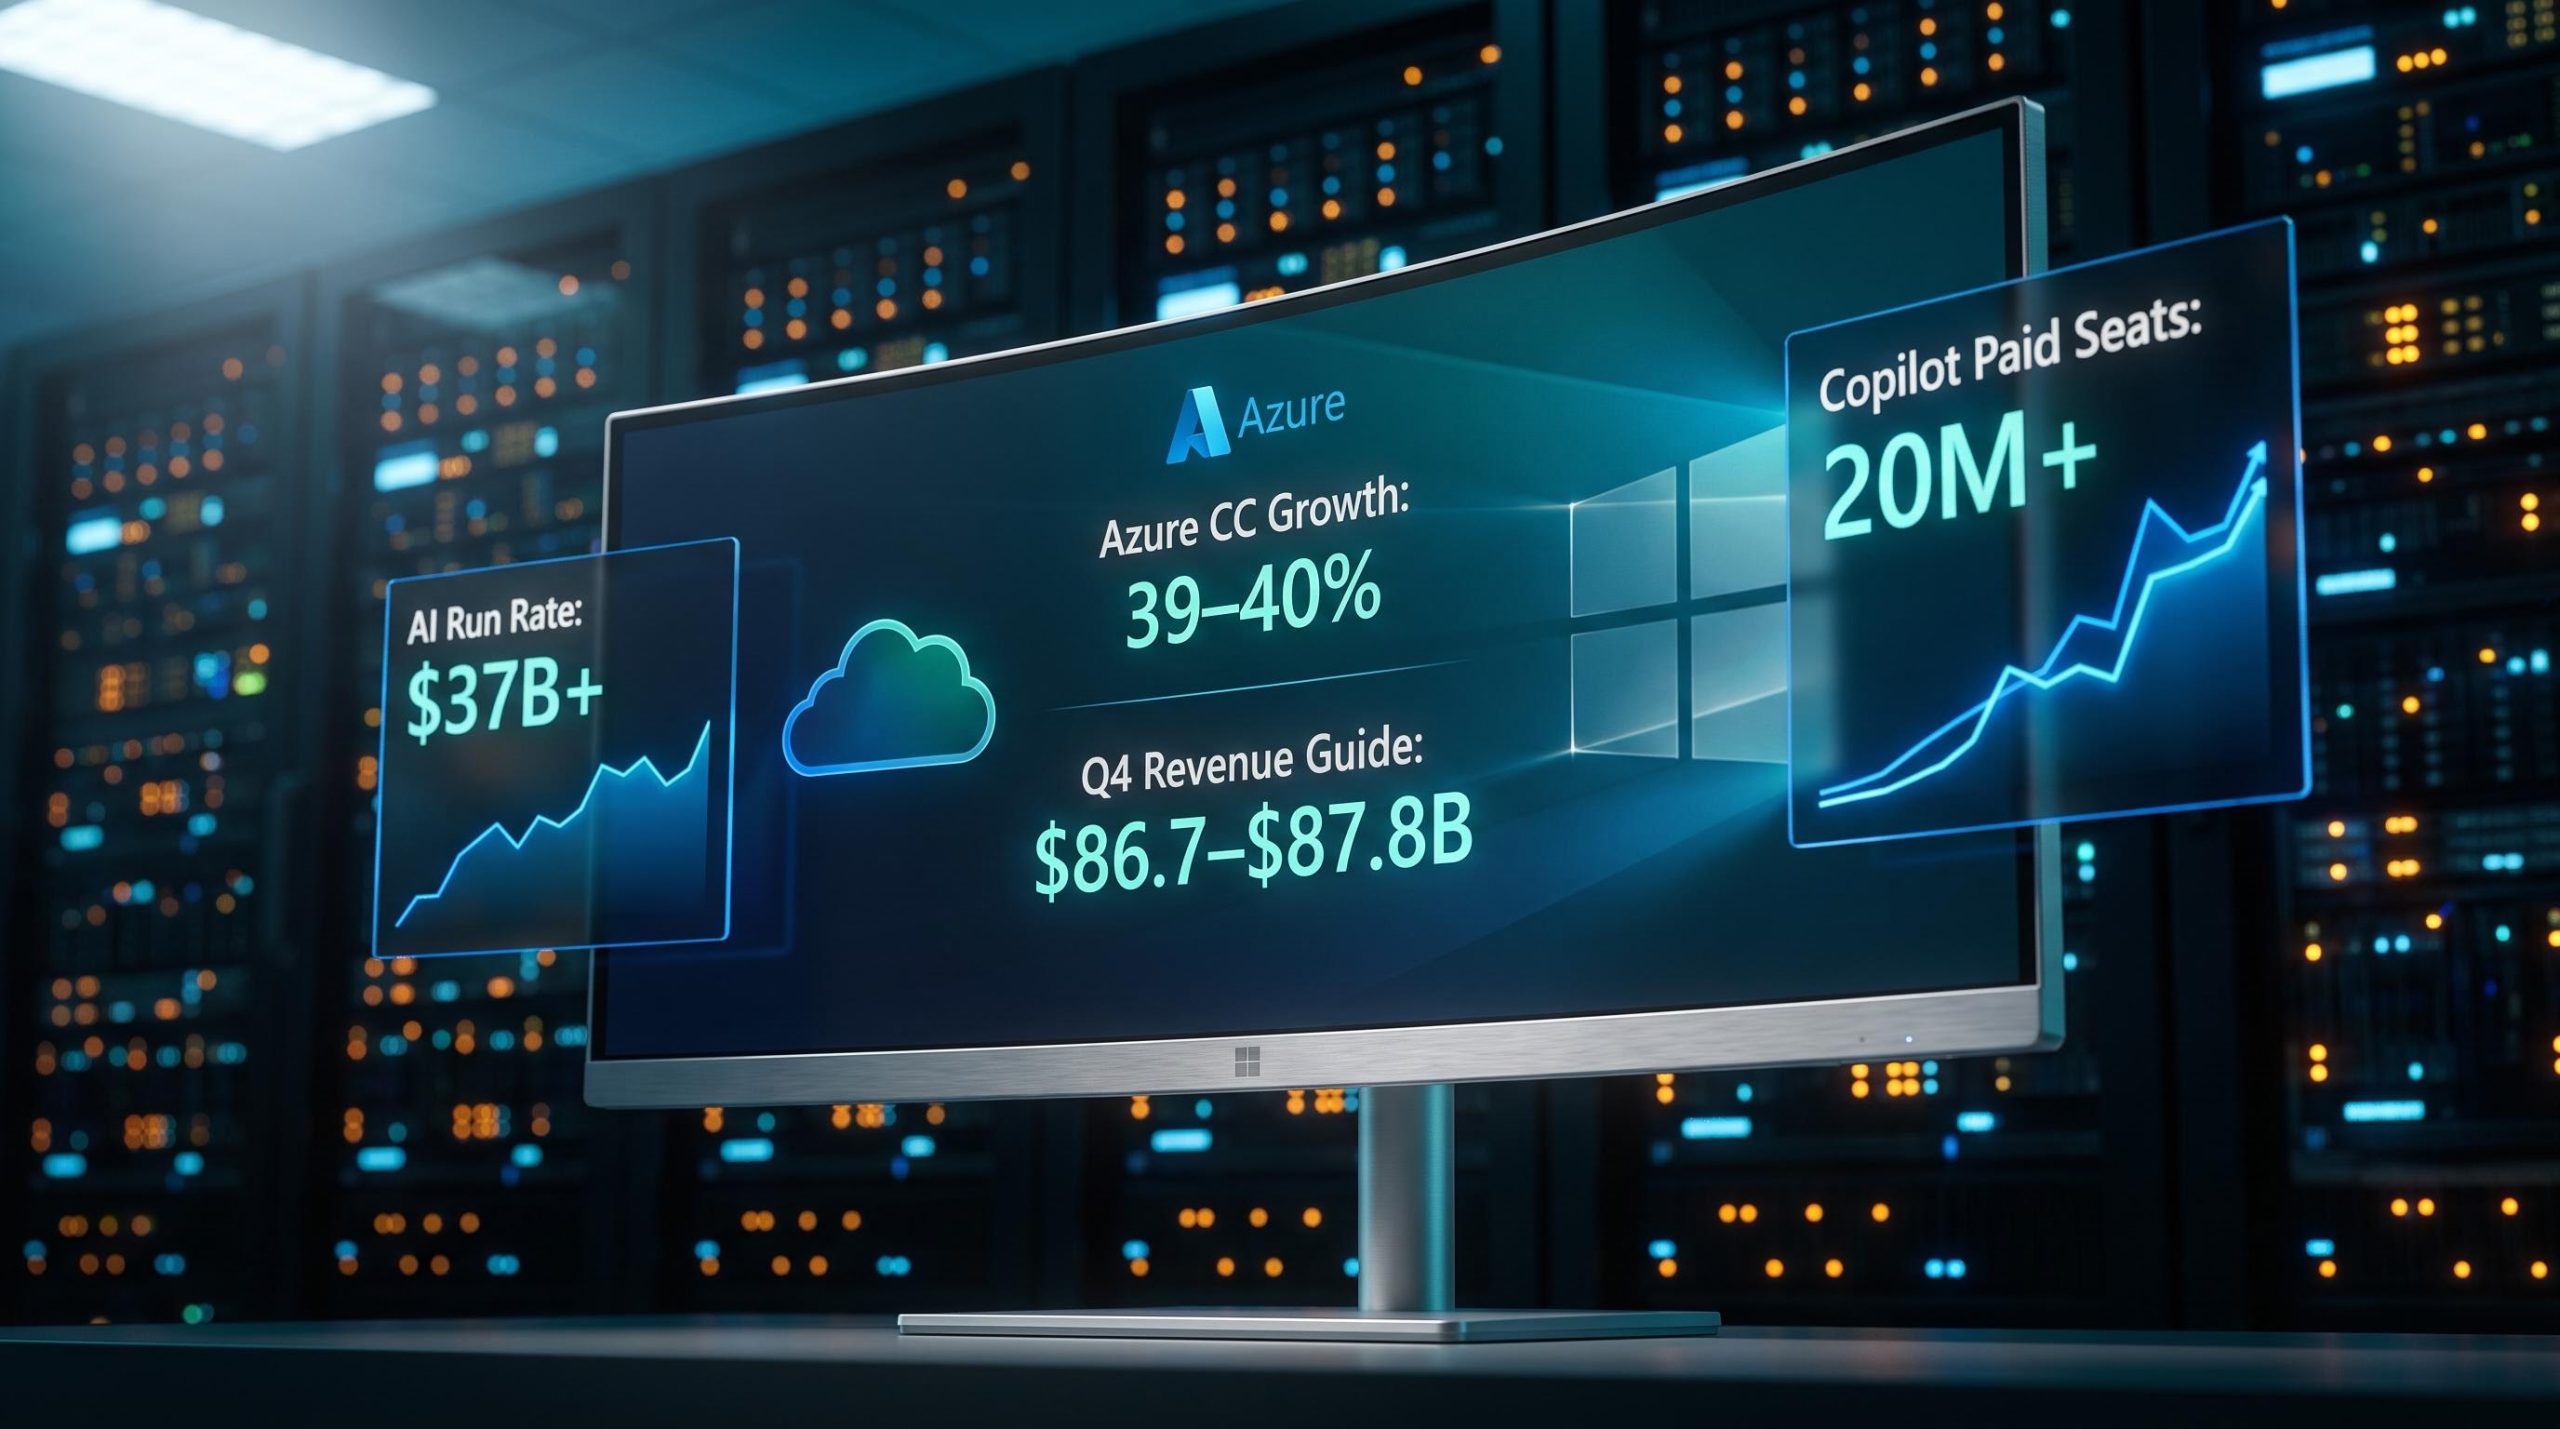
Microsoft’s own Q4 guidance has already done most of the anchoring work. A revenue range of $86.7-$87.8 billion (representing 13-15% year-over-year growth) and an Azure constant-currency growth target of 39-40% leave Wall Street with a narrow surprise window. EPS estimates clustering around $4.21-$4.33 reflect similarly modest dispersion. A revenue beat or miss within that guidance band tells you relatively little about the durability of the AI thesis.
The real information sits in three places:
- Azure Q1 FY27 forward guidance: The backward-looking Q4 number matters less than where management signals growth is heading. This is the market-moving variable.
- Copilot and AI monetisation signals: Paid seat trajectory, enterprise rollout evidence, and any quantification of AI’s contribution to Azure consumption will tell you whether application-layer revenue is scaling or stalling.
- Margin characterisation: Whether management frames near-term margin pressure as a depreciation timing effect (thesis intact) or attributes it to pricing weakness or competitive concessions (thesis at risk).
A result that lands cleanly inside guidance on revenue and EPS but disappoints on forward Azure guidance or margin trajectory would likely produce a negative market reaction. If you hold Microsoft or are considering a position, calibrating your attention toward these three signal categories, rather than the headline figure, is the preparation that matters before the print drops.
For investors newer to dissecting quarterly results, our full explainer on reading earnings reports covers why 84% of S&P 500 companies that beat estimates in Q1 2026 still produced negative post-earnings reactions, with a practical framework for separating guidance signals from reported noise.
When big ASX news breaks, our subscribers know first
What the Azure growth rate actually measures, and why constant currency matters
Azure’s growth is reported in constant currency, which means the figure strips out foreign exchange movements to isolate the underlying business performance. For a cloud platform with a global revenue base, currency fluctuations can add or subtract several percentage points from headline growth in any given quarter. Constant currency removes that noise, giving you a cleaner read on actual customer demand and consumption trends.
In Q3 FY26, Azure delivered approximately 40% constant-currency growth. The Q4 guide of 39-40% is measured against what management described as “a strong prior year comparable that included accelerating growth,” which means even a flat sequential reading represents sustained momentum.
What constant currency does and does not tell you:
- It does isolate genuine business growth from exchange-rate effects, letting you compare quarters on a like-for-like basis.
- It does not tell you whether growth is driven by AI workloads specifically, or by traditional infrastructure-as-a-service consumption.
- It does not distinguish between capacity-constrained growth and demand-constrained growth.
That last distinction is where the interpretive weight sits.
Capacity constraint or demand signal? The framing that changes everything
Microsoft has consistently characterised Azure growth as being limited by infrastructure availability, not by customer demand, and expects capacity additions to continue through 2026. Morningstar analyst Dan Romanoff CPA views Azure as Microsoft’s single most important revenue engine over the next ten years, arguing that enterprise demand for hybrid computing environments gives the platform a durable structural advantage in driving cloud adoption.
This framing matters because it determines how you interpret a potential miss. If Microsoft reports a Q4 Azure number below 39% but attributes it clearly to capacity timing rather than demand softness, that is a materially different outcome from a miss accompanied by weaker backlog language. One is a timing artefact with the thesis intact. The other is a demand signal that changes the forward picture. Management’s language on backlog, demand pipeline, and capacity availability will be the interpretive key on 29 July.
The Q1 FY27 Azure guide is the single number that matters most
The Q4 reported Azure figure is backward-looking. The Q1 FY27 constant-currency growth guidance issued on the 29 July call is the forward signal investors will price, and it is where the real thesis test lives.
The logic here is straightforward: if Azure’s AI-driven reacceleration is durable, forward guidance should hold in the high-30s or better. If the acceleration is peaking, the guide will step down. Each combination of Q4 reported result and Q1 FY27 guide produces a distinct signal.
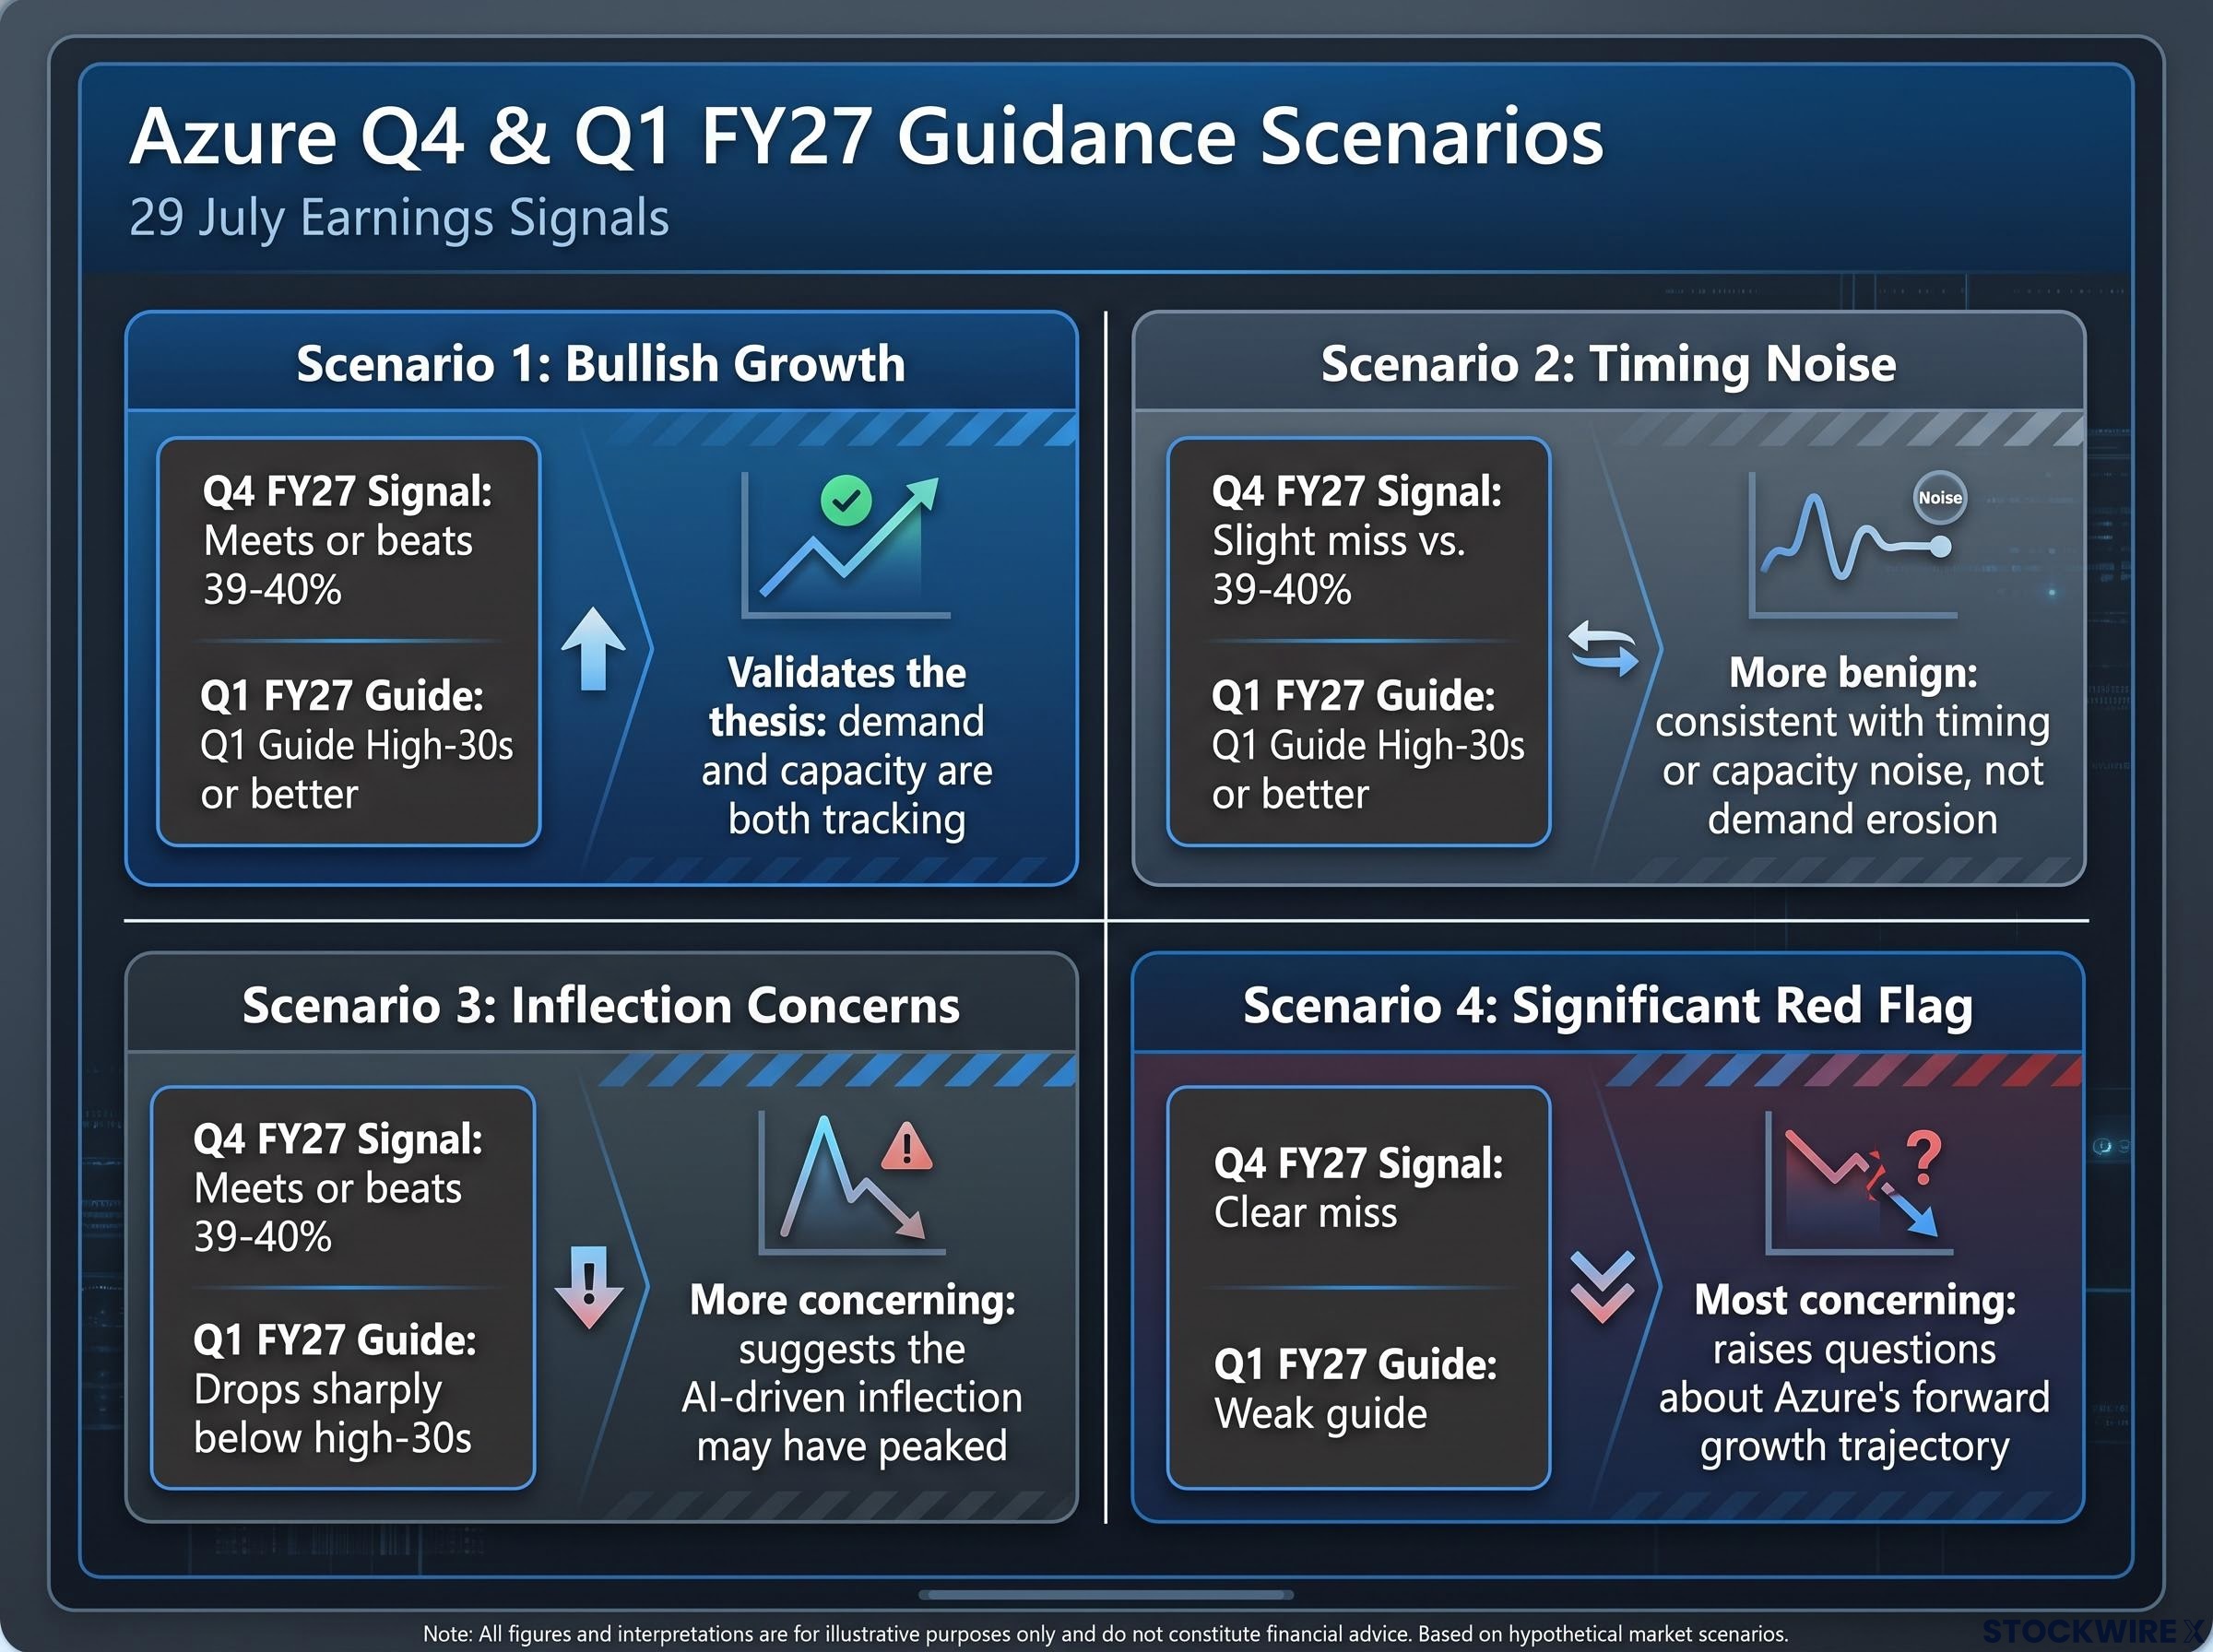
Reading the scenario combinations in real time on 29 July
| Q4 Reported Result | Q1 FY27 Guide | Interpretation |
|---|---|---|
| Meets or beats 39-40% | High-30s or better | Validates the thesis: demand and capacity are both tracking |
| Slight miss vs. 39-40% | Strong, high-30s or better | More benign: consistent with timing or capacity noise, not demand erosion |
| Meets or beats 39-40% | Drops sharply below high-30s | More concerning: suggests the AI-driven inflection may have peaked |
| Clear miss | Weak guide | Most concerning: raises questions about Azure’s forward growth trajectory |
The combination that should draw the most scrutiny from long-term investors is the third row: a Q4 beat paired with a sharp forward guidance step-down. That outcome would suggest the AI-led growth acceleration that has repriced Azure expectations upward may be approaching a natural ceiling, even as the current quarter looked healthy on a reported basis. The reported number tells you where Azure was. The guide tells you where it is going.
The concentration risk embedded in Azure’s backlog is one of the Microsoft stock risks that sits beneath the headline growth figures: approximately 45% of that backlog is attributed to a single counterparty, meaning OpenAI’s ongoing compute diversification to AWS and Google Cloud is a direct, measurable headwind to the forward guidance narrative.
What $190 billion in capex needs to start showing
Microsoft is executing one of the most aggressive infrastructure buildouts in corporate history. FY26 total capital expenditure is expected near $190 billion, with Q4 alone expected to exceed $40 billion. AI-related spend has run ahead of near-term revenue, which is typical early in a platform cycle but creates mounting pressure on investor patience.
AI business reached an annualised revenue run rate above $37 billion in Q3 FY26, up approximately 123% YoY.
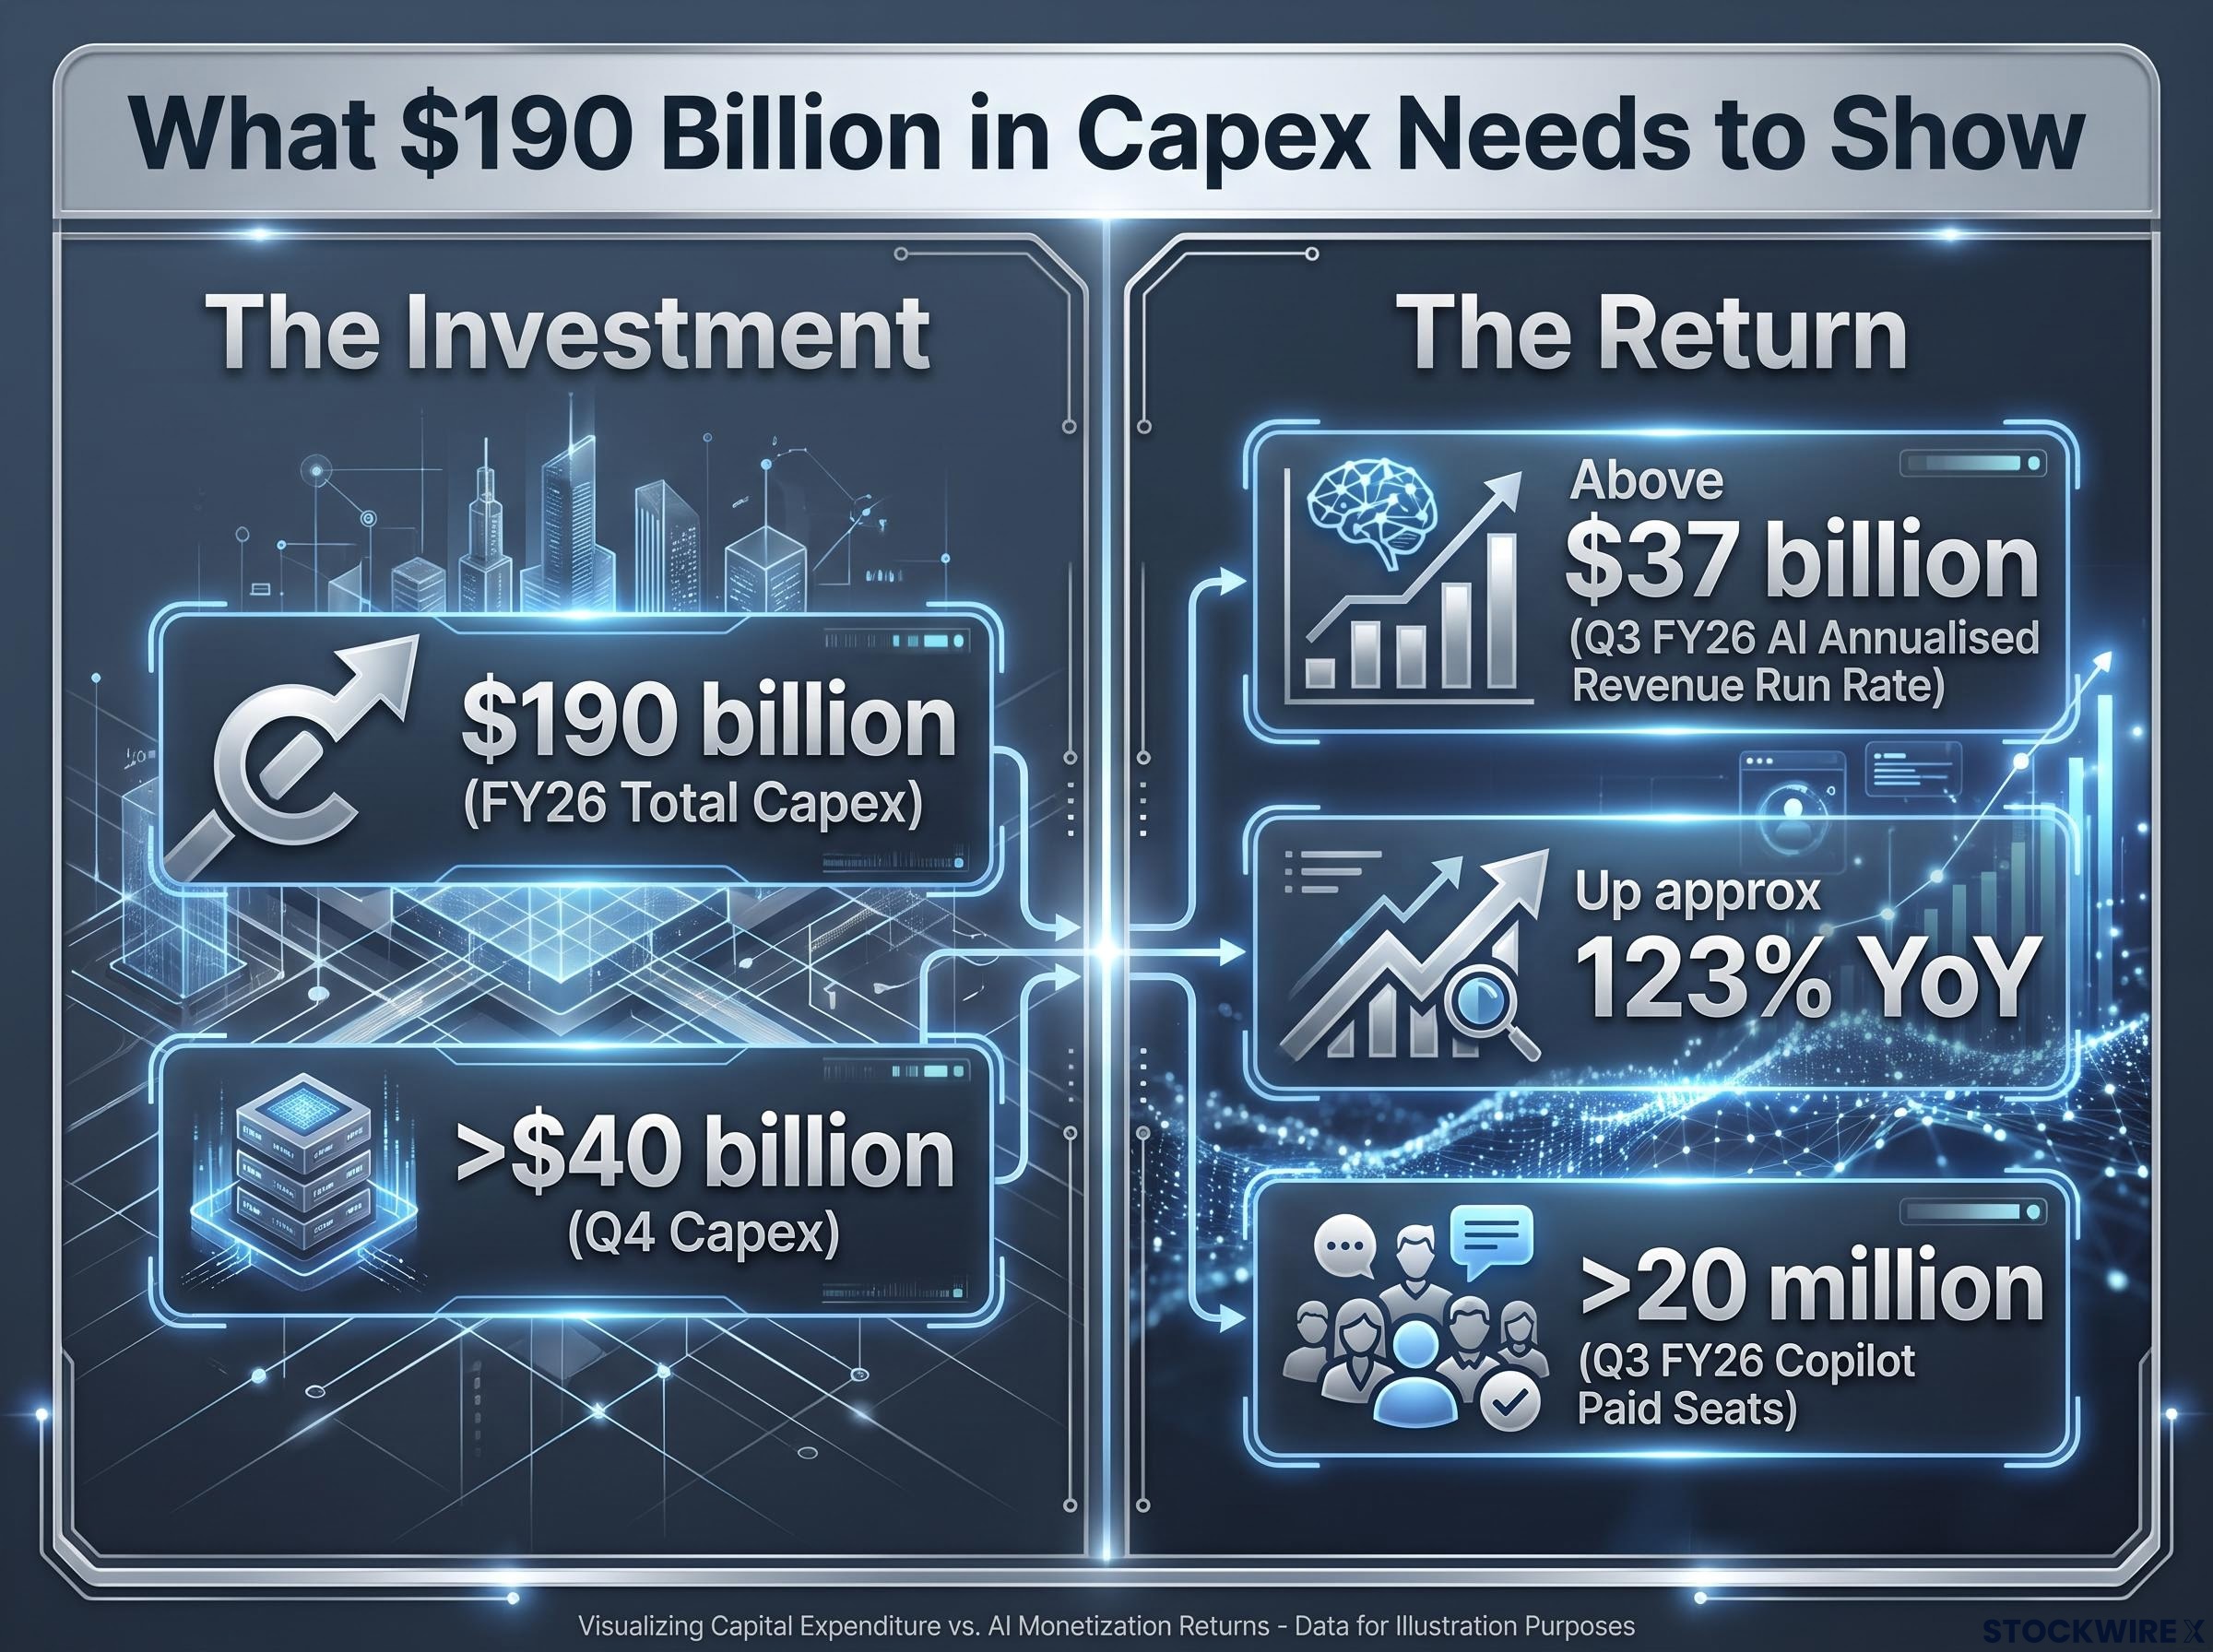
That run rate is the central ROI anchor. Q4 will test whether the trajectory is sustained, and three specific monetisation signals will tell you whether the capex is translating into durable revenue or remains largely theoretical:
- Copilot paid seat trajectory: Q3 FY26 disclosed that paid seats surpassed 20 million with accelerating sequential growth. If Q4 shows another large sequential jump alongside management commentary confirming broad enterprise rollout rather than extended pilot programmes, that is the clearest available signal that application-layer AI monetisation has moved from experiment to scale.
- Azure AI workload share: Whether management quantifies AI’s contribution to Azure growth, even qualitatively, tells you how much of the cloud acceleration is structurally AI-driven versus traditional consumption. A rising share strengthens the case that AI capex is translating into high-margin cloud revenue.
- Internal versus external capacity usage: Morningstar considers the share of Azure capacity being consumed by Microsoft’s own internal operations to be a key disclosure worth tracking. A manageable internal share with rapid external growth suggests efficient monetisation. A very high internal share without commensurate external AI revenue growth would risk signalling over-build.
The capex story is the most contested element of the Microsoft bull case. Understanding what a $37 billion-plus AI run rate actually represents as a return on $190 billion in annual spend, and knowing which Q4 disclosures confirm or complicate that story, is where the investment assessment sharpens.
AI capex commoditisation risk is the structural counterargument to every infrastructure bull case: BCA Research’s Peter Berezin has documented how token price declines and near-zero switching costs at the model layer can redirect the economic surplus away from infrastructure owners and toward application-layer businesses with proprietary data and workflow integration.
Margins under pressure, but is the pressure temporary or structural?
Even as capex expands aggressively, Microsoft has guided for full-year FY26 operating margin to rise approximately 1 percentage point year-over-year. That commitment, set against record infrastructure spending, is the central margin tension. Q4 cost guidance reinforces the scale of the near-term headwind: cost of goods sold (COGS) of $29.4-$29.6 billion (representing 22-23% year-over-year growth, including approximately $350 million from a voluntary retirement programme) and operating expenses of $19.3-$19.4 billion (approximately 7% year-over-year growth, including approximately $550 million related to the same programme).
The depreciation mechanism is straightforward. As capex and finance leases ramp, depreciation and amortisation rise in subsequent quarters, flowing directly through Intelligent Cloud gross margin and consolidated operating margin. Morningstar has flagged the step-up in depreciation that accompanies sustained elevated capex as an open question and a margin risk worth watching closely. The long-term model anticipates operating margins edging up from the 45% recorded in FY24 toward 46% by FY29, supported by Azure gross margin improvement and operating leverage, with FCF margins having run near 30% over recent years and expected to advance incrementally from there.
The two-question test for margin interpretation on earnings night
Two questions will separate acceptable near-term noise from genuine thesis risk:
- Is the compression primarily from depreciation and one-time items? If Intelligent Cloud gross margin holds flat or improves year-over-year despite the depreciation load, that is a strong signal that Azure’s revenue scaling is absorbing infrastructure cost growth at a pace consistent with long-run margin expansion.
- Does management characterise the pressure as a timing effect with improving utilisation, or something more persistent? Depreciation-driven pressure with near-peak framing keeps the Morningstar path to 46% operating margins by FY29 plausible. Pressure attributed to pricing weakness, competitive concessions, or demand softness would require model reassessment.
What you should watch for in the margin commentary:
- Reassuring: Intelligent Cloud gross margin flat or up year-over-year; consolidated operating margin holding near mid-40s after one-time charges; management framing depreciation as near peak relative to revenue.
- Concerning: Material margin compression that cannot be attributed to depreciation timing or one-time items; any suggestion that competitive dynamics or weaker pricing are contributing to the decline.
Margin trajectory is the variable that determines whether Microsoft’s AI investment cycle ends in earnings power expansion or sustained dilution of returns. Getting the interpretation right is the difference between holding through near-term noise and correctly identifying a thesis break.
What a strong or weak result means for the five-year investment thesis
Morningstar’s long-term model calls for roughly 13% annual revenue growth over five years, with Azure, Office 365, and AI product integration as the primary engines, alongside a gradual lift in operating margins from the 45% recorded in FY24 to around 46% by FY29. FCF margins have run near 30% in recent years and are forecast to trend higher over time. This is the valuation scaffolding against which the Q4 print should be assessed.
The valuation scaffolding beneath the five-year model rests on a near decade-low forward multiple that justified entry for institutions earlier in 2026, but with commercial bookings having declined approximately 4% year-over-year in Q3, the 29 July print will test whether that multiple represents enduring value or a capex trap in slow-motion.
A validating print looks like this:
- Azure sustaining near 40% with a high-30s-or-better Q1 FY27 guide
- Copilot seat growth accelerating beyond 20 million, with enterprise rollout evidence
- Operating margins holding near mid-40s despite record depreciation and one-time charges
- Productivity and Business Processes segment revenue of $37.0-$37.3 billion (12-13% year-over-year growth) confirming Office 365 upsell durability
A thesis-challenging print looks like this:
- Q1 FY27 Azure guide stepping down materially below the high-30s, particularly if management stops emphasising capacity as the constraint
- Copilot seat growth stalling or evidence of prolonged pilot mode rather than scaled enterprise deployment
- Margin compression attributed to structural factors rather than depreciation timing
- Capex guidance implying continued acceleration without clearer near-term revenue payback
The More Personal Computing segment (guided for mid- to high-teens year-over-year decline in Q4) is widely expected to be weak and primarily reflects PC and device market cycles, not the AI and cloud thesis. It is not a focus for thesis assessment in this print.
Investors should enter 29 July with a pre-formed mental model of what constitutes a validating result versus a thesis-challenging one. The post-earnings narrative in the first few hours will be shaped by whoever frames the story fastest, and having your own framework prevents anchoring to the wrong interpretation.
What 29 July will and will not settle for long-term investors
A single quarter cannot prove or disprove a multi-year AI infrastructure investment thesis. What the Q4 print can do is narrow the probability range meaningfully. The specific combinations of Azure forward guidance, Copilot momentum, and margin characterisation will either reinforce or weaken the case that Microsoft’s infrastructure buildout translates into the earnings power its current valuation implies.
The thesis-validating threshold is specific, not vague: an Azure guide in the high-30s, Copilot seat growth continuing to accelerate, and margin pressure framed as depreciation timing rather than structural compression. A result that is strong on these dimensions but noisy on secondary metrics is still, on balance, a positive read.
Investors with a long time horizon should treat a directionally validating print as expected confirmation and focus on the forward guide for conviction sizing. Investors watching for thesis risk should focus exclusively on two variables: the Q1 FY27 Azure guide and the margin characterisation language. Those two data points, more than any headline revenue figure, will determine whether the long-run model holds.
This article is for informational purposes only and should not be considered financial advice. Investors should conduct their own research and consult with financial professionals before making investment decisions. Past performance does not guarantee future results. Financial projections are subject to market conditions and various risk factors.