Citi’s Bear Market Checklist just triggered 10 out of 18 flags at the global level, its highest reading since the 2008 financial crisis. The note, published by Citi analyst Beata Manthey on 5 June 2026, arrives while the dominant institutional view on equities remains constructive, AI capital expenditure forecasts are being revised sharply higher, and the bank’s own framework shows U.S. markets flashing more than double the warning signals of their European counterparts. The tension between the most elevated risk reading in nearly two decades and a consensus that still favours equities into year-end is the signal worth understanding. What follows breaks down what the 10-flag reading means historically, why the 6.5-flag gap between U.S. and European markets matters for regional positioning, how major strategists are responding, and what conditions would push the count higher.
Citi’s risk checklist reaches its most elevated reading in nearly two decades
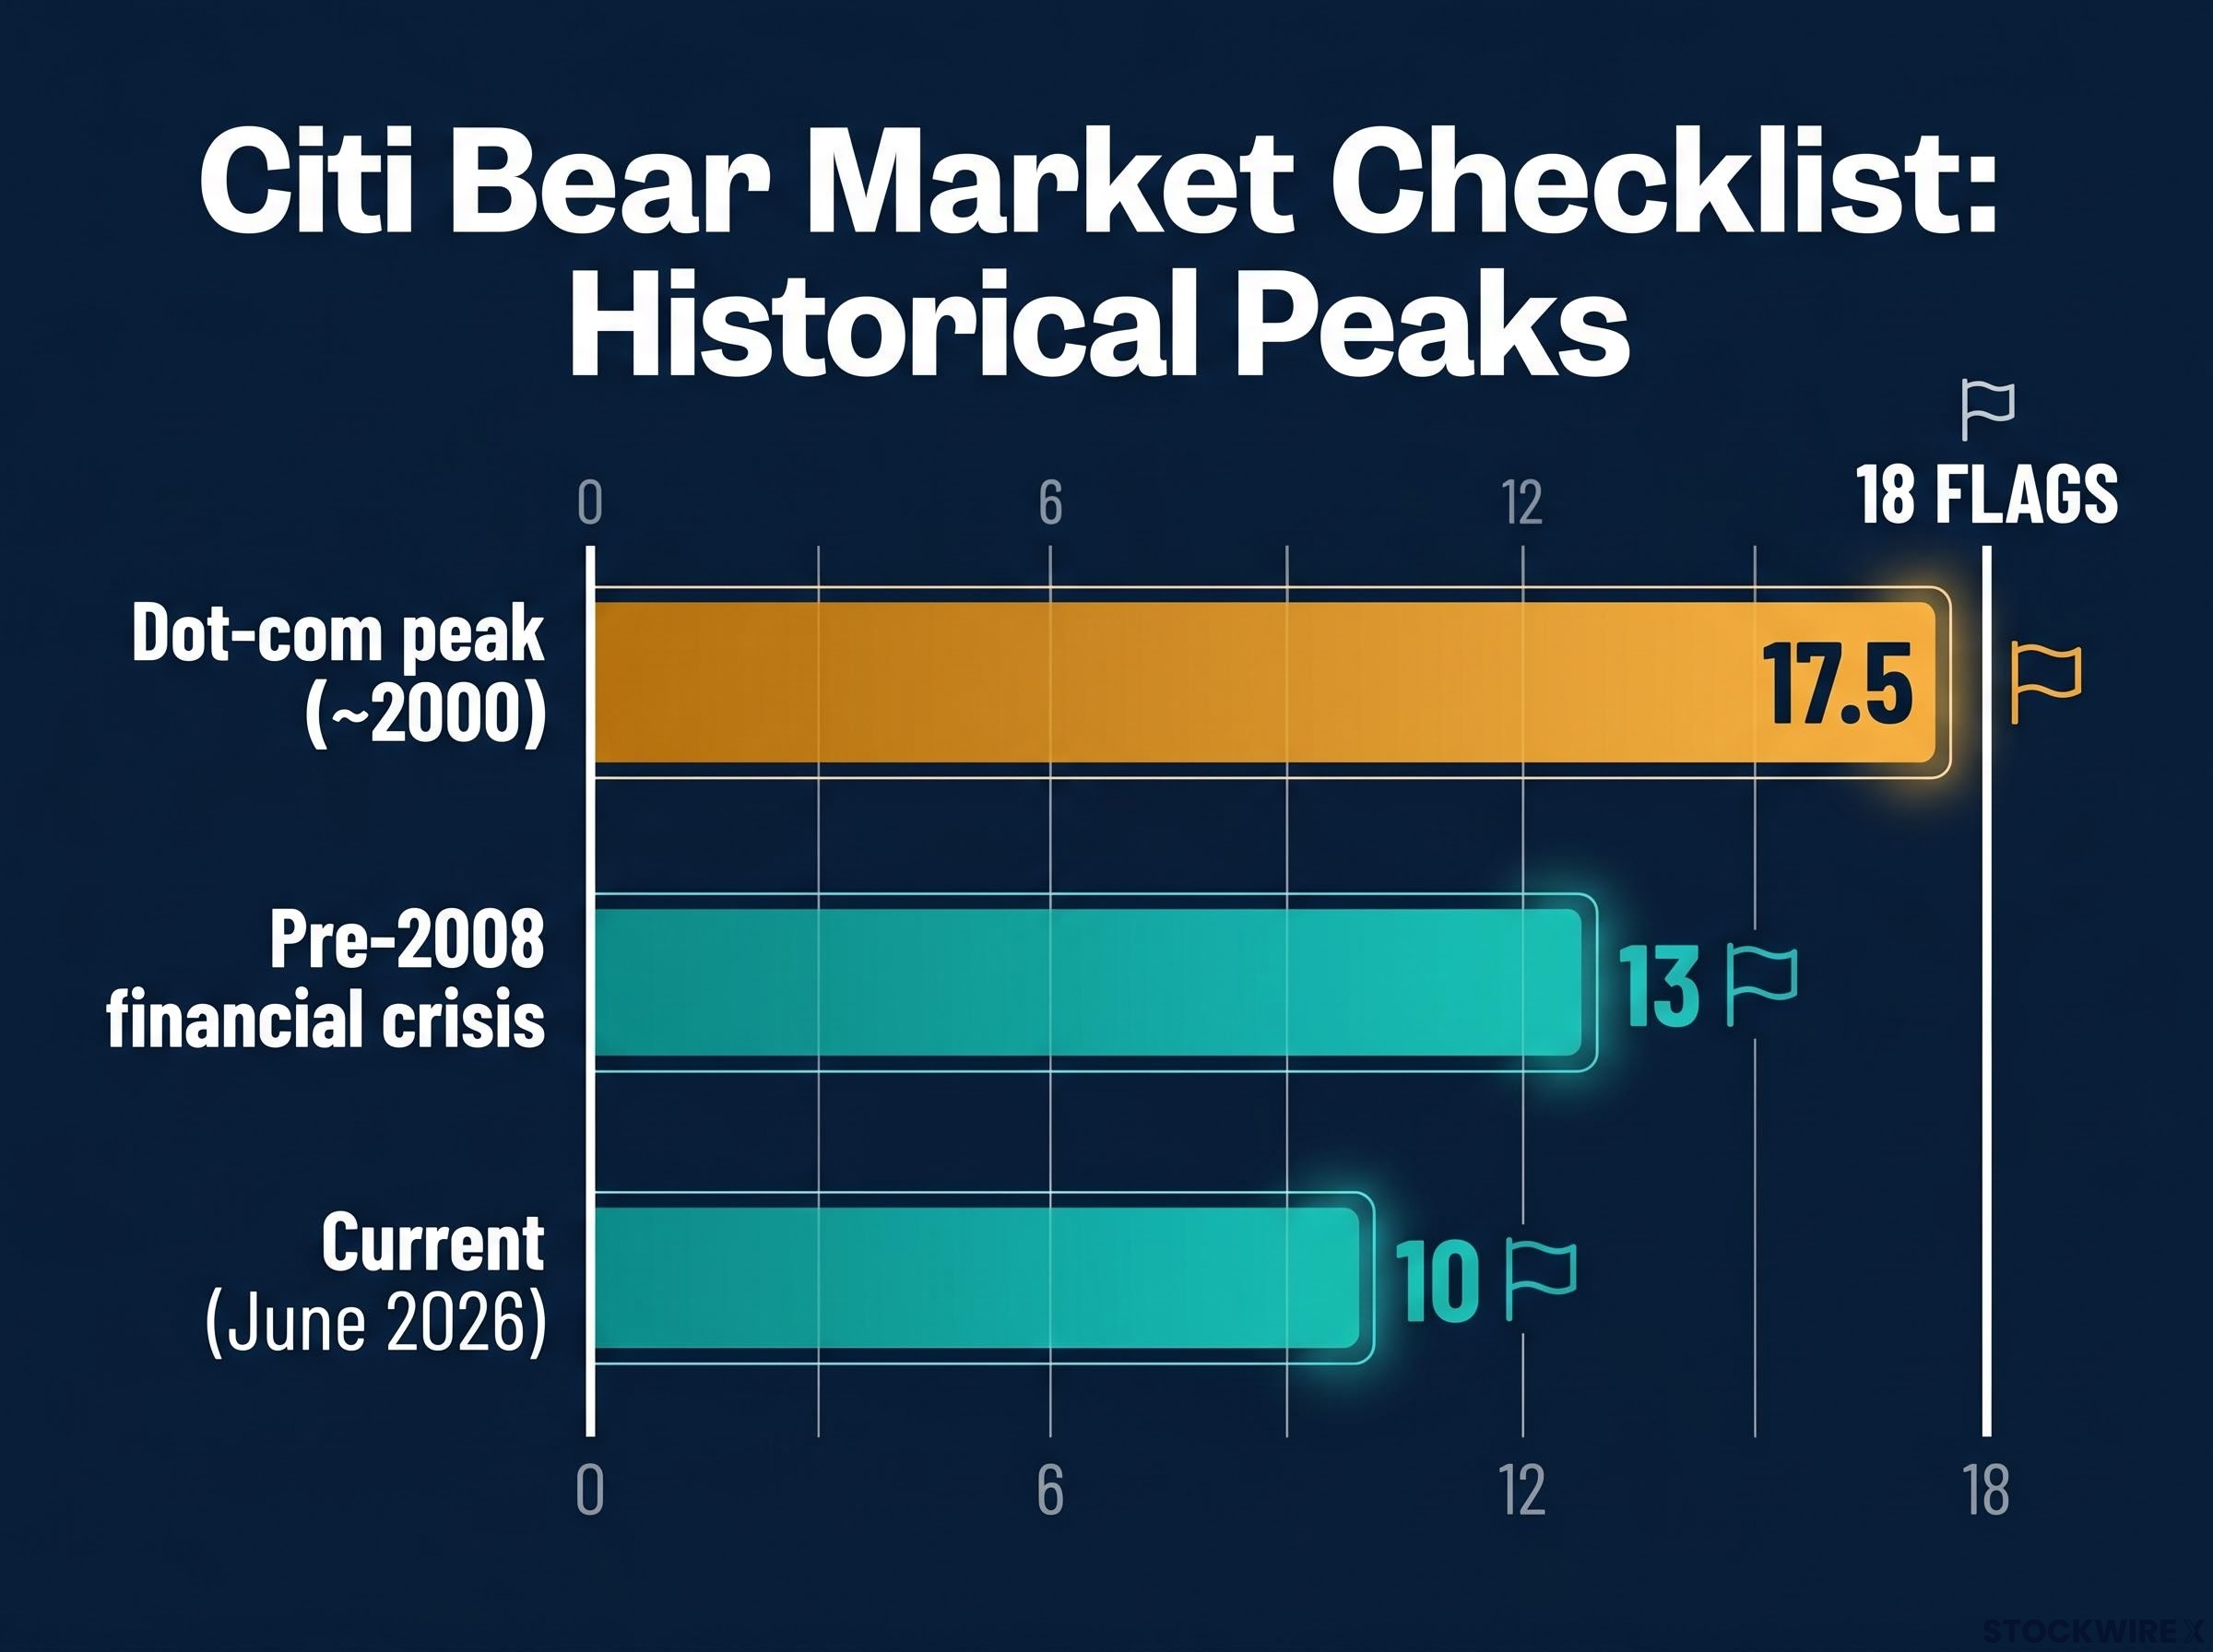
The weight of the comparison is immediate. At 10/18 flags globally, the Citi Bear Market Checklist sits at a level not seen since the period surrounding the global financial crisis. That places the current reading firmly in elevated territory on Citi’s own historical spectrum.
10 out of 18 flags triggered globally, the highest reading on Citi’s Bear Market Checklist since the 2008 financial crisis.
It does not, however, place it anywhere near the extremes that preceded the two worst equity drawdowns of the past three decades. The dot-com peak around 2000 registered 17.5/18 flags. The pre-2008 crisis reading reached 13/18. The current count sits meaningfully below both thresholds.
| Era | Checklist Reading | Outcome Context |
|---|---|---|
| Dot-com peak (~2000) | 17.5 / 18 | Preceded major equity bear market |
| Pre-2008 financial crisis | 13 / 18 | Preceded global financial crisis |
| Current (June 2026) | 10 / 18 | Citi retains constructive near-term equity outlook |
Manthey characterised the current environment as frothy but stopped short of describing it as outright overexuberant. Citi maintains a broadly constructive near-term equity outlook alongside the warning, a coexistence the rest of this article will explain.
When big ASX news breaks, our subscribers know first
What the checklist is and why 10 flags matters
The Citi Bear Market Checklist is an 18-point proprietary framework designed to track whether market conditions are consistent with late-cycle or pre-bear-market environments. It does not predict when a downturn will arrive. It monitors whether the conditions that have historically preceded downturns are accumulating.
The flags span multiple categories of market stress:
- Stretched asset valuations across equity markets
- Rising investor sentiment and positioning indicators
- AI-related capital expenditure and investment concentration
- Elevated IPO and broader equity issuance activity
- Credit spreads (currently flagged as a relatively benign component)
Each flag that triggers adds to a cumulative risk reading. At 10/18, the framework registers more activated conditions than at any point since the financial crisis, but fewer than half again as many as the dot-com peak.
Why the ten-flag level carries particular weight
Citi’s own historical analysis shows a specific dynamic once the count crosses 10: flags have tended to activate more rapidly. The progression from 10 to higher readings has historically accelerated rather than plateaued. This is why the current reading functions as a monitoring inflection point rather than merely an incremental update. Manthey’s note frames it explicitly: the reading does not constitute a sell signal, but it does warrant reduced willingness to buy market dips.
The U.S.-Europe gap is the sharpest regional split in the framework
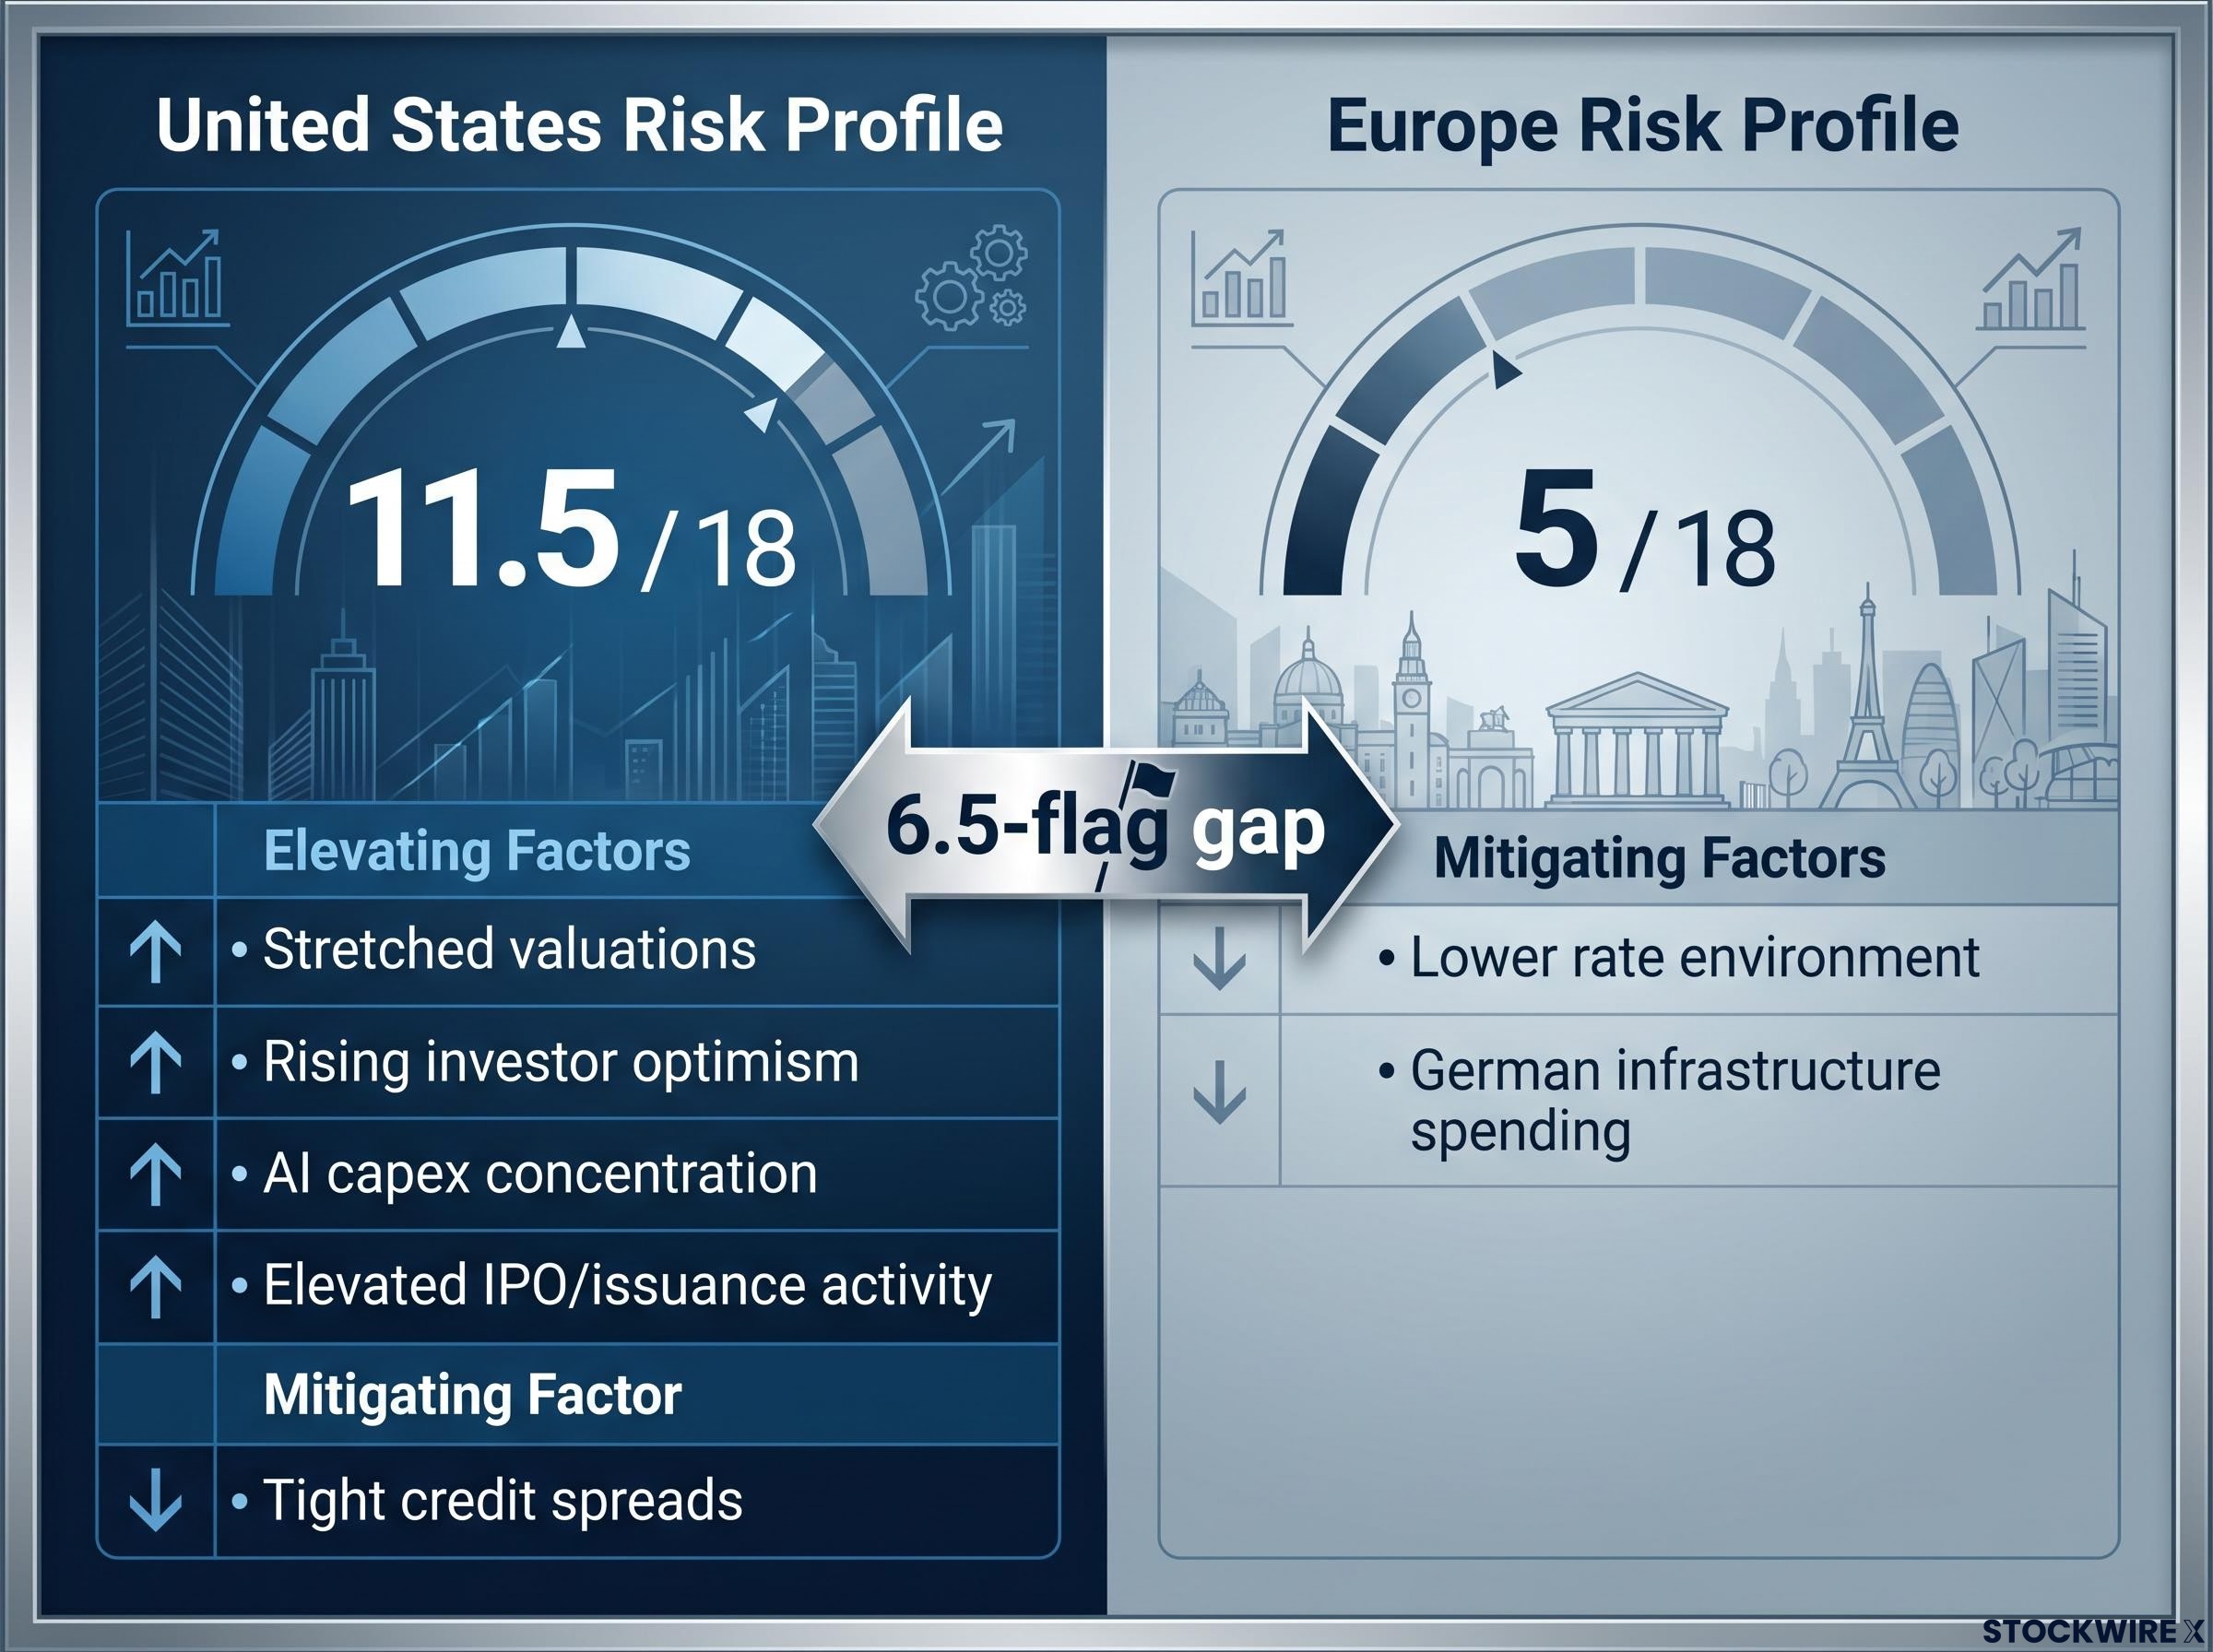
The global 10/18 figure obscures a regional divergence that may matter more for portfolio positioning. The U.S. market registered 11.5/18 flags on the same checklist. European markets registered 5/18.
The 6.5-flag gap between U.S. and European markets represents the sharpest regional divergence in Citi’s Bear Market Checklist framework.
That is not a marginal difference. It places U.S. markets in firmly elevated territory on Citi’s framework while European markets sit below the midpoint.
| Region | Checklist Reading | Key Elevating Factors | Mitigating Factors |
|---|---|---|---|
| United States | 11.5 / 18 | Stretched valuations, rising investor optimism, AI capex concentration, elevated IPO/issuance activity | Tight credit spreads (flagged as relatively favourable) |
| Europe | 5 / 18 | Fewer flags triggered across categories | Lower rate environment, German infrastructure spending |
The specific factors driving the U.S. count higher are concentrated in valuations, sentiment, and the AI-linked investment cycle. Tight credit spreads were identified by Manthey as a relatively less alarming component within the U.S. reading, a qualifier that matters because credit deterioration is typically among the final signals before a bear market materialises.
The narrowness of the current rally compounds the valuation concern: the S&P 500 sat 8.5% above its 50-day moving average in mid-May 2026 while only 47% of its constituents traded above theirs, a breadth divergence that BTIG’s Jonathan Krinsky characterised as the widest ever recorded and a condition that has preceded drawdowns of at least 7% in five of the last six comparable RSI readings.
The Allianz Global Investors European equities outlook for early 2026 identified European markets trading at a meaningful discount to U.S. equities while citing early signs of German fiscal recovery, a structural backdrop that helps explain why European markets are registering far fewer risk flags than their U.S. counterparts on frameworks like Citi’s checklist.
The bull case: why major strategists are not sounding the alarm
The constructive consensus heading into the second half of 2026 is broad. Five of the largest institutional strategists and asset managers maintain positions that favour developed-market or U.S. equities through year-end:
- Morgan Stanley: Constructive on developed-market equities led by U.S. stocks; AI spending framed as a major capital-spending cycle
- Fidelity Investments: Bull market described as largely intact; valuations reasonable relative to past technology rallies as of 11 May 2026
- Charles Schwab: Broadly constructive, with a caution on narrow leadership concentrated in AI and energy
- J.P. Morgan: Characterised the environment as “promise and pressure” without endorsing a near-term broad bear market
- Mercer: U.S. equities supported by resilient growth and AI investment; Europe benefits from lower rates and German infrastructure spending
None of these outlooks treat the elevated Citi reading as sufficient grounds for a defensive repositioning. The shared anchor across all five is AI capital expenditure.
The Citi reading does not exist in isolation: Bank of America’s Bull and Bear Indicator simultaneously hit 8.0 in late May 2026, triggering a BofA sell signal that has historically preceded average global equity declines of 2-3% within three months, with the move driven by approximately $9 billion in weekly technology inflows and fund manager cash holdings compressing to just 3.9%.
AI capex as the primary bull-case anchor
Morgan Stanley revised its combined hyperscaler capex forecast from approximately $450 billion to approximately $800 billion for 2026 and approximately $1.16 trillion for 2027. Fidelity cited approximately $700 billion in projected 2026 AI data-centre spending by Alphabet, Amazon, Meta, and Microsoft specifically. The figures are not contradictory; they reflect different scope definitions across the hyperscaler group.
The hyperscaler capex trajectory underpinning the bull case is more precisely quantified than the round figures cited in most strategic outlooks: Amazon, Microsoft, Alphabet, and Meta collectively spent $130 billion on AI capital expenditure in Q1 2026 alone, with full-year 2026 combined guidance reaching approximately $725 billion and a $1 trillion annual run rate projected for 2027, funded in part by $121 billion in debt issuance in 2025 at approximately four times the five-year average.
Mercer separately identified AI-driven investment approaching $500 billion as supportive of global growth, while explicitly flagging overinvestment risk if the build-out outpaces near-term demand. The bull case is not unconditional. It rests on the assumption that returns from AI investment will match the scale of capital deployed.
How an elevated checklist reading should reshape pullback strategy
Citi’s note contains a specific behavioural instruction alongside the data.
If further flags continue to activate, the strategy of purchasing market pullbacks becomes progressively less advisable, according to Citi’s framework.
That statement converts the checklist from a risk observation into a decision-relevant input. The question for investors is what conditions would push the count higher. Four sequential triggers stand out in the research:
- AI overinvestment materialises as spending outpaces revenue generation, a risk now flagged by Mercer, Morgan Stanley, and Fidelity
- Credit spreads widen from their current relatively tight position, removing one of the few favourable signals in the U.S. reading
- Valuations compress on an earnings miss, particularly among the narrow group of AI and energy leaders driving index-level returns
- Investor sentiment shifts from optimism to defensiveness, reversing the positioning indicators currently elevating the count
The checklist’s constructive year-end outlook and its elevated reading coexist because the framework is a risk accumulation monitor, not a market-timing instruction. Citi is not calling a bear market. It is stating that the conditions under which buying dips has historically worked are eroding.
For investors who want to move from monitoring the flag count to constructing a concrete response framework, our dedicated guide to building a market correction strategy covers the Buffett Indicator at 226.8%, the Shiller P/E above 41, Berkshire’s 14-quarter net-selling pattern under Greg Abel, and how to build a pre-researched watchlist with intrinsic value buy prices that converts an early warning into an actionable plan before conditions deteriorate further.
Ten flags, not eighteen: the distance between caution and a crisis call
The distance still matters. At 10/18 globally, the checklist sits three full flags below the pre-2008 reading and seven and a half below the dot-com peak. The framework’s own historical record does not support treating the current count as a bear-market trigger.
The core tension this article has mapped remains unresolved by design. The highest risk reading since 2008 coexists with broad institutional consensus that U.S. equities can advance through year-end 2026. Morgan Stanley, Fidelity, Schwab, J.P. Morgan, and Mercer all maintain constructive positions. Citi itself retains a positive near-term outlook.
The variables worth monitoring from here are specific: the flag count trajectory on subsequent updates, any widening in credit spreads from their current favourable position, and whether AI capital expenditure at the $700-$800 billion scale delivers on the earnings expectations now embedded in equity valuations.
Citi maintains a constructive equity outlook through year-end 2026 alongside the elevated checklist reading, framing current conditions as warranting vigilance rather than retreat.
This article is for informational purposes only and should not be considered financial advice. Investors should conduct their own research and consult with financial professionals before making investment decisions. Past performance does not guarantee future results. Financial projections referenced in this article are subject to market conditions and various risk factors.