
Most professional fund managers would not fly to an offshore oil platform in Brazil to visit a company their peers had already written off. That instinct to go anyway, and to find no other institutional investors there, is precisely what makes contrarian small cap investing both difficult and potentially rewarding.
In the Australian small cap market, sectors fall in and out of favour in predictable cycles. When ESG-driven divestment, flat commodity prices, or a run of bad headlines push an entire sector to the margins, most screeners and most institutional mandates follow suit. The result is systematic mispricing at the company level, where individual quality assets trade at discounts that have nothing to do with their underlying fundamentals.
This guide explains the real-world process behind identifying those discounts before the broader market does. Using the Karoon Energy (ASX: KAR) investment thesis as the anchor case study, and a current undisclosed ASX watch-list company as a live illustration, it translates a professional-grade contrarian methodology into a framework ASX investors can learn and apply.
Why contrarian small cap investing is harder than it looks
The apparent simplicity of buying cheap in ignored sectors conceals a genuine identification problem. Distinguishing a value trap from a mispriced quality asset requires information that screeners cannot surface: operational context, management quality, and direct evidence of whether a stock is cheap because every institutional analyst looked closely and found nothing, or because nobody looked at all.
That distinction matters. Most stocks trading at distressed valuations arrived there through mandate-driven selling, not rigorous fundamental rejection. When ESG policies, fossil fuel exclusions, or style-box constraints force institutions to sell, the resulting price level reflects portfolio policy rather than business value.
The deeper difficulty is the absence of feedback. In a sector nobody is watching, there is no consensus view to push against. No analyst upgrades to confirm the thesis. No institutional buying to validate the timing. That silence is both the opportunity and the risk.
Small cap volatility in illiquid ASX sectors is frequently a liquidity event rather than a fundamental signal, with professional managers at Fairlight, Spheria, and Wilson Asset Management each documenting drawdowns of 30% or more in 2024 on positions where underlying business quality was unchanged.
Consider the difference between these two conditions:
- Value trap indicators: Declining operational metrics, rising debt with no path to refinancing, structural industry disruption, management turnover without strategic improvement
- Systematic avoidance indicators: Mandate-driven institutional selling, sector-wide screening exclusions, flat or negative sentiment driven by macro conditions rather than company-specific deterioration, absence of recent analyst site visits or coverage initiation
When mandates move the price, not the fundamentals
ESG exclusions, fossil fuel divestment policies, and style-box mandates cause institutional selling that is disconnected from company-level analysis. When a superannuation fund commits publicly to exiting all fossil fuel holdings, it sells regardless of whether the underlying assets are high-quality or deteriorating.
The investment team behind the Karoon thesis articulated this directly: restricting activity to one investment style means outperformance is only achievable during the periods when that style is in favour, which may occur infrequently over multi-year cycles. At the time of the Karoon thesis, ESG-driven divestment and fossil fuel exclusions had created structural institutional underpricing across the oil and gas sector, a condition the team identified as an opportunity rather than a warning.
RIAA exclusion trends tracked between 2020 and 2025 show fossil fuel-related exclusions consistently ranking among the highest-growth exclusion categories across certified responsible investment products in Australia, confirming that the mandate-driven selling affecting energy stocks like Karoon was structural rather than transient.
When big ASX news breaks, our subscribers know first
The Karoon Energy case study: what a real contrarian setup looks like
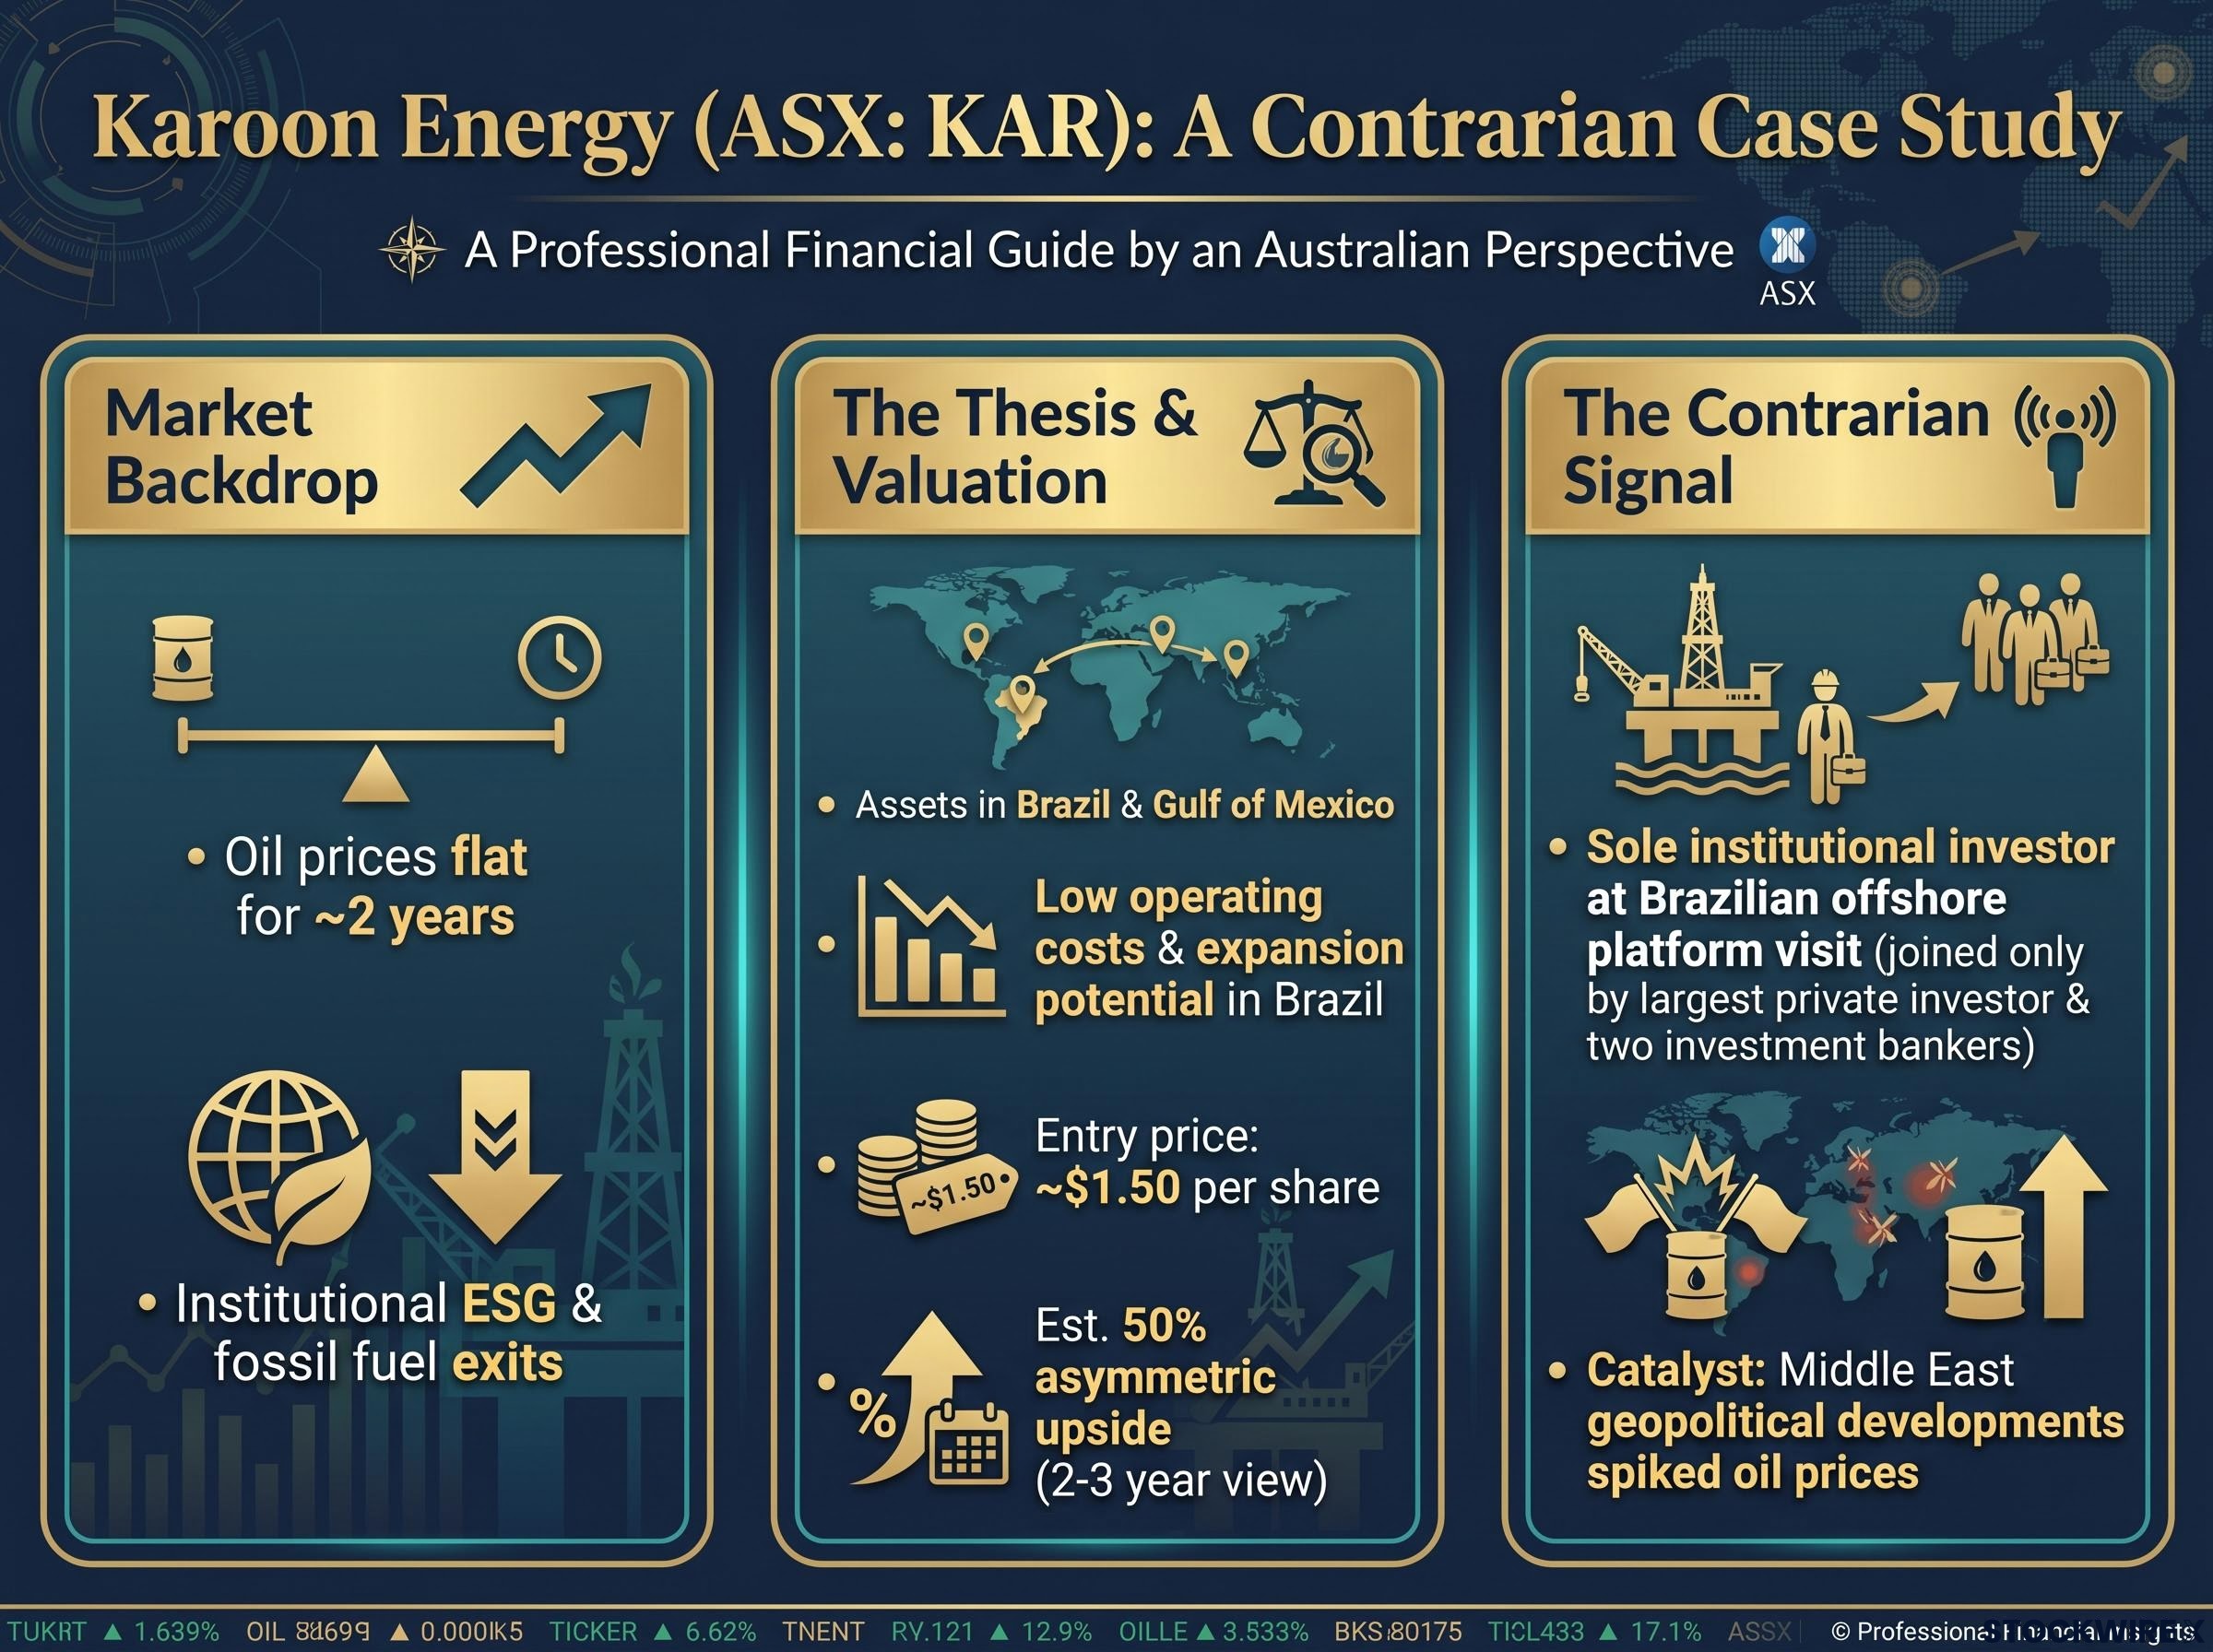
The sector backdrop came first. Oil and gas stocks were broadly out of favour. Major institutions had publicly committed to fossil fuel exits. Oil prices had remained flat for approximately two years. None of this was hidden information. It was the consensus, and it had already driven prices lower across the sector.
Within that backdrop, Karoon Energy operated offshore oil assets in Brazil and the Gulf of Mexico. The Brazilian asset stood out: low operating costs, a high-quality product with ease of sale, and expansion potential through development projects and tieback connections. The operational profile did not match the sector-wide pricing.
The investment team wrote up the thesis at an entry price of approximately $1.50 per share, estimating approximately 50% asymmetric upside on a two-to-three-year view. Operational concerns cited by analysts as barriers to investment were assessed as less severe than market pricing implied. The stock was, in the team’s assessment, priced for a worst-case outcome.
The Karoon Energy 2025 Annual Report details the Brazilian asset’s production profile and growth pipeline, providing the operational context that underpinned the original contrarian thesis and illustrating how the low-cost offshore platform characteristics identified at entry translated into financial outcomes over the subsequent period.
Then came the site visit. The team flew to the offshore platform, met operational staff and management, and found something that confirmed the thesis more clearly than any financial model could.
They were the only institutional investors on the platform. The only other visitors were the largest private investor on the register and two investment bankers. In a sector with hundreds of institutional participants, nobody else had come to look.
That absence was the signal. A subsequent spike in oil prices, linked to Middle East geopolitical developments, accelerated the thesis beyond the base-case timeline.
| Signal Type | What Was Observed | Market Interpretation | Contrarian Interpretation |
|---|---|---|---|
| Sector sentiment | Oil and gas broadly out of favour; institutional fossil fuel exits | Structural decline; avoid the sector | Mandate-driven selling creating indiscriminate discounts |
| Commodity pricing | Oil prices flat for approximately two years | No near-term catalyst for recovery | Cyclical low incorporated into entry price |
| Operational assessment | Analyst concerns about operational issues | Barriers to investment; risk too high | Concerns overstated; stock priced for worst case |
| Institutional presence | No other institutional investors at site visit | Not applicable (no one was looking) | Systematic avoidance, not rigorous rejection |
What the market misses and why: the mechanics of mispricing in small caps
Small cap stocks in unloved sectors receive less analyst coverage, fewer institutional site visits, and reduced price discovery activity. This is not a market failure in the conventional sense. It is a resource allocation decision: analysts and fund managers direct their attention toward sectors where mandates allow them to invest. Sectors excluded by policy receive proportionally less scrutiny, and mispricings can persist for extended periods without correction.
Analyst coverage gaps are most concentrated in companies below $300 million in market capitalisation, where sourcing methods developed by Warren Buffett, Seth Klarman, and Joel Greenblatt each target the same structural absence of professional attention that the four-signal framework identifies as the primary contrarian entry condition.
Screening tools amplify the neglect. When a sector’s aggregate metrics look unattractive on standard filters, even investors open to contrarian ideas may never reach the individual stock. The screener eliminates the opportunity before any analyst examines the company’s operational data.
The current undisclosed watch-list company illustrates this precisely. It operates in a sector described as among the worst-performing on the ASX, one that basic screening tools flag as unattractive and that most investors have avoided for several years. The investment team’s conservative estimate is that the company is undervalued by at least 30%, with a more optimistic assessment suggesting approximately 100% undervaluation. Early indicators of business improvement are already present but have not attracted market attention.
Reading the green shoots before the screeners do
The signals that precede a financial recovery appear in places that require primary research to find, not secondary data. These include:
- Operational commentary in management updates indicating improving conditions before revenue reflects the change
- Volume and capacity metrics trending upward before revenue inflects
- Supplier and customer relationship changes suggesting renewed commercial confidence
- Insider buying at distressed prices, signalling management conviction
These signals are not visible on a Bloomberg terminal or a stock screening platform. They emerge through site visits, management conversations, and supply chain observation, the type of work most market participants have already decided the sector does not warrant.
The four signals professional investors use to identify genuine contrarian opportunities
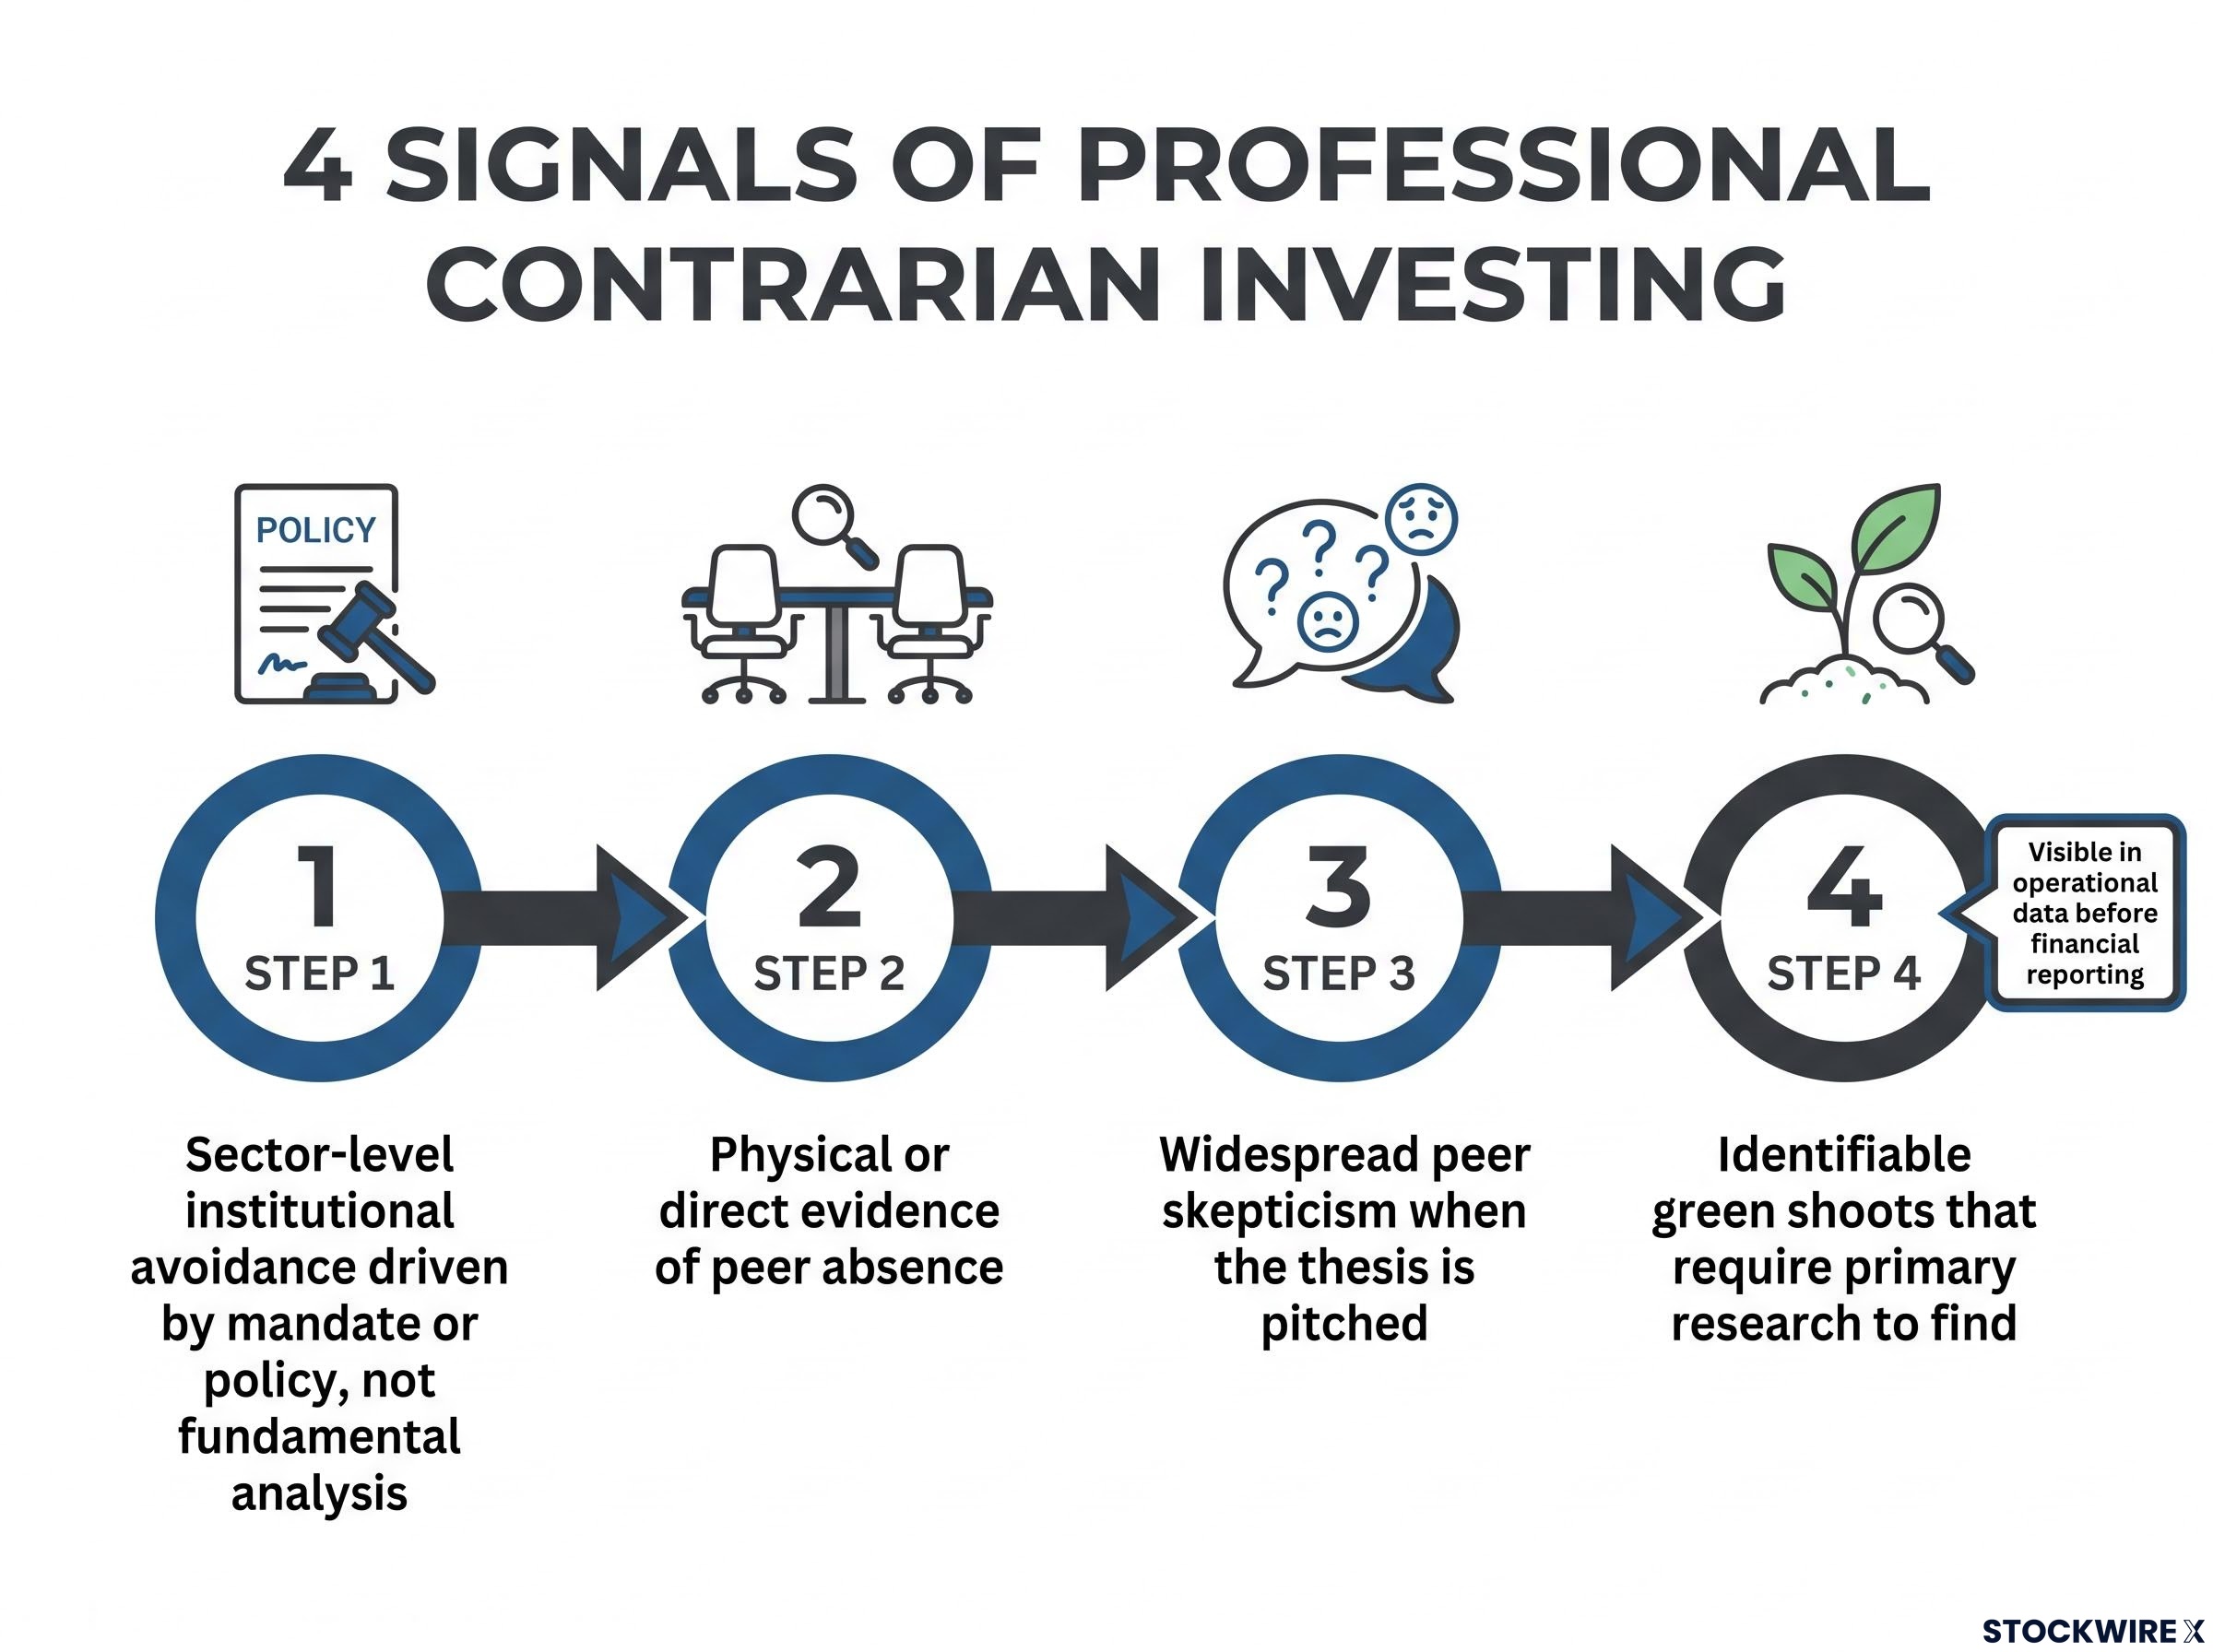
A framework for identifying contrarian setups is only useful if each signal builds on the last rather than standing in isolation. The following four signals, drawn from the Karoon thesis and the current watch-list position, form a sequential filter:
- Sector-level institutional avoidance driven by mandate or policy, not fundamental analysis. The distinction is whether institutions are absent because they analysed the sector and found nothing, or because their mandates prevent them from looking. ESG-driven fossil fuel divestment at the time of the Karoon thesis is the documented example.
- Physical or direct evidence of peer absence. Being the only institutional investor at a site visit, a management roadshow, or an industry conference confirms that the avoidance identified in Signal 1 has translated into a genuine coverage gap. The Karoon offshore platform visit is the documented example.
- Widespread peer skepticism when the thesis is pitched. The current watch-list company has been pitched to multiple investors and peers, who responded with skepticism. The investment team views this as a positive contrarian signal, given their confidence in the underlying analysis.
- Identifiable green shoots that require primary research to find. Early-stage recovery signals visible in operational data or management conversations, but not yet reflected in reported financials or analyst upgrades, confirm that the business is improving before the market prices it in.
The most counterintuitive of these signals is the third. When a well-researched thesis receives consistent pushback from informed peers, it may confirm systematic avoidance rather than fundamental weakness. The crowd’s discomfort is data.
The investment team also emphasises that multiple return pathways should be pursued from a single strong idea: extensions, derivative opportunities, and related businesses benefiting from the same underlying theme.
Avoiding the value trap: how to tell whether cheap is a gift or a warning
Every signal in the framework above is also present in genuine value traps. Sectors can be avoided for sound structural reasons. Peers can be absent because they have already done the work and passed. Green shoots can be false starts that precede further deterioration.
The distinction between mispricing and structural decline rests on a single question: is the sector temporarily unloved due to cyclical or policy conditions, or is the underlying business model being permanently disrupted? Mandate-driven selling in a sector with intact demand fundamentals creates the first condition. Technological obsolescence or irreversible regulatory change creates the second.
Management quality and capital allocation discipline are the variables that most reliably separate a temporarily beaten-down quality asset from a structurally impaired one. The Karoon thesis assessed operational concerns as overstated relative to market pricing. That judgment required direct engagement with management and operational staff, not a review of consensus estimates.
The investment team’s position on sector restrictions reinforces this point: the view that biotechnology should be avoided on grounds of lacking medical expertise is treated skeptically. Sector expertise is not necessarily required to assess business value. What is required is the analytical discipline to distinguish between a price that reflects temporary conditions and a price that reflects permanent impairment.
Investors wanting to see the value trap versus genuine mispricing distinction applied to a live ASX sector will find our dedicated guide to the ASX consumer staples contrarian thesis, which examines how Morningstar Investment Management and Franklin Templeton are separating cyclical headwinds from structural impairment in Woolworths and Orora, using the same analytical logic this framework describes.
| Value Trap Characteristics | Genuine Mispricing Characteristics |
|---|---|
| Sector facing permanent structural disruption | Sector temporarily out of favour due to cyclical or policy conditions |
| Operational metrics declining with no sign of stabilisation | Operational metrics stabilising or showing early improvement |
| Management unable to articulate a credible recovery path | Management demonstrating capital allocation discipline and strategic clarity |
| Peers absent because they analysed and rejected the opportunity | Peers absent because mandates or screening excluded the stock from consideration |
| Insider selling at distressed levels | Insider buying at distressed levels |
Why this playbook fits the ASX small cap market in particular
The ASX small cap universe is large relative to the number of active professional managers with genuine research coverage. More stocks fall into the systematically unexamined category than in deeper markets such as the US, where analyst coverage extends further down the capitalisation spectrum.
Commodity and energy cycles on the ASX regularly create the sector-level conditions this framework requires: periods of institutional mandate-driven selling followed by multi-year recoveries. These cycles are structural features of the market, not historical accidents.
The ASX small cap segment also carries specific characteristics that amplify contrarian opportunities:
- Thin institutional coverage in small caps relative to mid and large caps
- Commodity cycle volatility that drives entire sectors into and out of favour
- ESG policy-driven mandate restrictions affecting a significant portion of the listed universe
- A high proportion of single-asset or early-stage companies where operational noise creates temporary mispricings
Positioning across styles to capture the opportunity when it appears
Because contrarian setups in any one sector are infrequent, investors who restrict themselves to a single style miss the opportunity most of the time. The investment team’s recent research coverage has spanned a resources stock, a compounding business, a technology turnaround, an exploration company, an optionality play, an energy stock, and a special situation.
That breadth is deliberate. Running parallel research across styles means the framework is ready to deploy when conditions align, rather than requiring a reactive pivot. A strong investment idea should yield multiple return pathways from the single concept: extensions, derivative opportunities, and related businesses benefiting from the same underlying theme.
The contrarian edge belongs to those who do the primary work
The Karoon thesis was confirmed not by data on a terminal but by being physically present on an offshore platform and finding no peers there. The edge came from doing the work others had not.
The evidence gap between consensus data and ground-level operational reality is precisely why primary research in ASX small caps generates alpha that no screening tool can replicate; professional teams at firms such as Seneca Financial Solutions begin processing announcements from 3:00 a.m. and conduct manual reviews that AI synthesis tools structurally cannot reproduce.
The four-signal framework outlined in this guide is a starting filter, not a decision rule. Signals create a shortlist. Primary research converts that shortlist into conviction. The sequence, applied in full, looks like this:
- Identify sector-level avoidance driven by mandate or policy rather than fundamental analysis
- Confirm institutional absence through direct evidence (site visits, roadshows, coverage gaps)
- Test the thesis against peer skepticism, treating consistent pushback as data rather than discouragement
- Find the green shoots through primary research: operational signals visible before financial metrics confirm them
- Stress-test for value trap versus genuine mispricing using the management quality and structural disruption filters
The conditions described in this guide are present on the ASX right now, not just historically. The current undisclosed watch-list company, with an estimated 30-100% undervaluation, operates in precisely the type of beaten-down sector where these signals converge.
The absence of other investors is a signal, not a warning. The question is whether the work has been done to determine which one it is.
None of this framework requires institutional resources or proprietary data. It requires rigour, patience, and the willingness to look where others have decided not to.
This article is for informational purposes only and should not be considered financial advice. Investors should conduct their own research and consult with financial professionals before making investment decisions. Past performance does not guarantee future results. Valuation estimates referenced in this guide are forward-looking assessments subject to market conditions and various risk factors.