
Most investors searching for undervalued stocks begin with financial ratios: price-to-earnings, price-to-book, enterprise value to EBITDA. The investors who have actually built generational wealth start somewhere else entirely. They look where no one else is looking. The challenge of finding undervalued stocks is not primarily analytical; it is attentional. Once a stock appears on every analyst’s radar, competitive bidding has typically competed away whatever discount to intrinsic value once existed. The real question is: how do you build a pipeline of ideas before the crowd arrives? Warren Buffett, Peter Lynch, Seth Klarman, and Joel Greenblatt have each answered that question in concrete, actionable ways. Their methods differ, but they converge on the same underlying logic. This guide explains exactly where each of these four investors sources investment candidates, the specific mechanisms they use, and how readers can adapt each approach to build their own idea pipeline using tools available today.
Why the best bargains hide where mainstream attention is absent
Consider Apple. As of late 2022, approximately 26 analysts tracked its quarterly earnings per share estimates, according to Yahoo Finance. Every quarterly report is dissected in real time by dozens of institutional research teams. Every pricing anomaly is identified, modelled, and traded within hours. The probability of a retail investor finding a meaningful discount in a stock with that level of professional scrutiny is vanishingly small.
This is not a complaint about large-cap stocks. It is a structural observation about how capital markets work. When professional attention is dense, the gap between price and intrinsic value narrows. When professional attention is absent, that gap can persist for months or years. Value does not concentrate in the centre of the market where coverage is thickest. It migrates to the edges, where coverage is thin.
NBER research on analyst coverage and mispricing finds that abnormal return opportunities are most persistent in hard-to-value firms with low analyst coverage, providing empirical backing for the intuition that information asymmetry, not fundamental weakness, explains much of the discount in overlooked securities.
Howard Marks of Oaktree Capital, in 2024 commentary, framed his preferred approach as searching “where others aren’t looking,” explicitly identifying unpopular sectors, distressed credit, and regions of low investor enthusiasm as the most fertile hunting ground for mispriced assets.
This is not a personality trait. It is a structural consequence. If the reader accepts that professional coverage eliminates discounts, the only rational hunting ground is where professional coverage does not exist.
When big ASX news breaks, our subscribers know first
The foundational logic every serious value investor shares
The distinction that separates a value investor from a speculator, as articulated in the Benjamin Graham tradition, is straightforward. A speculator needs a future buyer willing to pay a higher price. A value investor does not. A value investor can profit simply by holding an asset and collecting its cash flows indefinitely. That single difference changes everything about where and how the search for opportunities begins.
If the return comes from the asset’s own cash generation rather than from reselling to someone more optimistic, then the investor does not need the crowd to agree. This means that unpopularity, obscurity, and unfashionability are not warning signs. They are hunting grounds. The absence of broad attention is what allows a genuine bargain to persist long enough to be purchased.
The Benjamin Graham tradition rests on a specific intrinsic value framework: the investor buys an asset below its calculated worth and profits from the asset’s own cash generation rather than from reselling to a more optimistic buyer, a distinction that changes everything about which candidates are worth investigating.
Peter Lynch formalised this intuition in One Up on Wall Street, identifying specific categories of companies that institutional investors systematically avoid:
- Boring or unappealing corporate names
- Businesses in sectors considered socially distasteful or mundane
- Companies operating in oil, gambling, defence, adult entertainment, or funeral services
- Firms with low or no analyst coverage
Lynch’s argument was direct: institutional reluctance to hold these stocks structurally suppresses both coverage and price, creating opportunity for investors willing to look past the discomfort.
The thread connecting Marks, Klarman, Buffett, Lynch, and Greenblatt is consistent. Opportunity is highest where attention and enthusiasm are lowest.
Four sourcing methods that have produced documented results
Each of these four investors developed a distinct mechanism for finding candidates. None of these methods is a buy signal on its own. Each is an idea-generation pipeline that feeds into subsequent fundamental analysis.
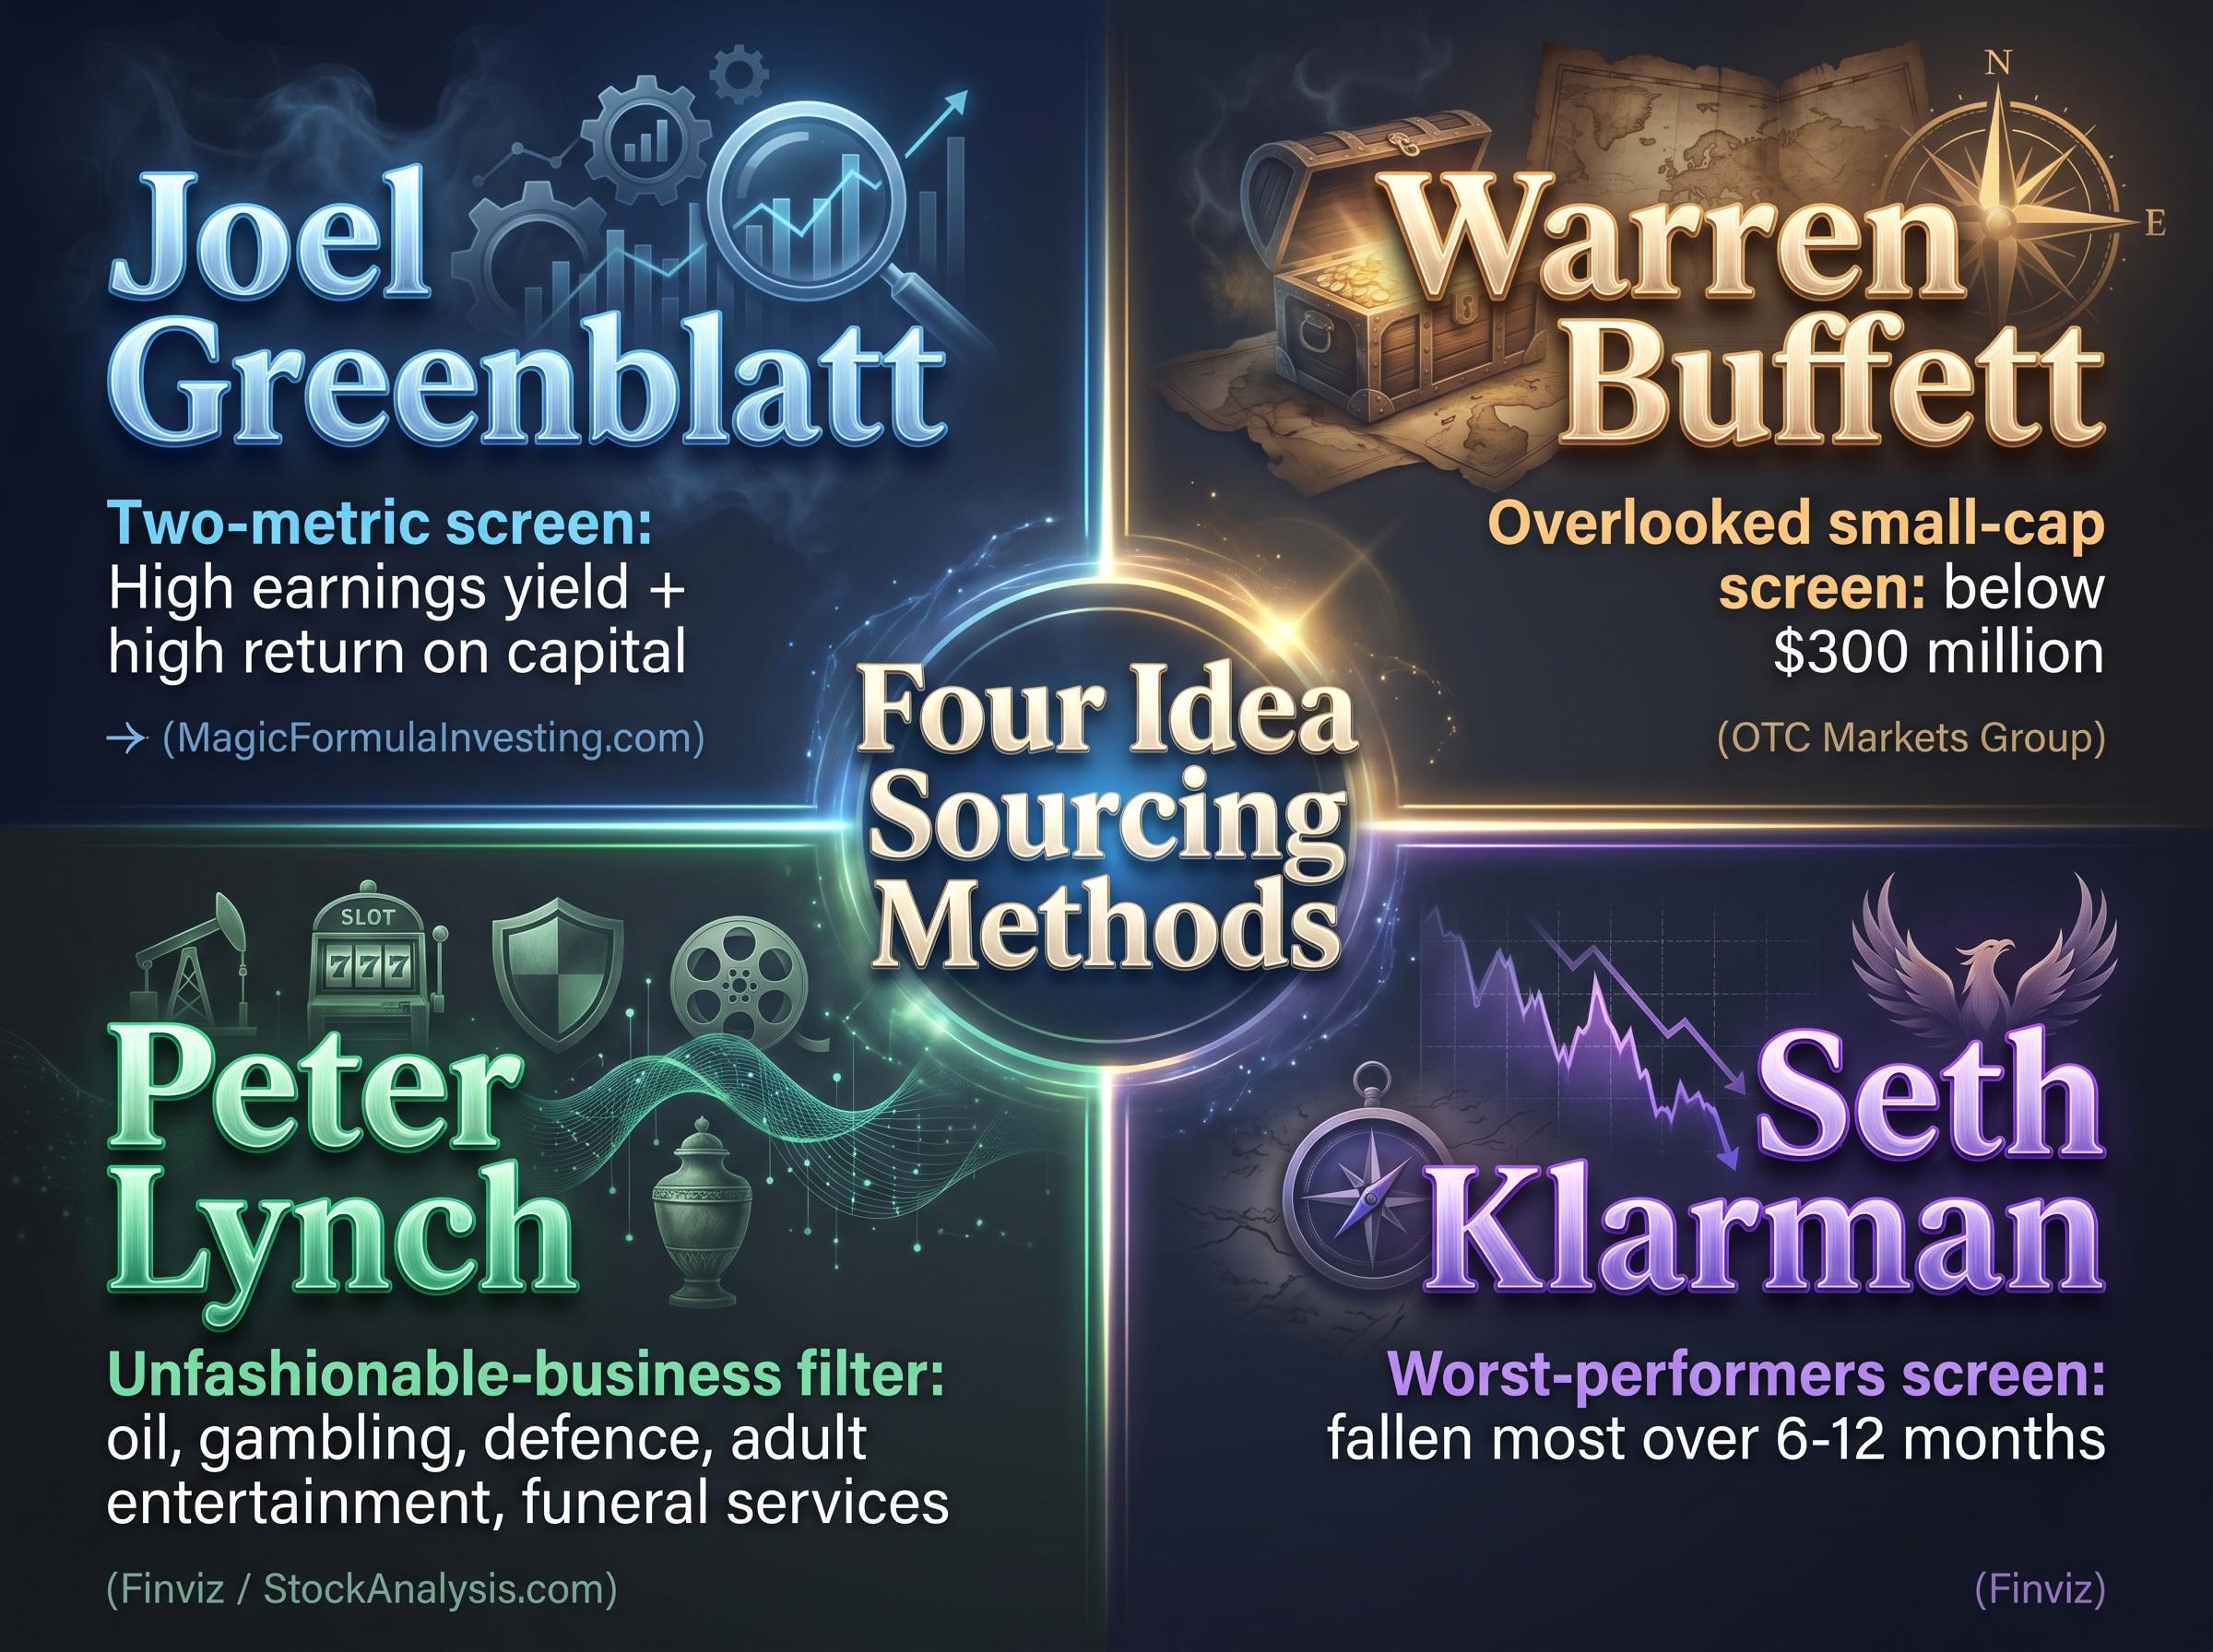
| Investor | Sourcing Mechanism | Core Logic | Modern Tool |
|---|---|---|---|
| Joel Greenblatt | Two-metric quantitative screen | High earnings yield + high return on capital identifies quality businesses at bargain prices | MagicFormulaInvesting.com |
| Warren Buffett | Overlooked small-cap screen | Securities with no analyst coverage are most likely to be mispriced | OTC Markets Group; small-cap screeners filtered below $300 million |
| Peter Lynch | Unfashionable-business filter | Institutional reluctance suppresses price in boring or objectionable sectors | Sector and coverage filters on Finviz or StockAnalysis.com |
| Seth Klarman | Worst-performers screen | Stocks that have fallen the most over 6-12 months concentrate temporary mispricings alongside genuine deterioration | 52-week-low screeners on Finviz or brokerage platforms |
Joel Greenblatt and the quantitative two-metric screen
Greenblatt’s Magic Formula, detailed in The Little Book That Beats the Market, ranks stocks simultaneously on two metrics: earnings yield (EBIT divided by enterprise value) and return on capital. Stocks that score highly on both, meaning they are both cheap relative to their earnings and efficient with the capital they deploy, surface as candidates. Certain sectors (financials and utilities) are excluded, and the portfolio is rebalanced periodically.
The public implementation is available at MagicFormulaInvesting.com, which requires no subscription for basic screening. Updated, independently audited performance data versus the S&P 500 is not publicly available in current mainstream sources, though the methodology’s long-term historical results are widely discussed in investing literature.
Warren Buffett and the overlooked-company screen
In his early career, Buffett scanned the Pink Sheets, the lower-profile venue for securities too small or thinly traded for major exchanges. He filtered for market capitalisations below approximately $100 million, targeting companies with virtually no analyst coverage.
The modern equivalent is OTC Markets Group, combined with US small-cap screens filtered below $300 million in market capitalisation. Practitioners consistently describe this threshold as the level at which analyst coverage drops sharply and the probability of finding structurally mispriced securities increases meaningfully.
Peter Lynch and the unfashionable-business filter
Lynch’s sourcing method was qualitative rather than quantitative. He looked for companies with boring names, mundane operations, and involvement in sectors that institutional investors avoided on reputational grounds: oil, gambling, defence, adult entertainment, and funeral services.
The logic was structural. If large institutions will not hold a stock for reasons unrelated to its fundamentals, the price of that stock reflects reduced demand rather than reduced value. That gap between demand-driven price and fundamental value is the opportunity.
Seth Klarman and the worst-performers screen
Klarman’s documented approach involves pulling lists of the worst-performing stocks over a prior period, typically 6 to 12 months, and using that list as a starting watchlist. The screen surfaces names that have fallen the most, concentrating both temporary setbacks and genuine structural deterioration in the same list.
The analytical work begins after the screen runs. Klarman overlays balance-sheet strength and normalised earnings on every candidate to distinguish a company experiencing a temporary setback from one in permanent decline. His focus remains on out-of-favour, cash-rich situations and complex or distressed securities. The screen is the starting point, not the conclusion.
The small-cap and micro-cap universe as a structural hunting ground
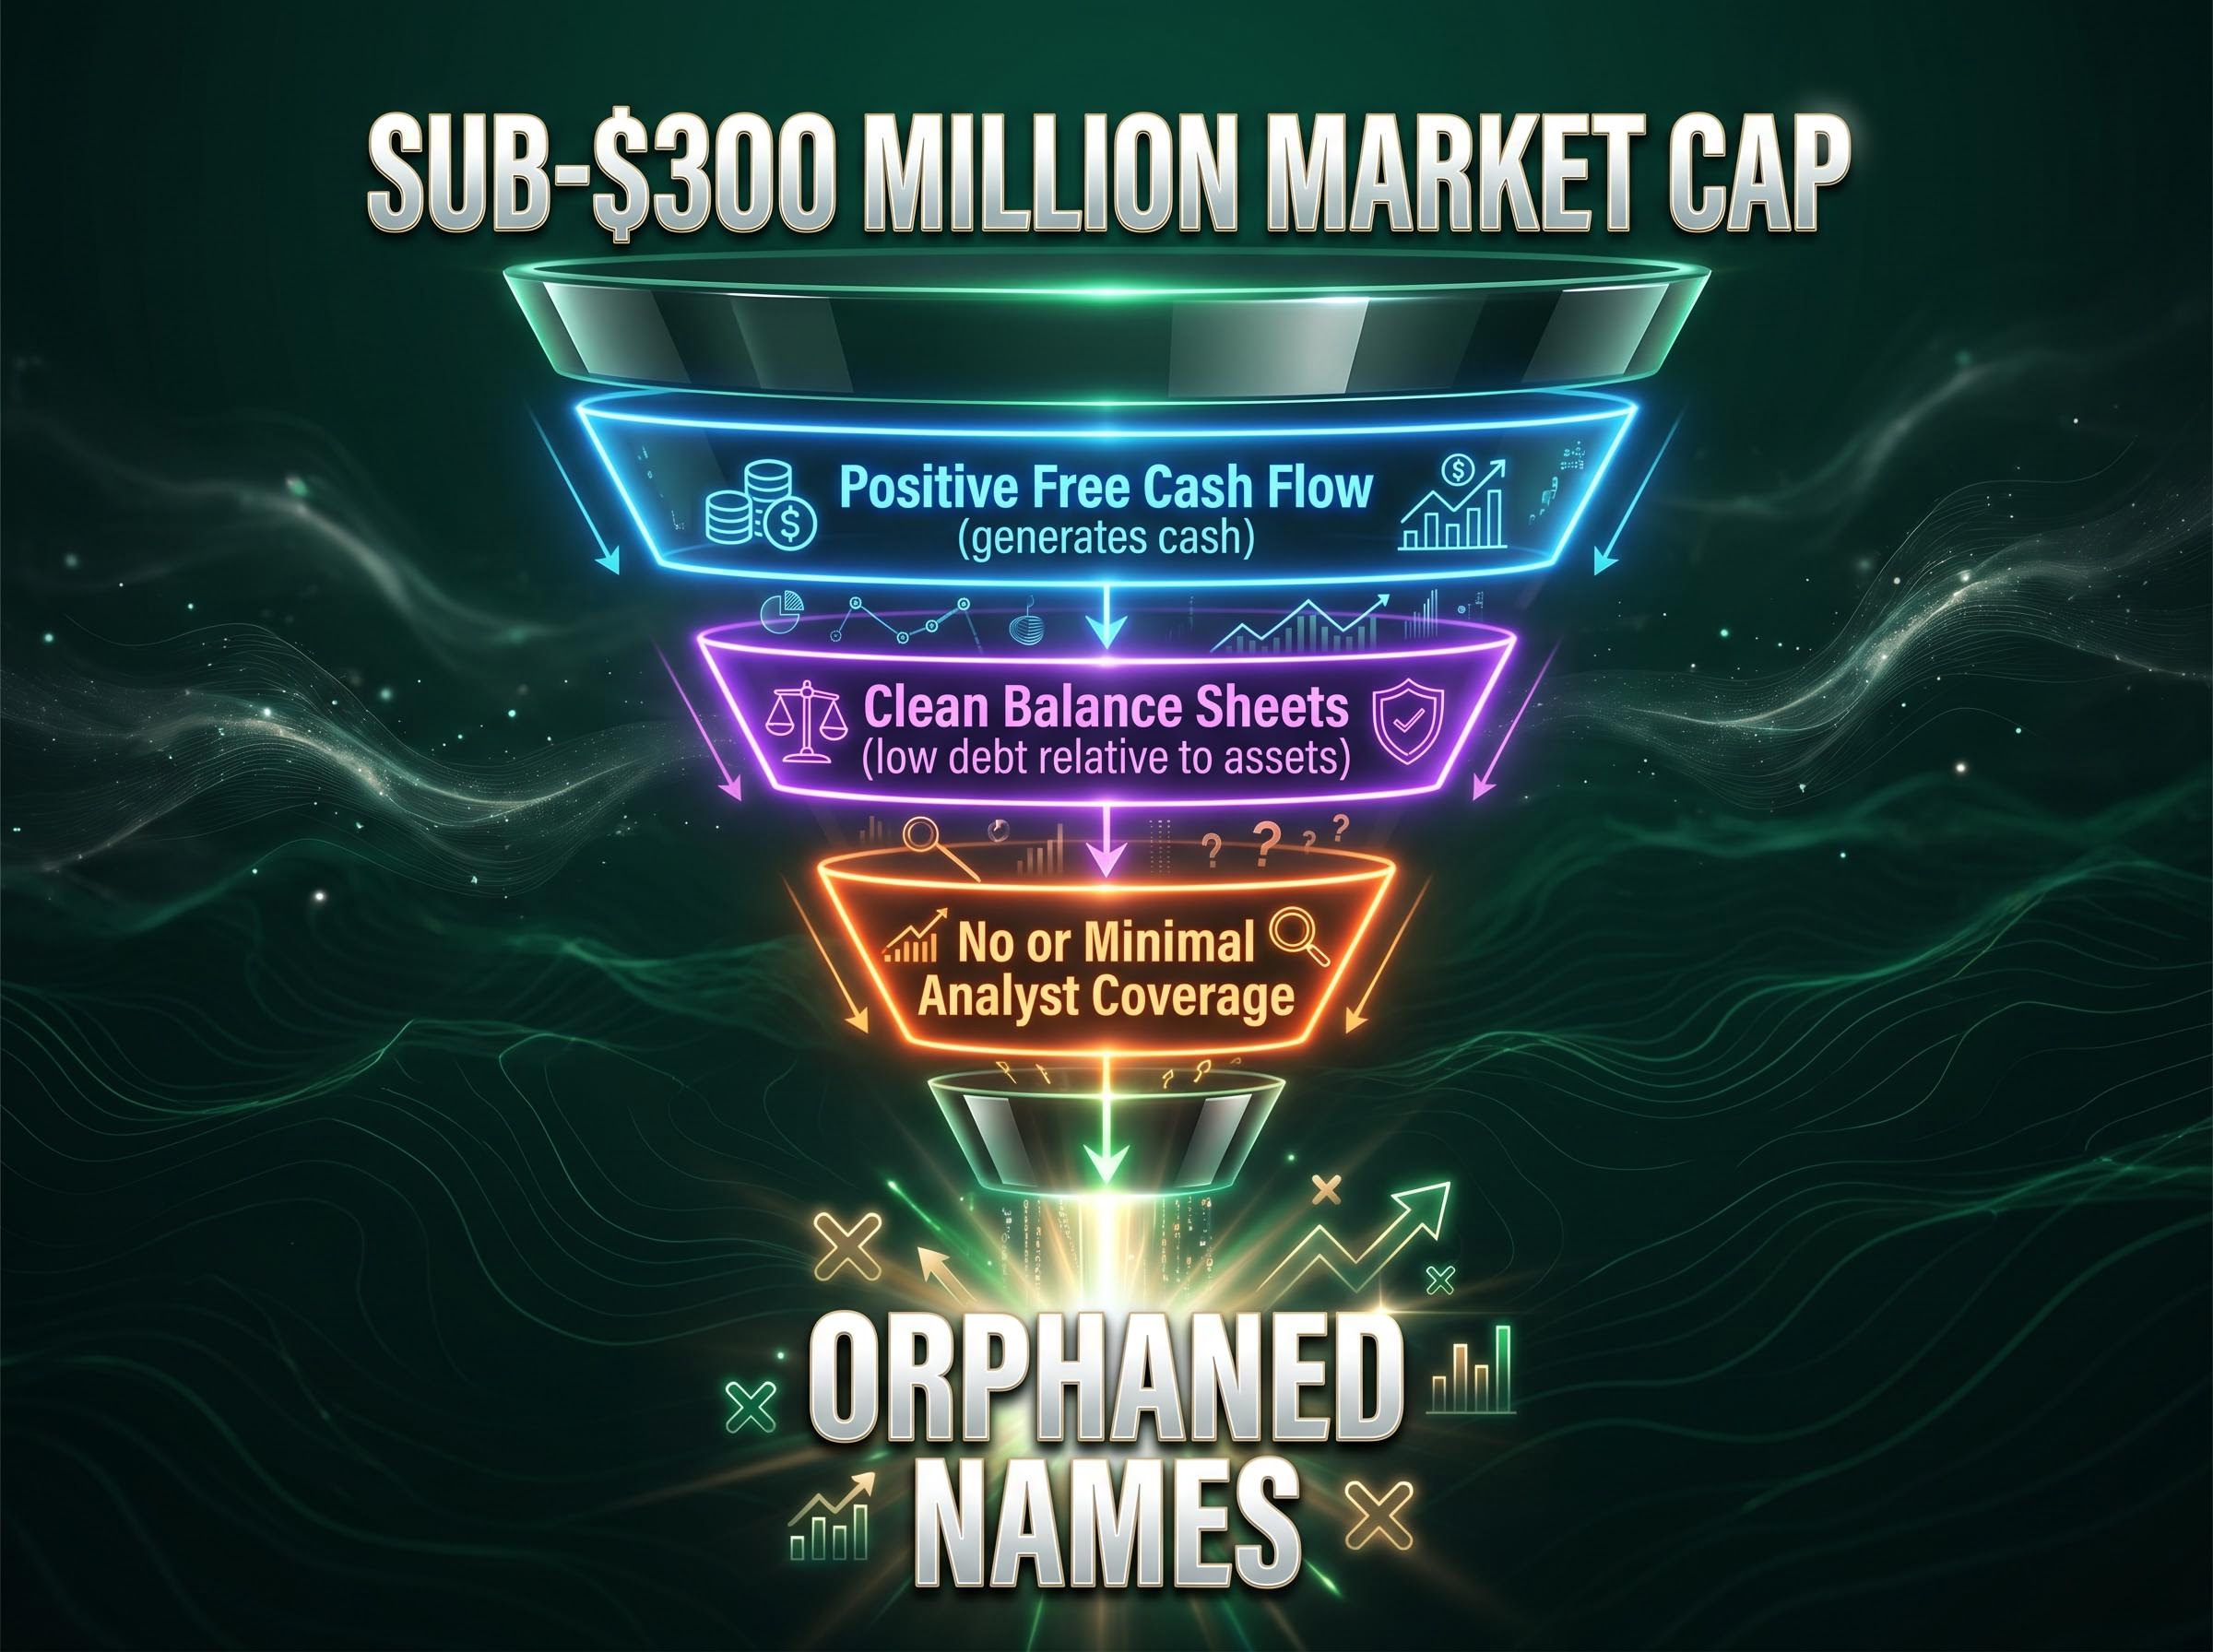
The sub-$300 million market-cap universe is not a niche preference. It is a structurally rational hunting ground, and the coverage data explains why.
The further a company falls below institutional ownership thresholds, the fewer analysts cover it. The fewer analysts cover it, the longer a gap between price and intrinsic value can persist. Practitioners consistently describe the sub-$300 million threshold as the level at which this structural neglect becomes most pronounced. Buffett’s early career exploited precisely this dynamic at the sub-$100 million level; adjusted for inflation and market-cap growth, the modern equivalent sits closer to $300 million.
Public small-cap quality has deteriorated structurally over the past decade, with nearly half of Russell 2000 companies currently unprofitable, partly because private equity buyouts remove the strongest businesses from public markets while venture capital keeps high-quality growth companies private for longer; this compression of quality within the sub-$300 million universe makes the three-criteria overlay (positive free cash flow, clean balance sheet, minimal analyst coverage) more important, not less, than it was in Buffett’s era.
The concept of “orphaned names,” securities with no or minimal sell-side coverage, captures the dynamic precisely: these are companies that the institutional research apparatus has structurally abandoned, not because the businesses lack value, but because the economics of covering them do not justify the cost.
Practitioners who screen this universe apply three criteria, typically in this order:
- Positive free cash flow: the company generates cash rather than consuming it
- Clean balance sheets: low debt relative to assets, with no near-term solvency risk
- No or minimal analyst coverage: the fewer eyes on the stock, the greater the probability that the market price has not been competed to fair value
The trade-offs are real. Liquidity constraints mean positions take longer to build and longer to exit. Limited institutional interest means price discovery is slower. These are the costs of the opportunity, and they require patience and position-sizing discipline.
Building your own idea pipeline with accessible screening tools
The four investor approaches profiled above can be operationalised using publicly available tools, most of which are free or low-cost. The process works best as a two-stage pipeline:
- Sourcing: Use screens to generate a watchlist of candidates that match one or more of the four investor approaches
- Filtering: Apply balance-sheet quality, earnings normalisation, and valuation checks to the watchlist to separate genuine candidates from value traps
The sourcing stage does the volume work. The filtering stage does the quality work. Neither replaces the other.
The sourcing stage generates candidates, but the filtering stage determines whether those candidates are genuine opportunities or value traps; the core screening metrics used in that filtering step, particularly the price-to-earnings ratio, free cash flow yield, and debt-to-equity ratio, work most reliably when applied together as overlapping filters rather than as standalone rules.
| Tool | Best Used For | Investor Approach It Mirrors |
|---|---|---|
| Finviz | Filtering by P/E, P/B, EV/EBITDA, market cap, and 52-week lows | Klarman (worst-performers screen); Lynch (small-cap, low-coverage filters) |
| MagicFormulaInvesting.com | Ranking stocks by earnings yield and return on capital | Greenblatt (Magic Formula screen) |
| GuruFocus All-in-One Screener | Piotroski F-Score, Altman Z-Score, and valuation ratios for quality-and-value filtering | Klarman (balance-sheet overlay); Buffett (quality at a discount) |
| OTC Markets Group | Scanning the sub-$100 million and sub-$300 million market-cap universe | Buffett (overlooked small-cap screen) |
| StockAnalysis.com | Detailed fundamental screener for valuation and market-cap filtering | Lynch and Buffett (under-followed small-cap identification) |
A practical starting point: run a Finviz screen for US stocks below $300 million in market capitalisation that are trading within 10% of their 52-week low, then cross-reference the results against GuruFocus for balance-sheet quality using the Piotroski F-Score. Names that pass both filters form a watchlist worth investigating further. Separately, run the MagicFormulaInvesting.com screen monthly and compare its output against the Finviz watchlist for overlap. Overlap between independent screens is a signal that a name is worth deeper fundamental work.
These screens generate starting points, not buy recommendations. The analytical work, reading annual reports, normalising earnings, assessing management quality, and estimating intrinsic value, begins after a name surfaces.
This article is for informational purposes only and should not be considered financial advice. Investors should conduct their own research and consult with financial professionals before making investment decisions.
Patience is the edge that no screener provides
Every sourcing method profiled in this guide shares one structural feature. The opportunity exists precisely because the names that surface feel uncomfortable to own. They are boring, or beaten down, or ignored, or operating in sectors that polite institutional portfolios avoid. That discomfort is not incidental to the return. It is the source of the return.
The distinction between a sourcing pipeline and a strategy matters here. The screens generate candidates. The return comes from the discipline to investigate those candidates thoroughly, wait for the price to fall below a conservative estimate of intrinsic value, and then act on ideas that most market participants have either overlooked or deliberately avoided.
A genuine value investor, in the Graham tradition, does not need the crowd to arrive at the same conclusion. The cash flows are the return. The crowd’s eventual recognition is a bonus, not a requirement.
Building a repeatable idea pipeline is a process that compounds over time. The first screen is not the end point. It is the starting habit.
Investors who want to move beyond screening into a structured, repeatable portfolio process will find our dedicated guide to building a factor portfolio walks through normalising metrics with z-scores, applying sector caps and position limits, and setting drift-based rebalancing triggers, all of which address the discipline challenges that separate investors who act on screen outputs from those who do not.
The four investors profiled here built their records over decades, not quarters. The methods are available. The tools are accessible. The edge, as it has always been, is the willingness to look where others will not and the patience to stay there.