An investor scanning headlines in late May 2026 faces two sources of anxiety arriving simultaneously. One says to sell equities before summer. The other warns that $36 trillion in federal debt is a ticking clock. Both feel urgent. Both have the weight of repetition behind them. And both, according to Ken Fisher’s investment strategy framework, fail the same analytical test.
Fisher, Founder and Co-Chief Investment Officer of Fisher Investments, used his 22 April 2026 episode to revisit two of the most durable pieces of market folklore: the “Sell in May and go away” adage and the conviction that U.S. national debt at current levels threatens equity returns. His rebuttals are not new. What makes them worth revisiting is the method underneath them, a framework for distinguishing noise from signal that applies well beyond these two cases. What follows is an examination of that method, the data supporting it, and where legitimate expert disagreement begins.
Why “Sell in May” keeps winning the argument it consistently loses in data
Every spring, the adage resurfaces. Financial commentary cycles through the same seasonal warning. Investors trim positions. And the data, once again, fails to cooperate.
Multiple 2025 institutional reviews using S&P 500 and MSCI World Index data through 2024 confirm a straightforward finding:
May-through-October returns are positive on average, not the negative-return window the adage implies.
The November-to-April half does outperform the May-to-October half historically. That much is real. But the gap does not justify the costs of systematic seasonal rotation. A 2025 MarketWatch analysis found that strict “Sell in May” strategies generally fail to deliver superior risk-adjusted performance after transaction costs and missed upside are factored in. Quant practitioner replications from 2025-2026 reached similar conclusions: any apparent seasonal edge disappears once realistic frictions and tax drag are included.
Peer-reviewed research on the Halloween effect finds that while the November-to-April seasonal pattern is statistically detectable across major indices, exploitable excess returns above a buy-and-hold benchmark disappear once transaction costs and realistic implementation frictions are accounted for, a finding consistent with the efficient market hypothesis applied to widely-known calendar rules.
Fisher’s core critique targets the mechanism of the illusion. A small number of severe negative episodes during summer months distort the perceived norm. Investors remember catastrophic drawdowns vividly and discount the many periods where staying invested produced gains. The strategy persists because of three reinforcing factors:
The persistence of ‘Sell in May’ is not a puzzle once loss aversion bias is factored in: Morningstar’s ‘Mind the Gap’ research documents a behavioural return shortfall of roughly 1-2 percentage points per year, driven by investors who sell near lows and re-enter after prices have already recovered, precisely the pattern a seasonal exit strategy reinforces.
- Psychological salience of losses: A single devastating summer (2008, 2011) weighs more heavily in memory than a dozen unremarkable ones
- Narrative simplicity: “Sell in May” is six syllables and easy to repeat, which makes it stickier than the nuanced truth
- Confirmation from outlier years: Every severe summer drawdown retroactively validates the rule for those who followed it, even though the base rate favours staying invested
The paradox resolves cleanly. The strategy attracts adherents not because it works on average, but because the occasions when it would have worked are the ones investors remember most.
When big ASX news breaks, our subscribers know first
How markets pre-price what everyone already knows
The seasonal rebuttal is specific. The principle underneath it is general, and more useful.
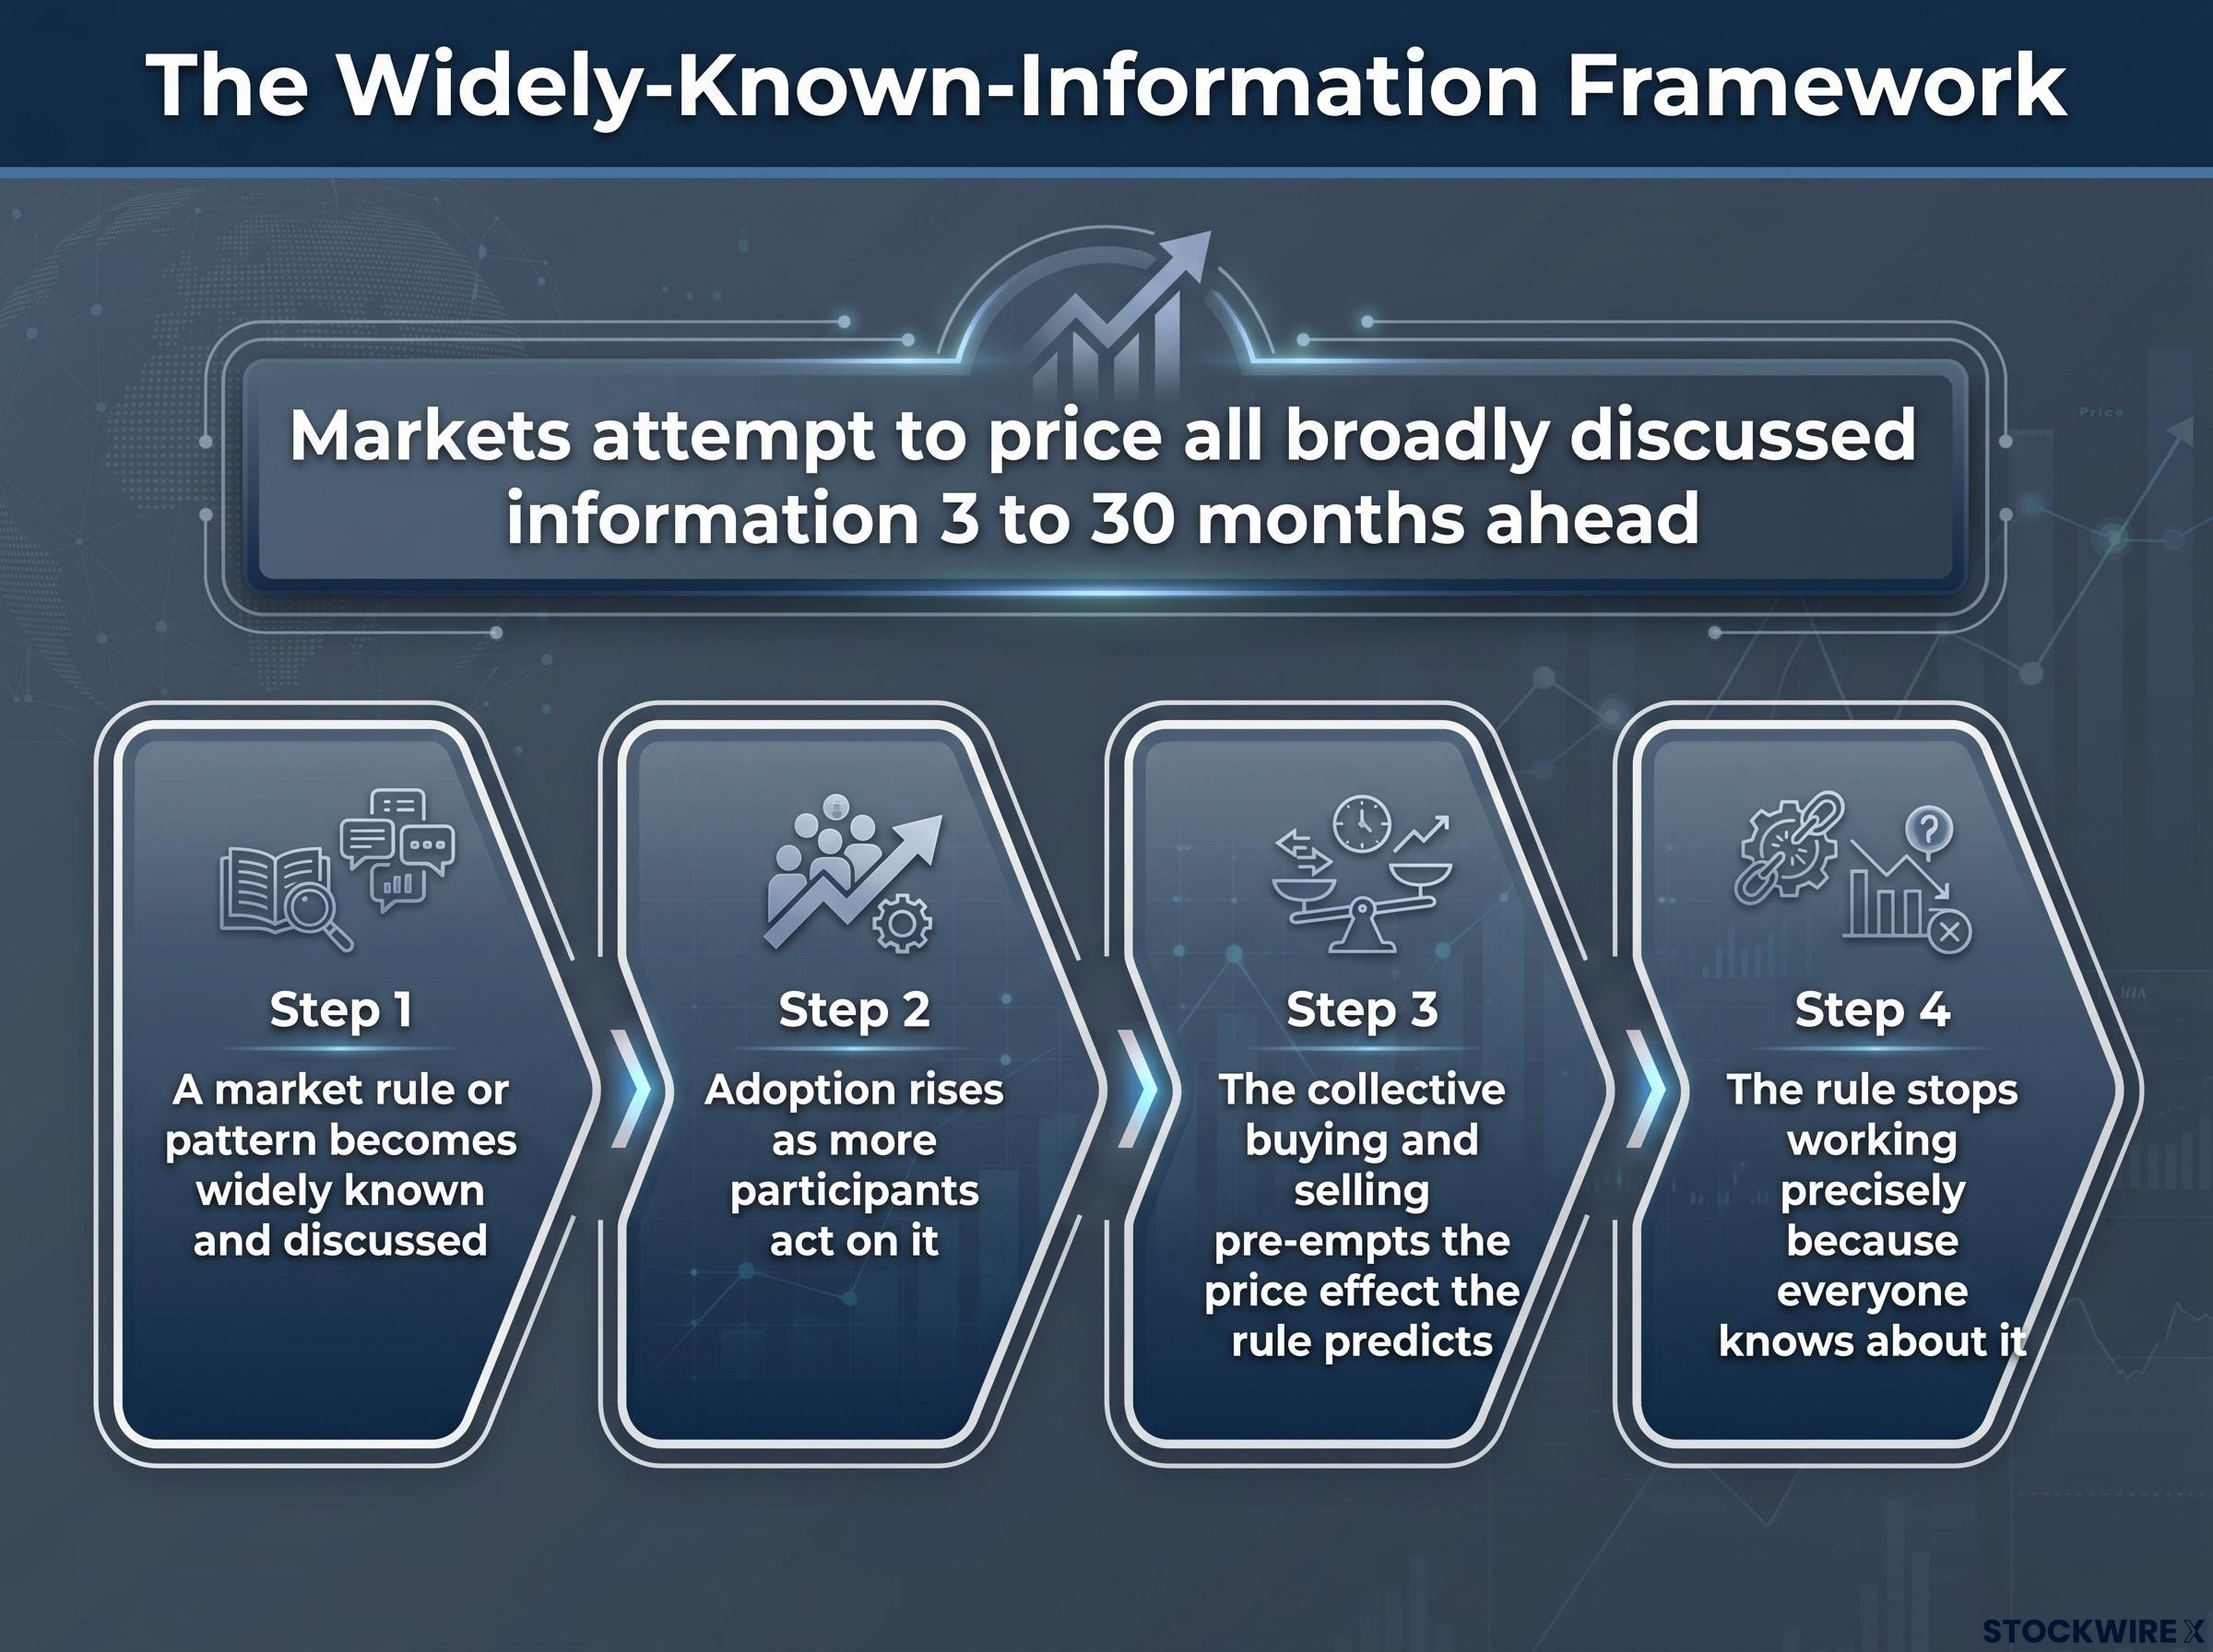
Fisher’s widely-known-information framework, articulated in the 22 April 2026 episode and in previously published books and columns, rests on a single structural claim: markets attempt to price all broadly discussed information 3 to 30 months ahead, including elections, geopolitical events, and seasonal narratives.
The logic chain runs in sequence:
- A market rule or pattern becomes widely known and discussed
- Adoption rises as more participants act on it
- The collective buying and selling pre-empts the price effect the rule predicts
- The rule stops working precisely because everyone knows about it
This is not a theoretical abstraction. It explains directly why “Sell in May” cannot function as a reliable edge. Once millions of investors have heard the adage, any exploitable seasonal pattern has already been arbitraged out of prices. Fisher’s supporting materials on this framework carry 2024 update dates, suggesting this is a durable analytical position rather than a response to a single year’s conditions.
When conventional wisdom becomes a priced-in assumption
Fisher categorises seasonal rules as conventional wisdom rather than genuine insight. The distinction matters. Following a widely repeated rule is not contrarian investing; it is joining a crowded trade with no residual edge.
Genuine investing insight, in Fisher’s framework, requires knowing something the market has not yet priced. Categorical rules repeated every May cannot provide this. The implication extends far beyond seasonality: any market narrative that feels obvious and widely shared deserves the same scepticism.
Why waiting for election clarity costs investors before the vote arrives
Fisher references a pattern he calls the “midterm miracle,” describing stock market gains that historically materialise before midterm elections, not after them. The observation carries a pointed implication.
Markets move in anticipation of outcomes, not in response to them.
An investor who reduces equity exposure ahead of a midterm election, waiting for clarity before re-entering, is making a timing bet against this pattern. By the time the post-election environment feels safe enough to warrant re-entry, the market has typically already priced the anticipated outcome and moved higher.
The 2026 midterm cycle is approaching, and Fisher’s general framework applies here. No dedicated 2026-cycle data study from Fisher Investments has been identified; the argument rests on the structural observation rather than a cycle-specific forecast. The structural implication remains: sitting in cash to avoid pre-election uncertainty has historically meant missing gains rather than avoiding losses.
Bull market cycle positioning in mid-2026 takes on additional texture from Fisher’s 28 May 2026 assessment that the current market has transitioned into early-stage euphoria within Templeton’s four-stage sentiment model, a phase that has historically extended for two or more years before cycle conclusion rather than representing an immediate exit signal.
For a U.S. investor approaching a midterm year, this reframes the instinct to reduce risk before voting day. The historical pattern suggests the cost of exiting early may exceed the cost of staying invested through the noise.
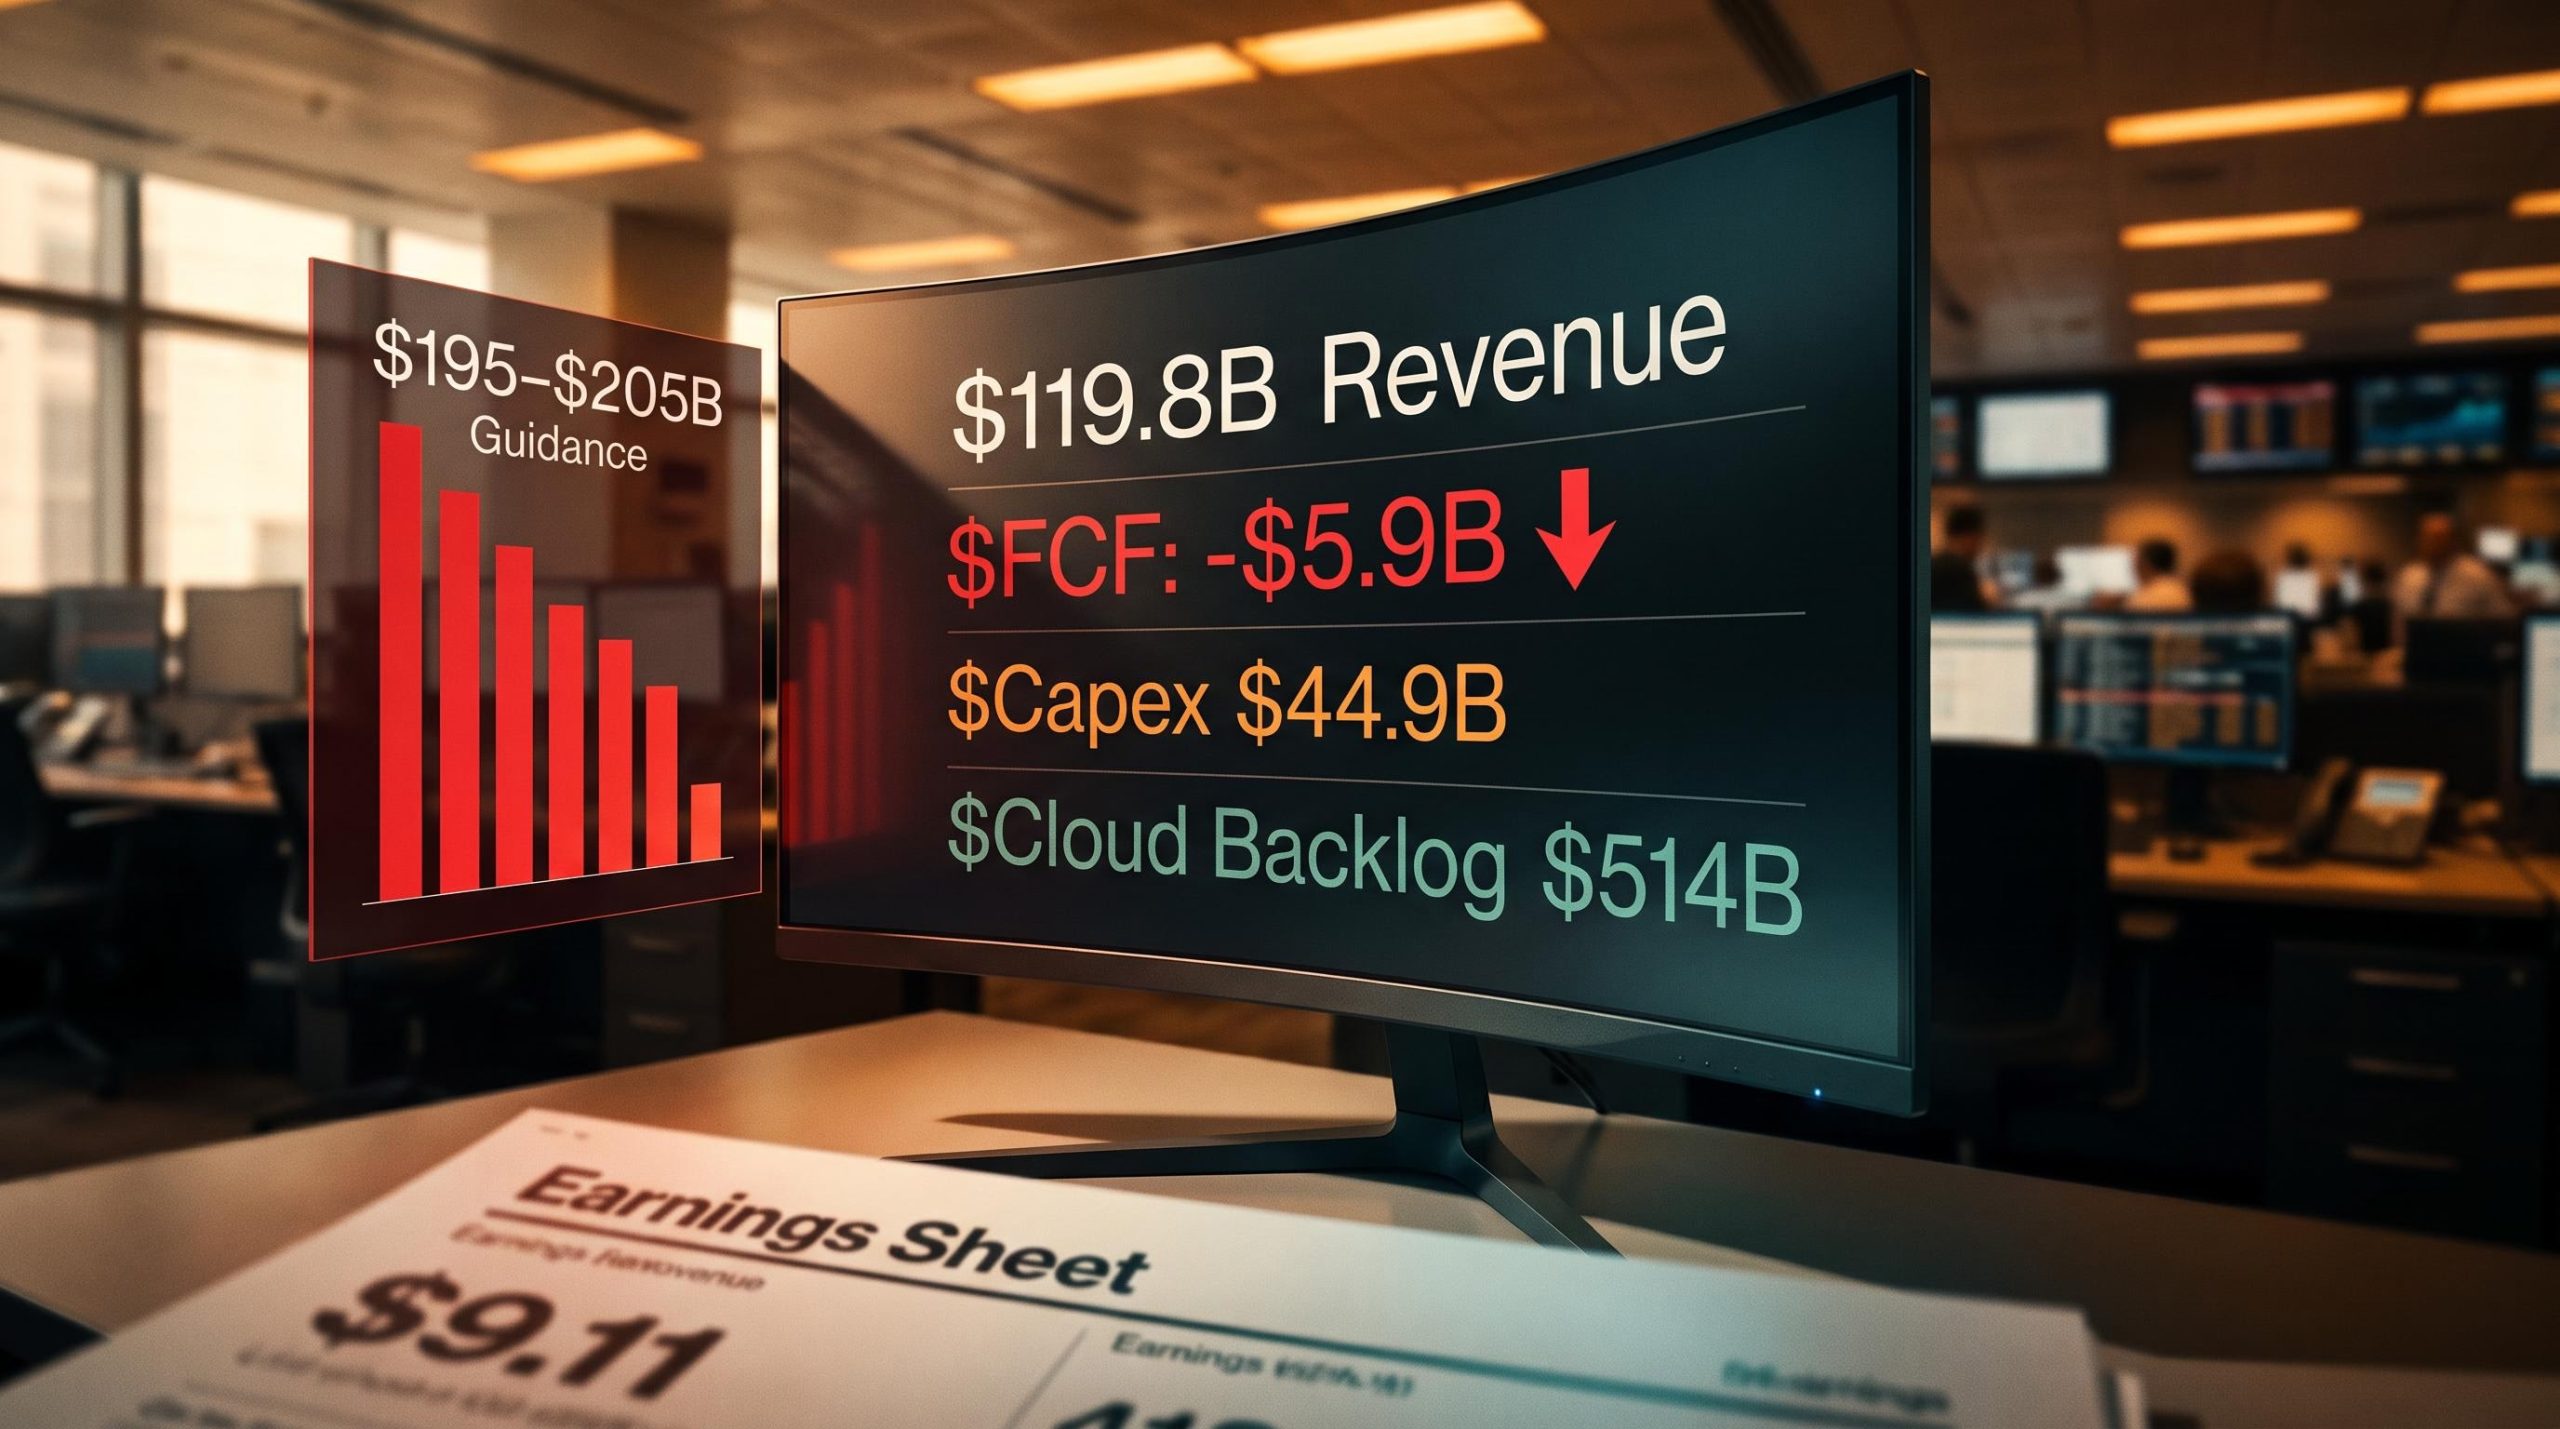
The $36 trillion question: what interest rates actually tell us about debt risk
The headline figure is designed to alarm. $35.9 trillion in total federal public debt outstanding, per the U.S. Treasury “Debt to the Penny” database as of May 2026. Some sources round to approximately $36 trillion. Fisher’s 22 April 2026 episode references approximately $38 trillion, a figure that likely reflects gross federal debt including intragovernmental holdings, a broader measurement than the Treasury’s reported total.
Regardless of which precise figure is used, the numbers are large. Fisher’s framework asks a different question: what is the market’s verdict?
| Metric | Current Figure | Source | Implication |
|---|---|---|---|
| Total federal public debt outstanding | ~$35.9 trillion | U.S. Treasury “Debt to the Penny,” May 2026 | Large in nominal terms; nominal size alone is not the operative signal |
| Federal debt held by public (% of GDP) | ~99-100% | CBO “Budget and Economic Outlook: 2026-2036” | Elevated by historical standards; CBO projects further increases |
| U.S. 10-year Treasury yield | ~4% (range 3.9-4.0%) | Treasury/Refinitiv, late May 2026 | Well below 2023-2024 peaks; consistent with continued strong demand |
Why the yield curve matters more than the debt number
Fisher’s interest-rate-based framework is direct: genuinely dangerous debt levels would force long-term interest rates materially higher, as lenders demand compensation for perceived default risk. The absence of such a rate spike is itself market evidence that investors are not pricing in near-term distress.
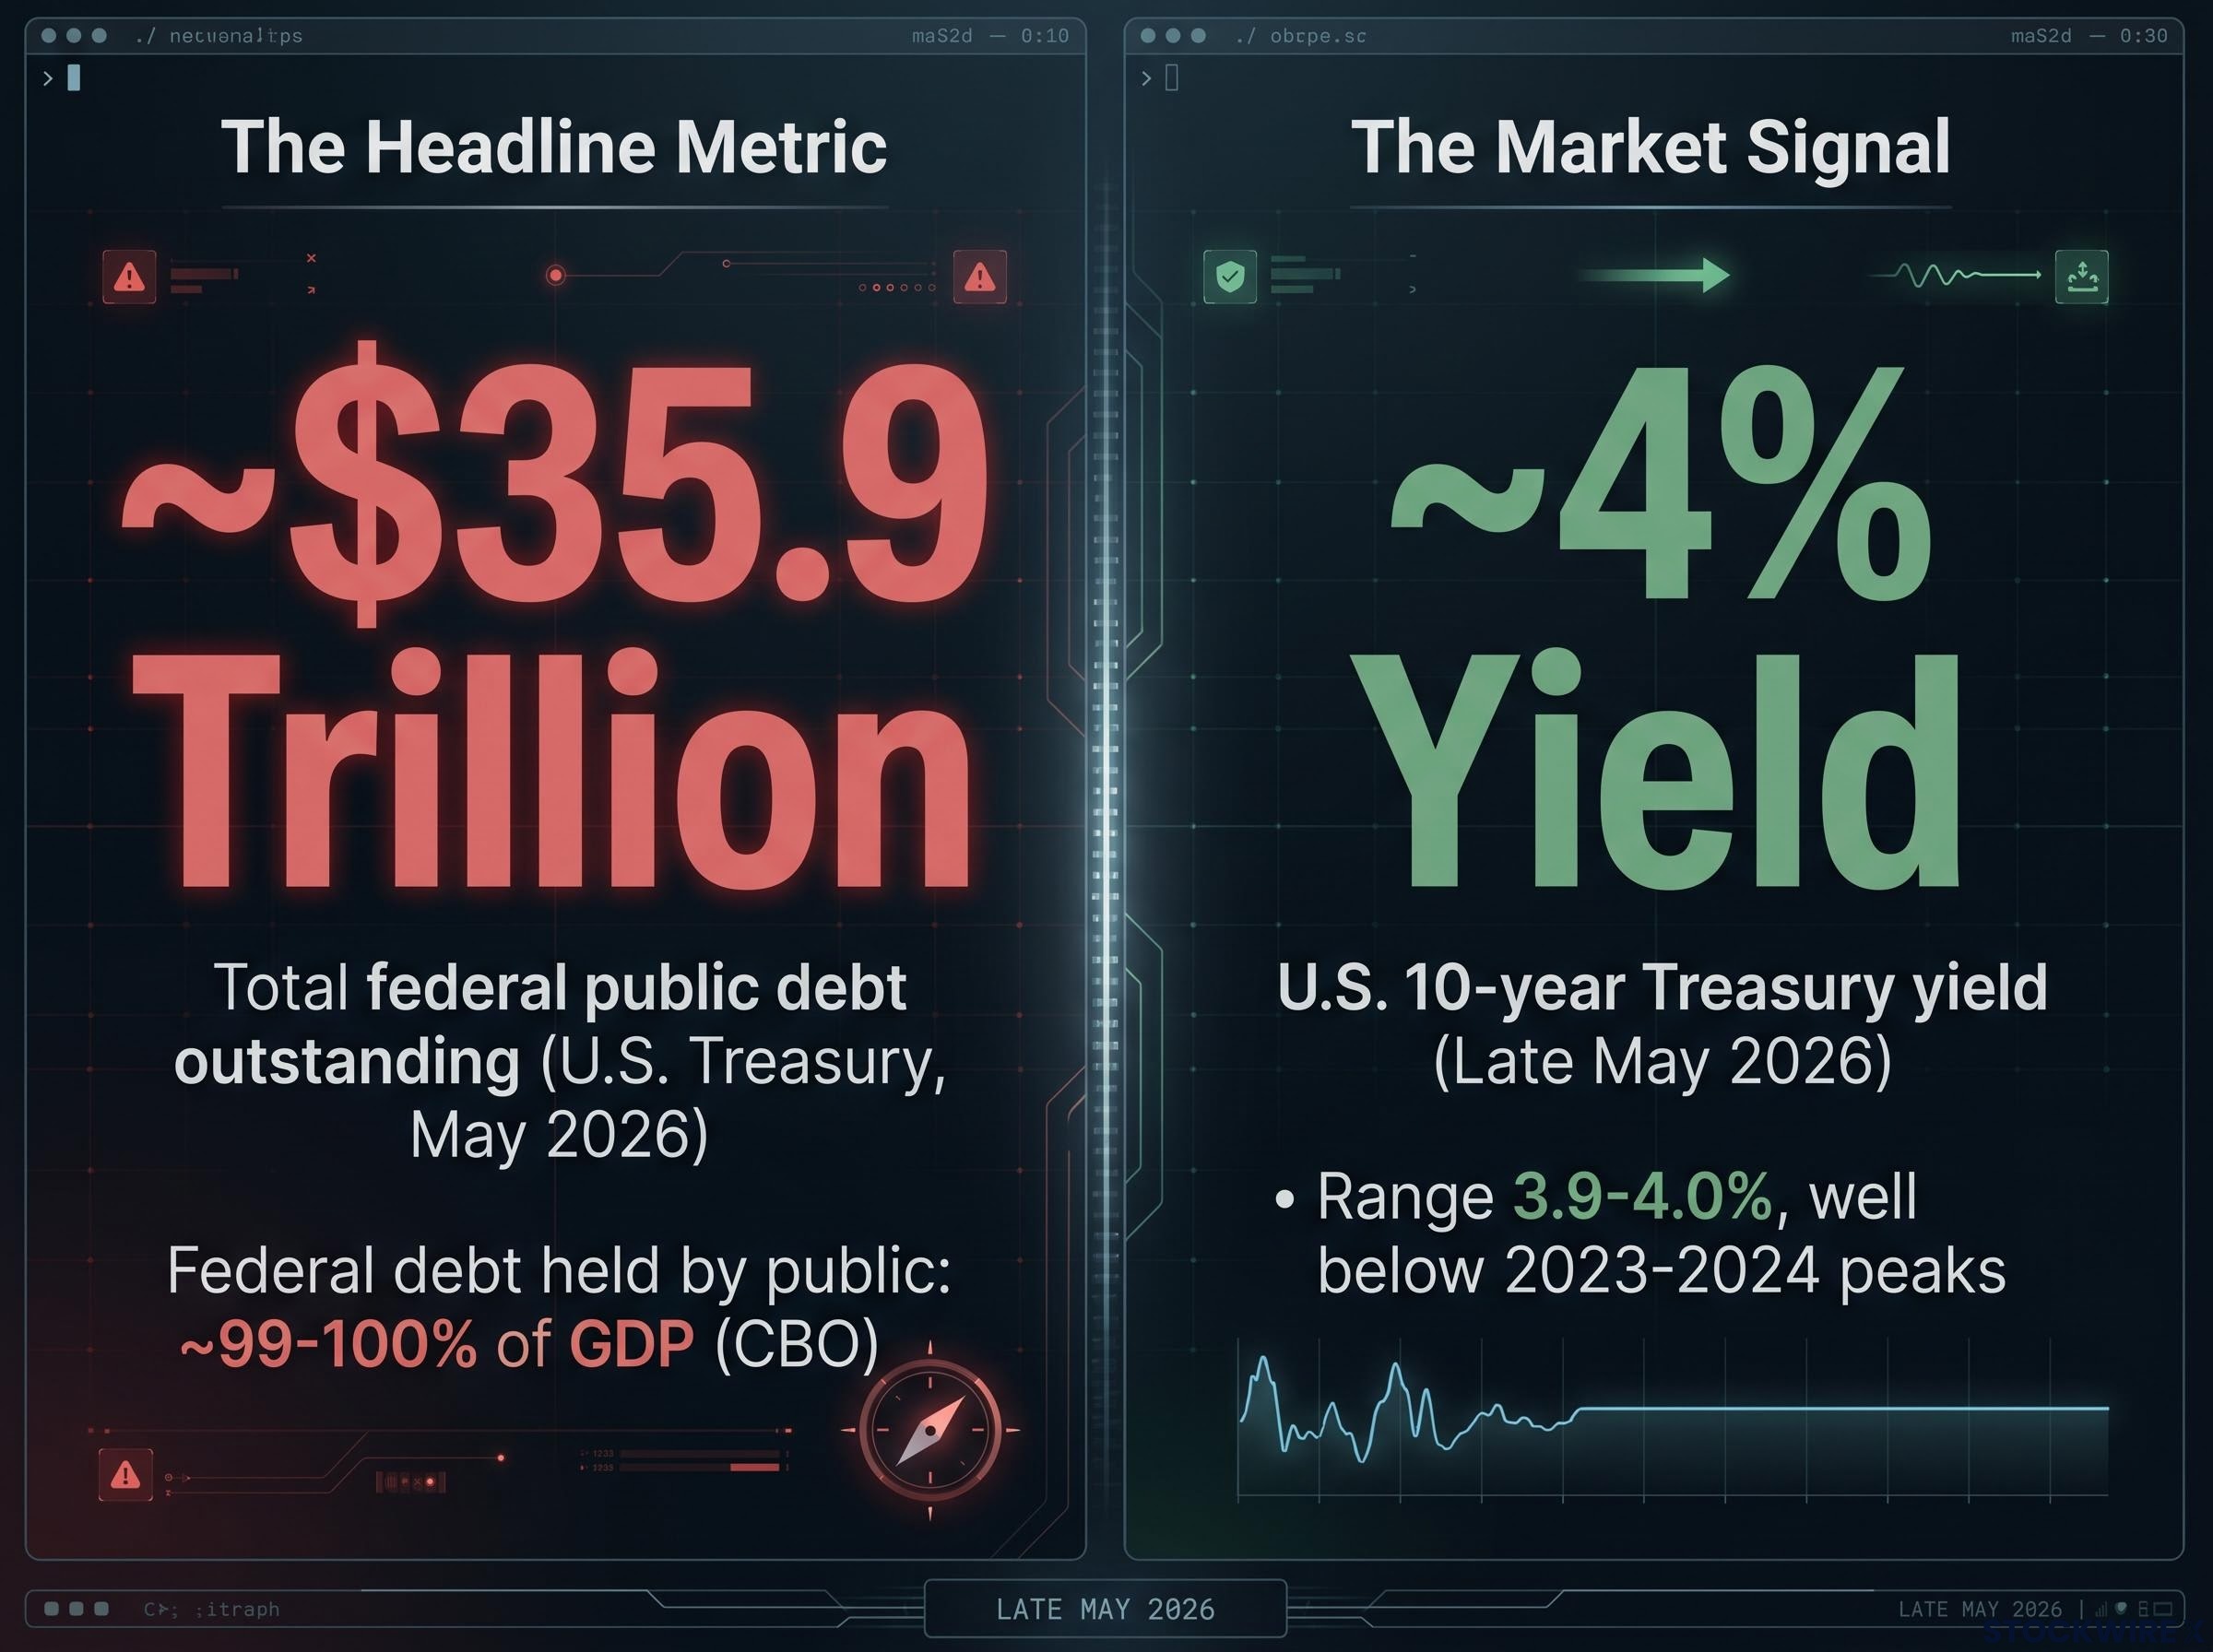
The nominal debt figure carries no time dimension. It tells an investor how much is owed but not whether the market considers repayment at risk. The 10-year Treasury yield does carry that dimension. At approximately 4% in late May 2026, well below 2023-2024 peaks, it reflects ongoing strong institutional demand, not investor alarm. A yield at this level, with debt at nearly 100% of GDP, signals that buyers of U.S. government bonds continue to view the credit as sound in the near term.
The operative signal for Fisher’s framework is not the debt ceiling headline or the nominal total. It is the yield. If long-term rates were to rise sharply toward levels consistent with risk-premium repricing, that would warrant reassessment.
Where the expert consensus lands and where it diverges from Fisher
Understanding where legitimate disagreement lives requires separating three distinct time horizons:
- Near-term (2025-2026): the current market cycle
- Medium-term (next several years): the period over which fiscal dynamics could shift market pricing
- Long-term (CBO multi-decade projections): the structural fiscal trajectory
| Source | Time Horizon | View on Debt Risk | Key Signal Cited |
|---|---|---|---|
| Jerome Powell / Federal Reserve | Long-term concern | Unsustainable trajectory; not an immediate market destabiliser | Treasurys remain world benchmark safe asset |
| Goldman Sachs / BlackRock / J.P. Morgan AM | Medium-to-long-term headwind | Not a primary near-term equity bear catalyst | Nominal yields and inflation expectations anchored |
| Mohamed El-Erian / Larry Summers | Elevated medium-term risk | Meaningful probability of yield repricing over next several years | Persistent deficits plus higher rates could erode confidence |
| IMF / OECD | Long-term structural | Strong demand persists; fiscal consolidation recommended | Mid-3% to low-4% yields consistent with orderly conditions |
The near-term consensus validates Fisher’s position. In February 2025 Congressional testimony, Jerome Powell acknowledged the unsustainable long-run path without framing it as an immediate threat. Goldman Sachs, BlackRock, and J.P. Morgan Asset Management treat debt as a structural headwind, not a 2025-2026 equity crisis trigger.
The 100% debt-to-GDP threshold carries symbolic weight but limited analytical content: the UK crossed that same threshold in September 2024 and subsequently delivered approximately 30% equity returns while retaining its Aa3 credit rating, while Japan has sustained debt above 200% of GDP since 2020, suggesting the operative question is not the ratio itself but the structural conditions that determine whether elevated debt becomes a market problem.
The medium-term picture introduces legitimate caution. Mohamed El-Erian has warned in 2025-2026 columns and interviews that persistent deficits combined with higher rates increase the probability of market repricing of U.S. sovereign risk over the next several years. Larry Summers has echoed this concern, cautioning that if markets begin to doubt fiscal discipline, yields could rise in ways that pressure both bonds and equities.
Neither calls a near-term collapse. Both identify conditions that could change the current assessment. Understanding which experts are addressing which time horizon prevents false choices: agreeing with Fisher that debt is not a near-term equity risk does not require dismissing El-Erian’s medium-term caution. Both can hold simultaneously.
Two myths, one method: how Fisher’s analytical framework applies beyond these two cases
The common thread across both Fisher arguments is structural, not topical. “Sell in May” and debt-driven market panic are both instances where widely known, widely repeated information has already been priced by markets. The narrative itself is not the investable insight.
The practical method Fisher’s framework implies runs in three steps:
- Assess whether the narrative is widely known. If the concern is on magazine covers and dominating financial commentary, the market has already absorbed it.
- Identify the market signal that would indicate the concern is being priced in. For debt, that signal is the 10-year Treasury yield. For seasonality, it is actual return data across long samples.
- Monitor that signal rather than the narrative headline. Act when the signal moves, not when the headline repeats.
The edge in investing comes from what the market has not yet priced, not from following rules everyone already knows.
Multiple independent 2025 institutional analyses of seasonal data corroborate Fisher’s “Sell in May” conclusion, strengthening the case that the rebuttal is not idiosyncratic. The 10-year yield near 4% remains the signal to watch on the debt side; Fisher’s own framework implies that a sustained move materially higher would warrant reassessment.
The method does not eliminate uncertainty. El-Erian and Summers represent scenarios where current pricing assumptions could shift. What the framework provides is a discipline for separating noise from signal, not a guarantee of outcomes.
The market myths that survive because they occasionally come true
Neither myth is a fabrication. That is precisely why both persist.
The two partial truths sustaining these narratives are worth stating plainly:
- “Sell in May” contains a real seasonal pattern: November-to-April does outperform May-to-October on average, as confirmed by 2025 S&P 500 and MSCI World analyses. The gap is real. It is simply not exploitable after costs.
- U.S. debt is on an unsustainable trajectory: The CBO “Budget and Economic Outlook: 2026-2036” projects federal debt held by the public rising from approximately 99-100% of GDP in 2026, with further increases ahead. Fisher himself does not deny that debt could become a market risk at some future point.
In his 22 April 2026 episode, Fisher acknowledged that U.S. debt levels could become problematic, characterising this as a longer-term concern rather than an immediate market threat.
The distinction between a partial truth and an actionable investment signal is the analytical skill both rebuttals are designed to sharpen. A pattern that is real but not exploitable is not a trading strategy. A fiscal trajectory that is unsustainable over decades is not a reason to sell equities this quarter. Each concern becomes actionable only when its specific market signal, return data for seasonality, yields for debt, moves in a direction that contradicts the current pricing consensus.
What a data-driven investor actually does with these two insights in mid-2026
Fisher’s two rebuttals translate into specific positioning for the current moment. Stay invested through the May-to-October window absent a specific, data-driven reason to exit. Treat the 10-year Treasury yield as the operative signal for debt concern, not debt-ceiling headlines or nominal debt totals.
The conditions that would warrant revisiting each position are identifiable:
- For seasonality: A sustained regime shift in May-to-October return data across multiple indices and multiple cycles, not one bad summer, would suggest the seasonal pattern has genuinely changed. No such shift is evident in data through 2024.
- For debt: A material, sustained rise in long-term yields above historical norms, consistent with risk-premium repricing rather than growth optimism, would signal that markets are beginning to price sovereign credit concern. The current ~4% yield does not meet that threshold.
Monitoring the debt signal in a midterm election year
Political debate about debt ceilings and fiscal policy intensifies during midterm cycles as a matter of course. This pattern should not be conflated with market-level debt distress. The rhetoric will escalate. The signal to watch is not what politicians say about the debt; it is what bond buyers do with yields.
As of late May 2026, the 10-year yield remains in a range consistent with orderly conditions, supported by continued institutional demand. The 2025-2026 consensus from the Federal Reserve, Goldman Sachs, BlackRock, and J.P. Morgan Asset Management reinforces this reading: near-term equity and bond markets are not in acute debt-driven danger. The CBO’s long-run projection and the medium-term caution from El-Erian and Summers represent the honest framing for what could change that assessment over the coming years.
The broader discipline Fisher’s framework implies will outlast both myths. The next widely circulated market anxiety will require the same test: is the concern already priced, and what specific signal would confirm it is becoming a genuine risk? The method is more durable than any single conclusion it produces.
Investors who want to understand what a genuine yield-driven reassessment could look like in practice will find our deep-dive into the 5.25% Treasury yield threshold, which examines how the 30-year briefly exceeded 5.19% in May 2026, what institutional allocators say about the 5.25% inflection point, and how sector rotation across healthcare, energy, and utilities is already responding to the repricing.
This article is for informational purposes only and should not be considered financial advice. Investors should conduct their own research and consult with financial professionals before making investment decisions. Past performance does not guarantee future results. Financial projections are subject to market conditions and various risk factors.