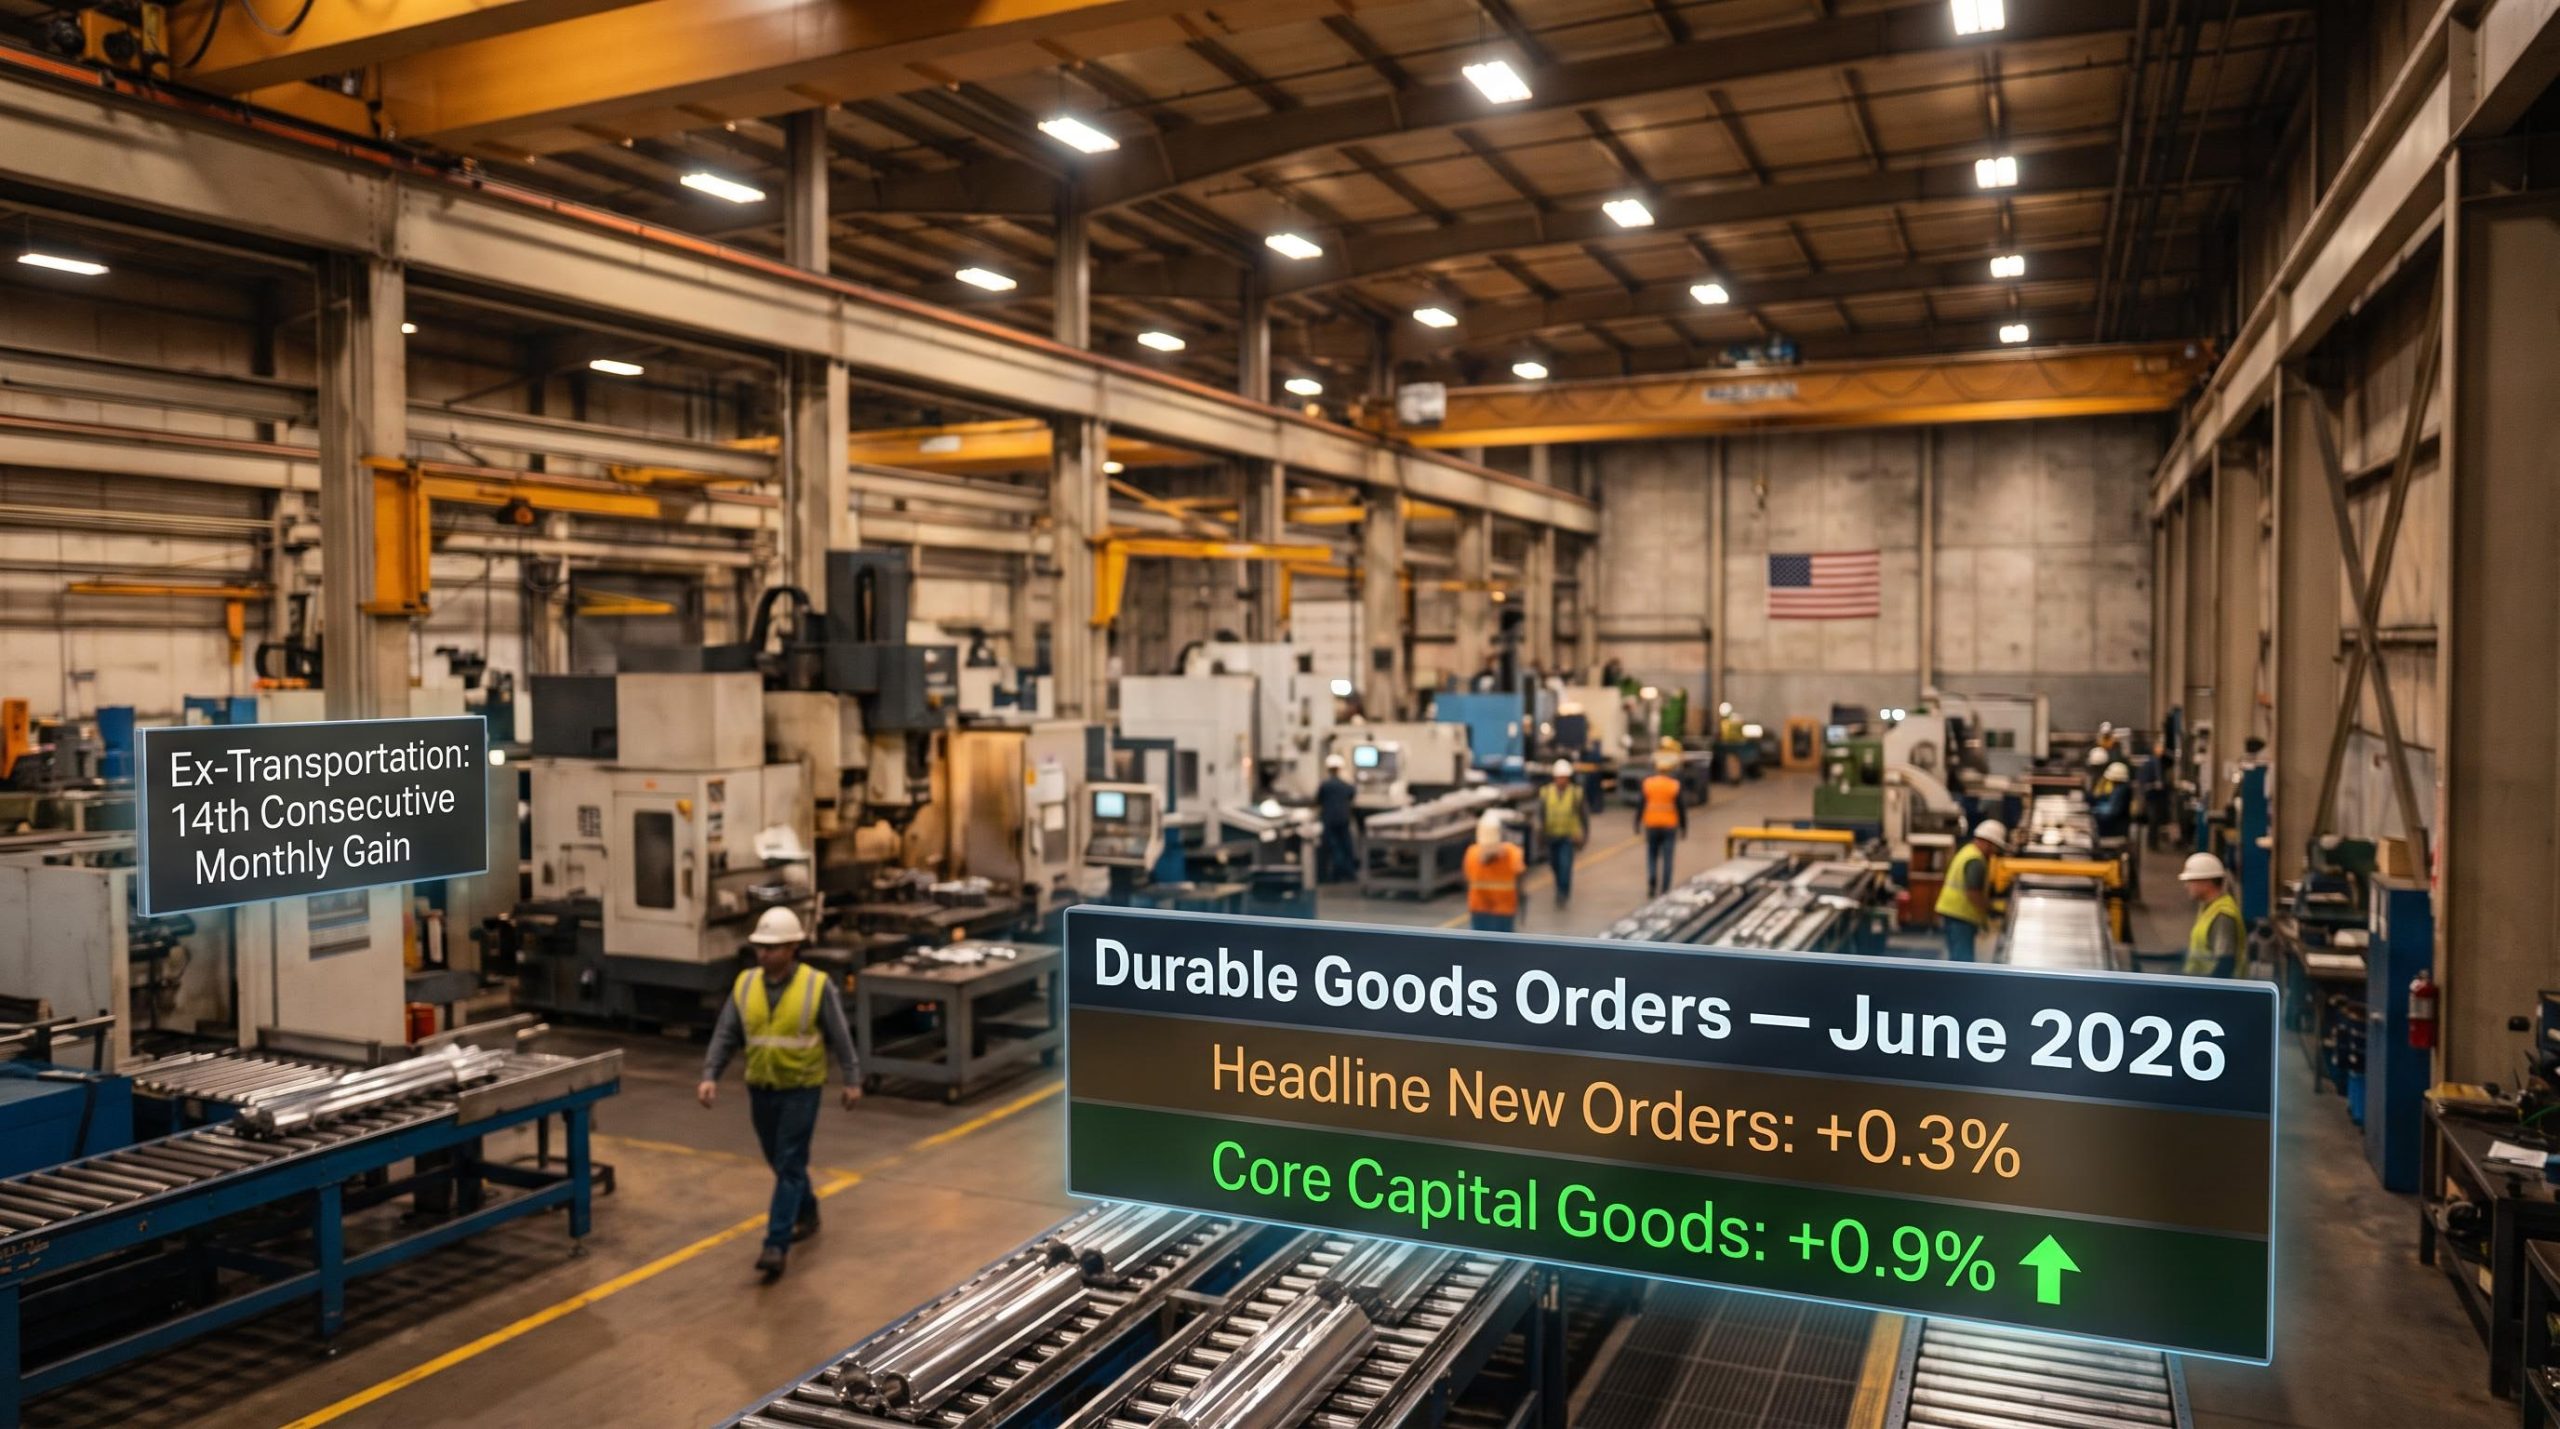
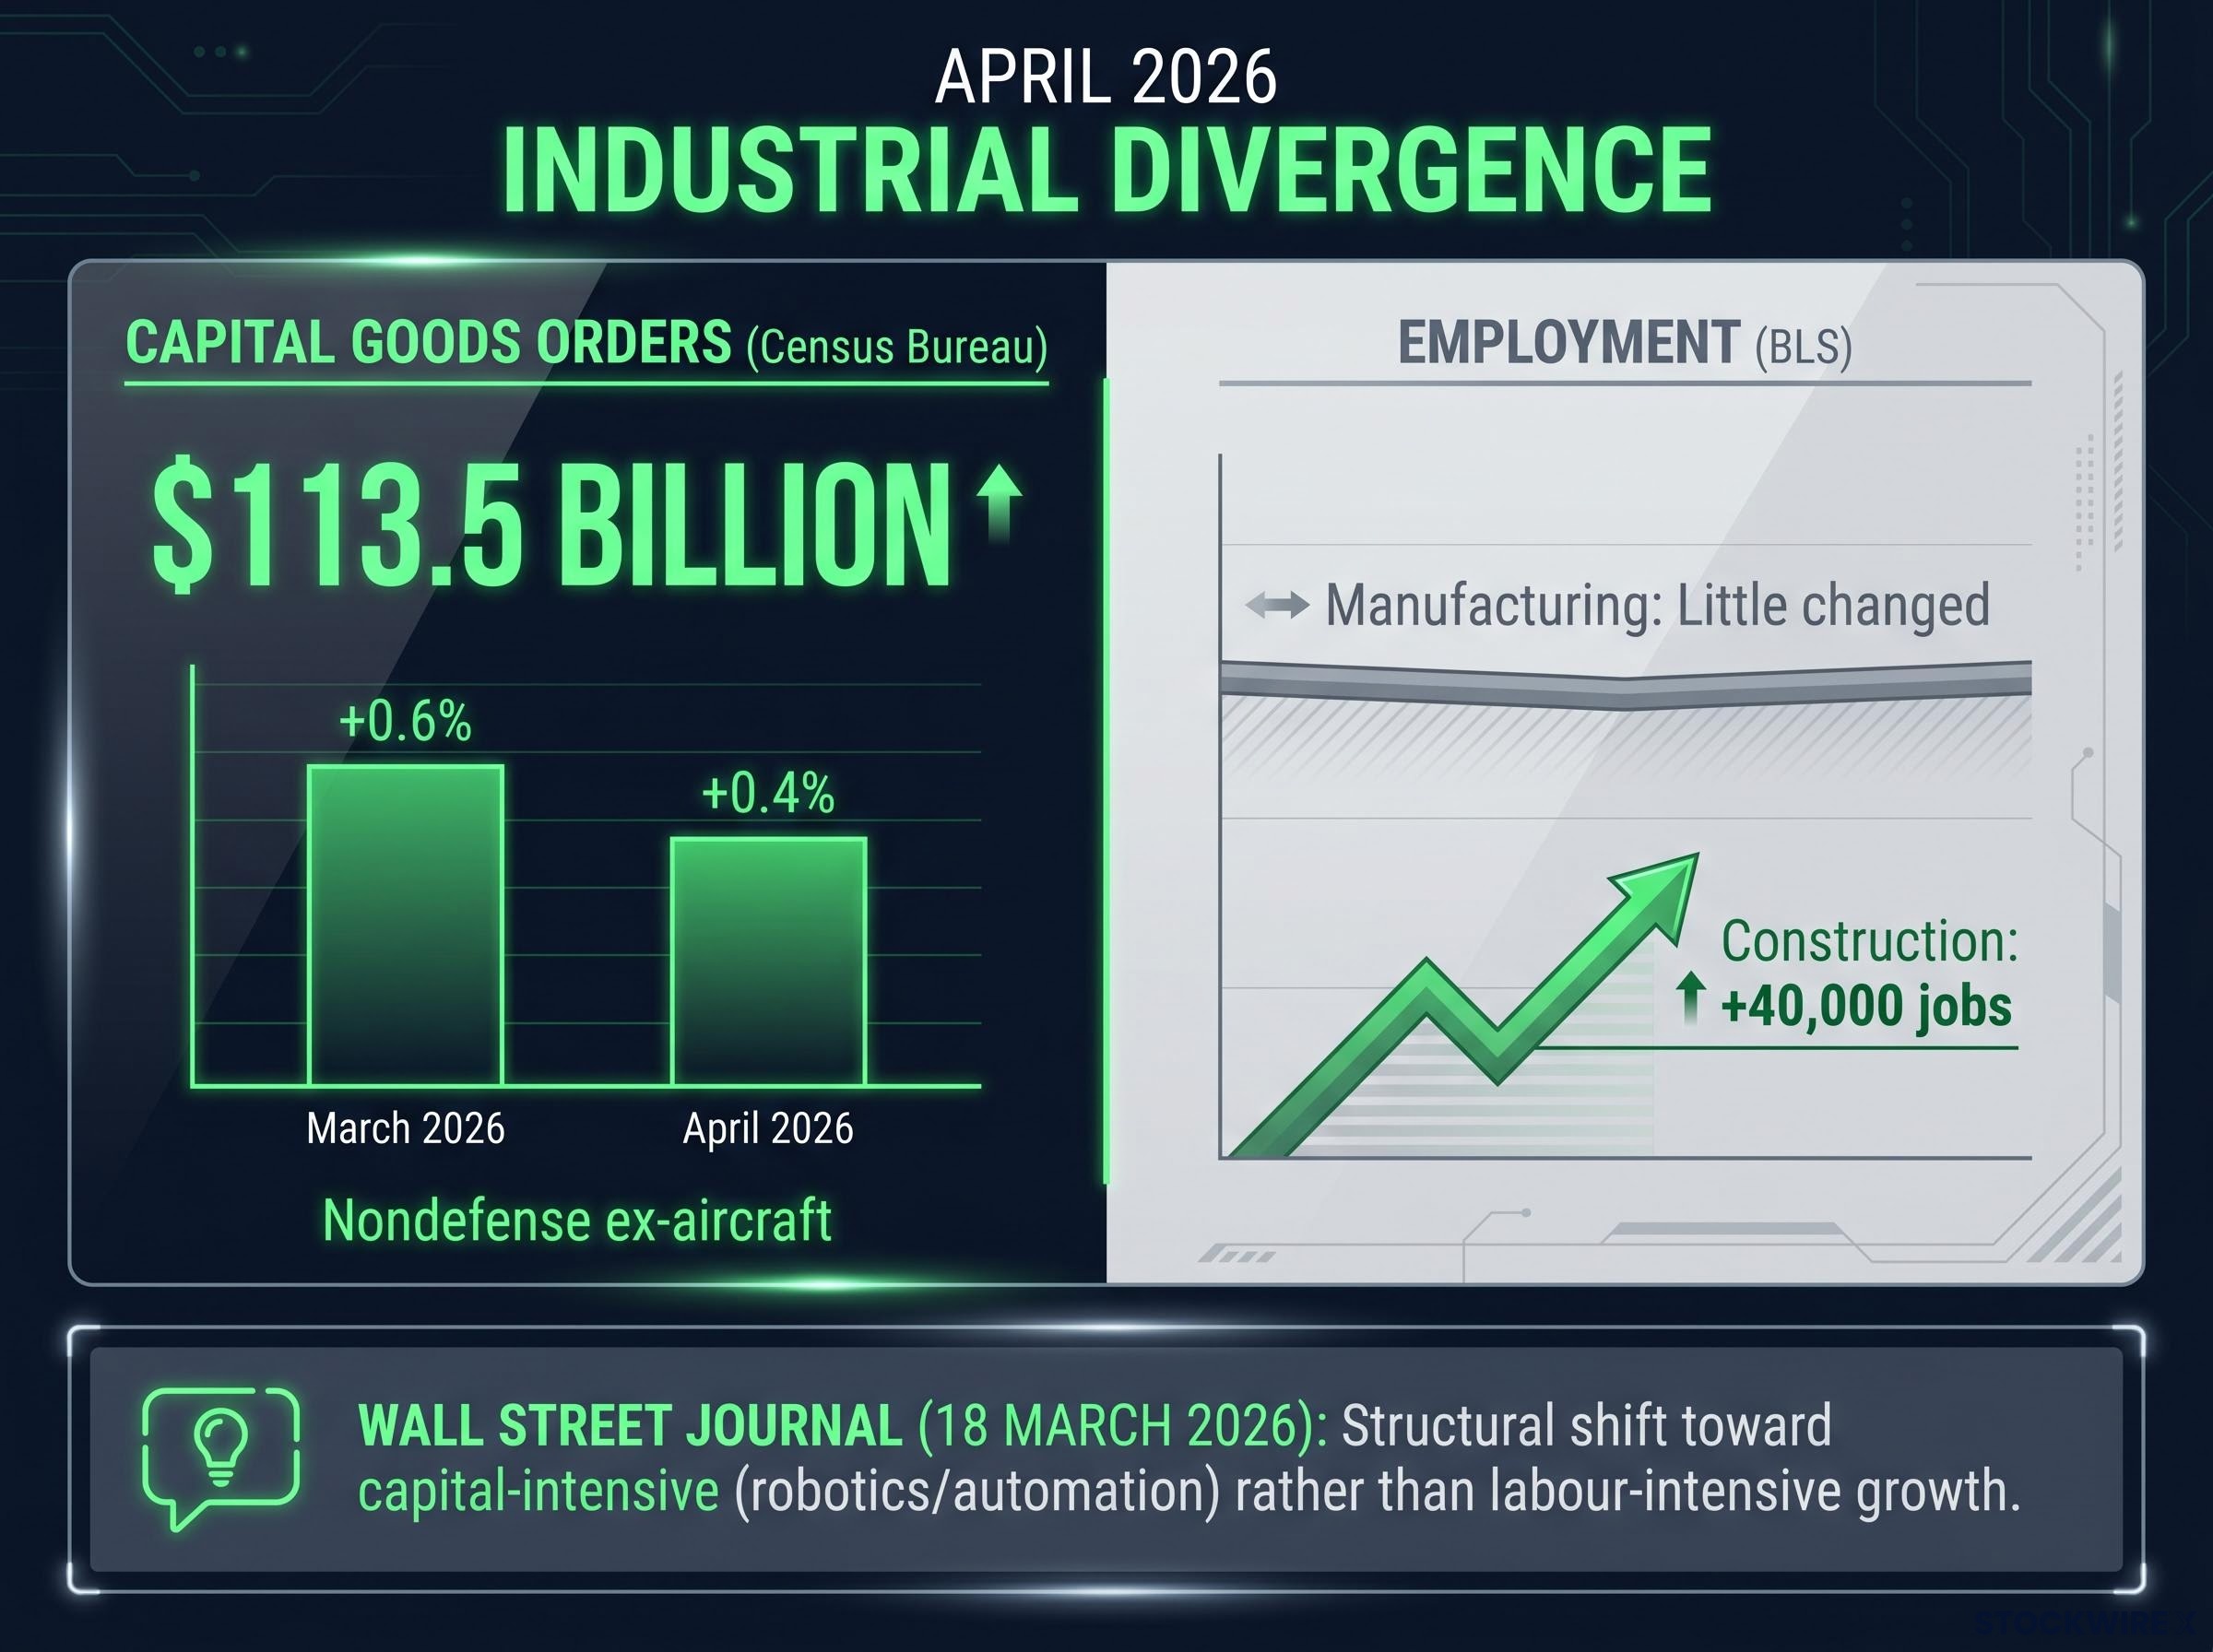
The Census Bureau’s April 2026 durable goods report, released 27 May 2026, showed nondefense capital goods orders excluding aircraft rising 0.4 percent month-over-month to $113.5 billion. The same month, Bureau of Labor Statistics (BLS) data showed manufacturing employment essentially flat. To a casual observer, those two numbers look contradictory. To someone who understands how industrial sector economic indicators work together, they tell a coherent and actionable story.
Most retail investors track industrial equities through earnings reports and stock screens. Institutional analysts at firms like BlackRock and J.P. Morgan Asset Management have long used publicly available government data, specifically BLS employment releases and Census Bureau capital goods orders, to read the industrial cycle before earnings hit. These datasets are free, timely, and updated monthly.
This guide explains exactly how to use these two government data series to assess U.S. industrial sector health in near real time, using the most recently released April 2026 figures as a concrete working example throughout.
Why two government data sources beat one industrial signal
A single indicator creates a distorted picture. The industrial sector spans construction, machinery, fabricated metals, electrical equipment, and dozens of smaller subsectors, meaning headline readings can mask significant divergence underneath. The April 2026 BLS release illustrates this directly: construction employment rose by 40,000 while manufacturing employment was little changed. Same report, same month, two entirely different signals depending on which line an investor reads.
BLS employment data and Census capital goods orders each capture a different moment in the industrial decision cycle. Firms commit capital expenditure before they adjust headcount. A manufacturer orders new machinery months before it hires operators for that machinery. This sequencing makes order data a leading signal and employment data a confirmation tool, not a forecast.
The Conference Board’s analytical framework formalises this relationship: sustained capital goods order movement over 3-6 months, followed by employment confirmation, produces a stronger signal of cycle direction than either series alone. Bloomberg Economics recommends monitoring three series together for the most actionable near-real-time read:
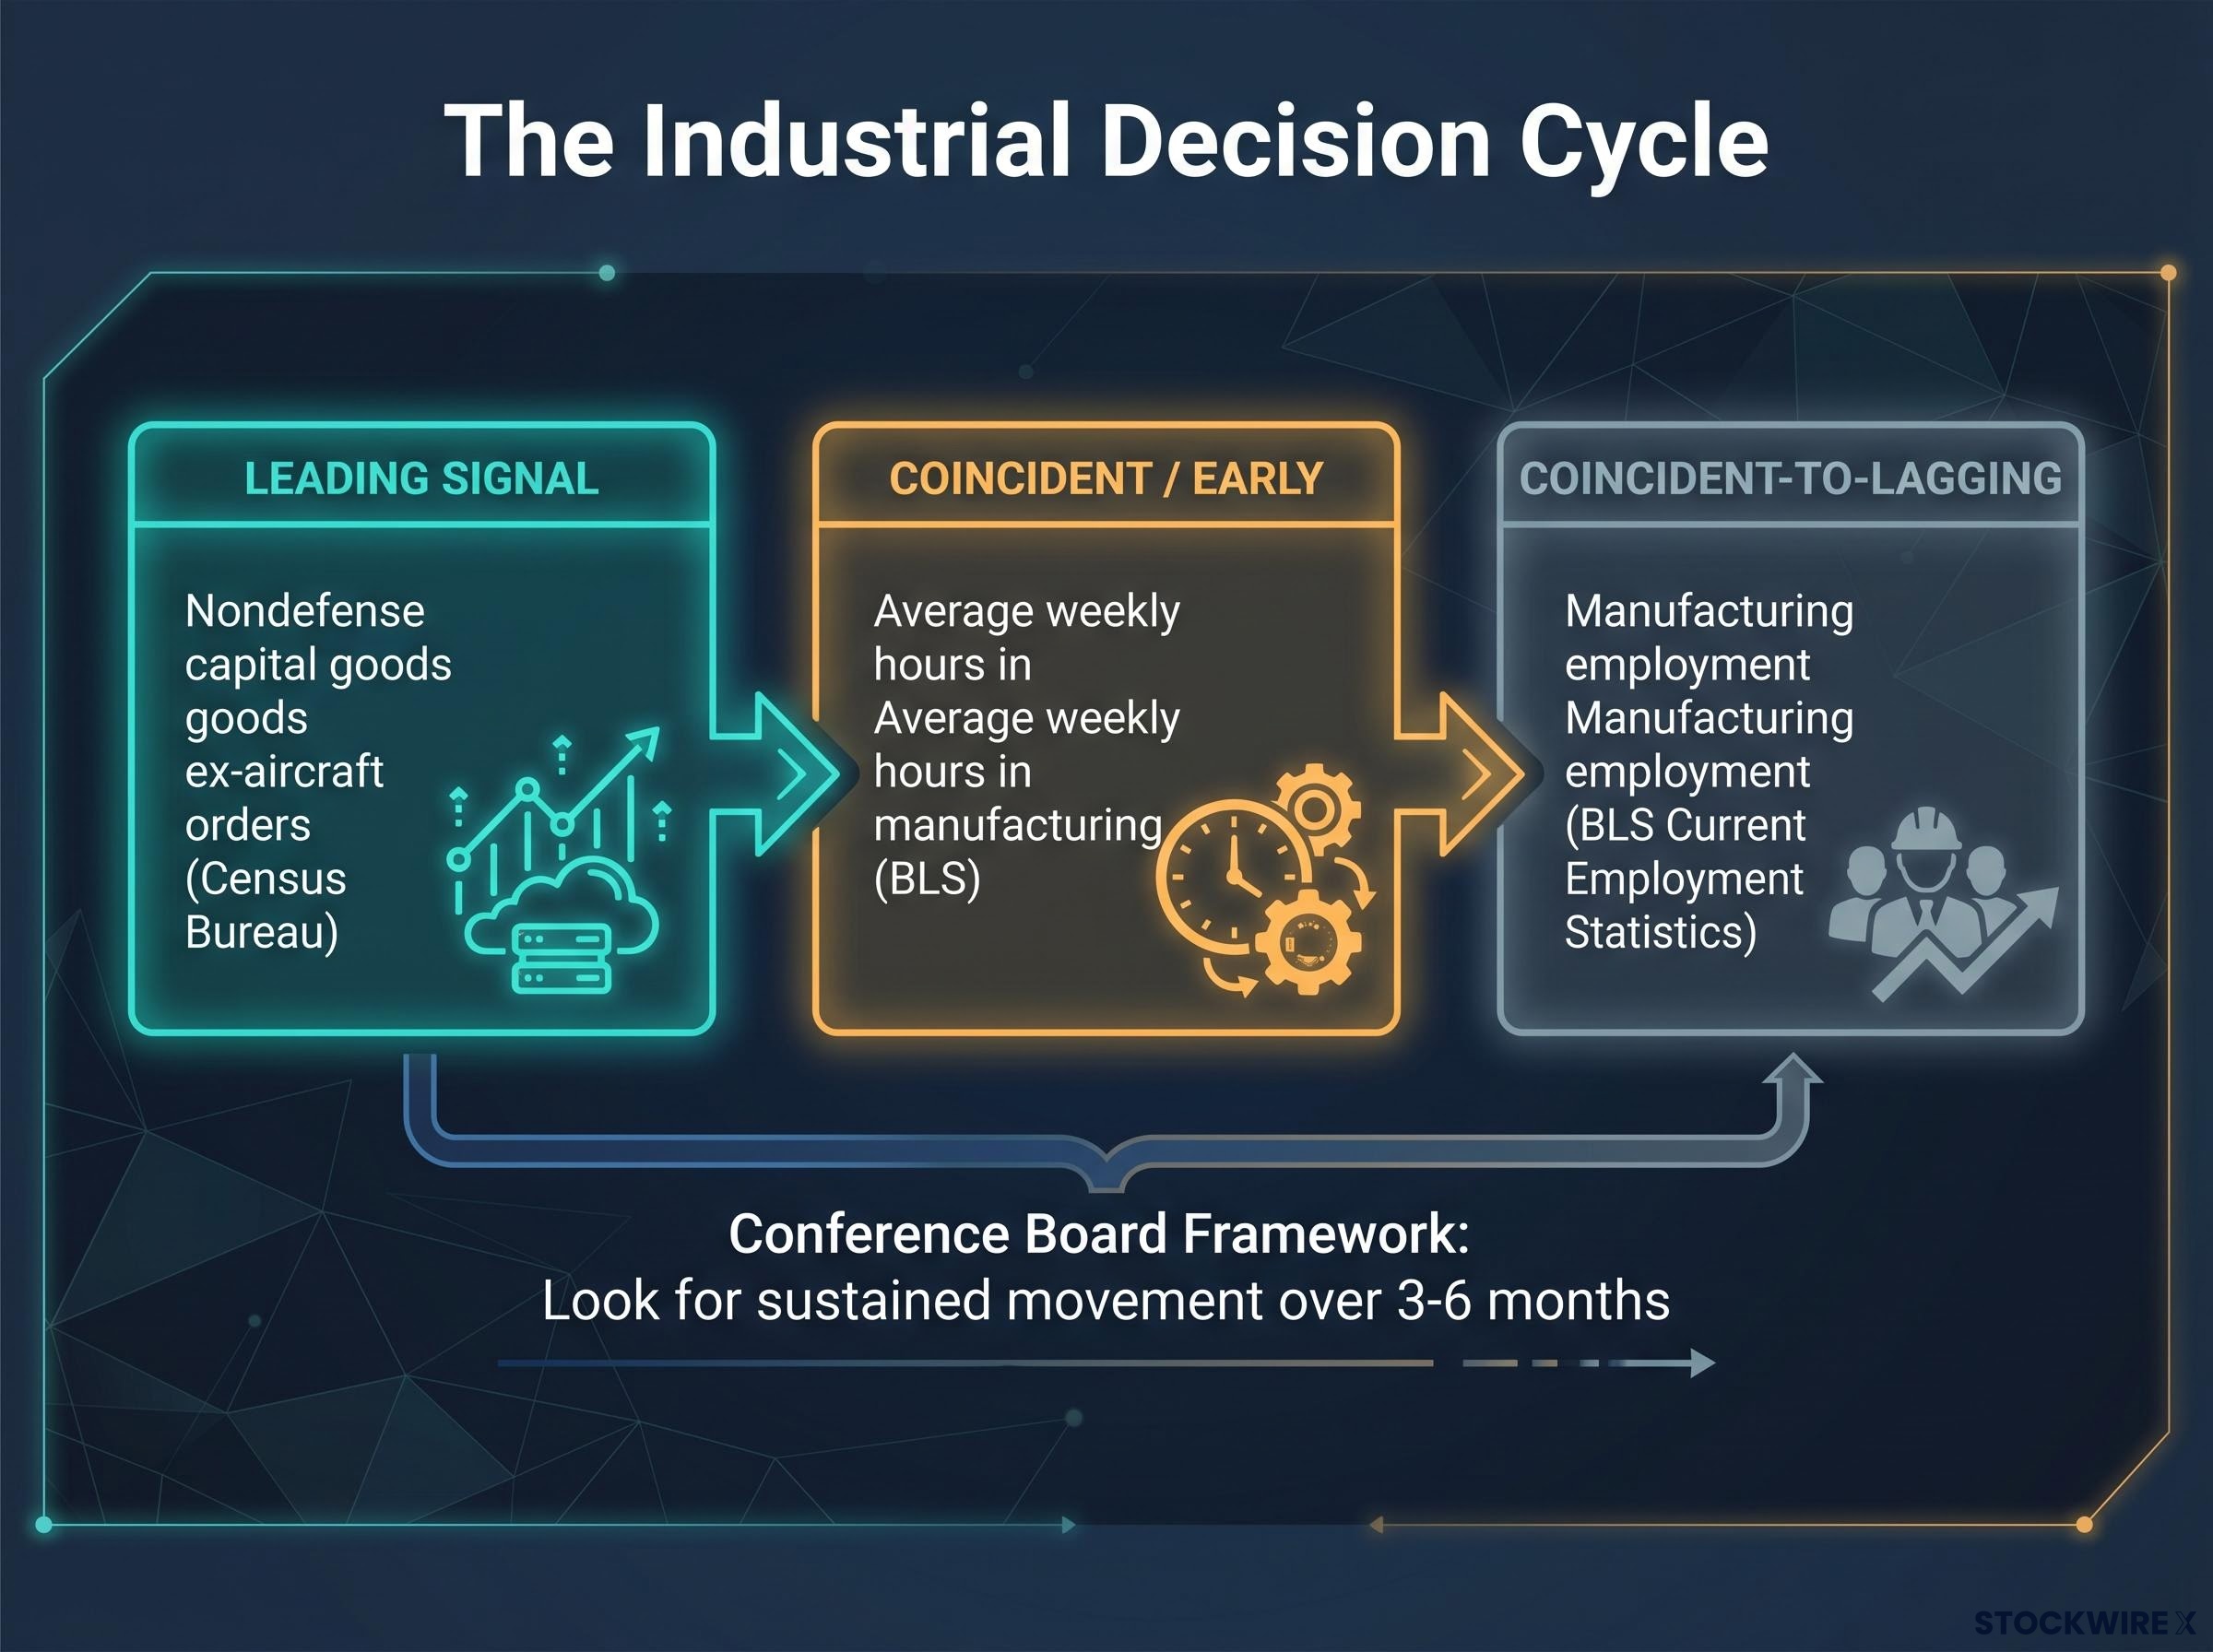
- Nondefense capital goods ex-aircraft orders (Census Bureau): the leading signal
- Manufacturing employment (BLS Current Employment Statistics): coincident-to-lagging confirmation
- Average weekly hours in manufacturing (BLS): a coincident indicator that often adjusts before headcount
Investors relying on a single indicator, whether an ISM PMI or a monthly jobs headline, are working with an incomplete signal. The sections that follow break down each series individually, then combine them into a practical framework.
For investors wanting to understand why no single monthly survey reading reliably signals a cycle turn on its own, our dedicated guide to PMI as a leading economic indicator examines how equity markets pre-price PMI trends 3-30 months before official releases, why sub-50 readings have repeatedly coexisted with positive GDP growth, and what the surprise component of any print matters far more than its absolute level.
When big ASX news breaks, our subscribers know first
What BLS employment data actually measures in industrial sectors
The BLS Current Employment Statistics programme surveys goods-producing industries each month and publishes employment figures disaggregated by subsector. The key data points for industrial sector analysis include total employment, production and non-supervisory workers, and average weekly hours.
The April 2026 release, published 8 May 2026, reported approximately 21.52 million workers in total goods-producing employment, with roughly 15.27 million in production and non-supervisory positions. Total nonfarm payrolls grew by 187,000 that month, but manufacturing’s contribution was negligible.
| Indicator | April 2026 figure | Signal type |
|---|---|---|
| Total goods-producing employment | ~21.52 million | Coincident |
| Production/non-supervisory workers | ~15.27 million | Coincident |
| Construction (month-over-month) | +40,000 | Coincident |
| Manufacturing overall (month-over-month) | Little changed | Coincident/lagging |
At the subsector level, fabricated metal products, machinery, and electrical equipment and appliances all showed little change in April 2026. Fabricated metals had shown no clear trend over the prior 12 months.
Why does manufacturing employment lag? Firms adjust hours before headcount. When order books strengthen, employers extend shifts and increase overtime before they post new positions. When order books weaken, hours get cut before layoff notices go out. Average weekly hours often moves first, making it an early employment signal that turns before payroll counts do.
The Federal Reserve Bank of St. Louis notes that manufacturing payrolls confirm rather than forecast industrial cycle turns, making them a coincident-to-lagging indicator rather than a leading one.
Where to find the BLS manufacturing data each month
The BLS publishes “The Employment Situation” on the first or second Friday of each month. The goods-producing industry table within that release contains manufacturing employment and hours data. The BLS “Industries at a Glance” tool on its website provides subsector-level breakdowns for fabricated metals, machinery, and electrical equipment without requiring manual table searches.
How Census Bureau capital goods orders signal what is coming next
The BLS data confirms where the cycle has been. The Census Bureau’s capital goods orders signal where it is heading.
The Census Bureau publishes the “Advance Report on Durable Goods Manufacturers’ Shipments, Inventories, and Orders” approximately four weeks after each reference month ends. The headline durable goods figure captures a broad range of manufactured goods, but one subcategory matters most for industrial sector investors: nondefense capital goods excluding aircraft.
Aircraft orders are lumpy and volatile; a single Boeing contract can swing the headline figure by billions. Defence procurement follows government budget cycles rather than private business conditions. Stripping both out leaves a cleaner read on private business equipment investment, the signal that reflects actual corporate capex decisions.
In April 2026, new orders for manufactured durable goods rose 0.7 percent month-over-month. Nondefense capital goods excluding aircraft orders rose 0.4 percent, following a 0.6 percent gain in March 2026. That two-month sequential increase matters more than either month alone.
Business fixed investment surged at 10.4 percent annualised in Q1 2026, its fastest pace since Q2 2023, with information processing equipment growing at 43.4 percent as AI infrastructure spending flowed directly into the national accounts, providing the broader macroeconomic confirmation that the capital goods orders data had been signalling in prior months.
| Indicator | April 2026 | March 2026 | Signal type |
|---|---|---|---|
| Total durable goods orders (MoM) | +0.7% | +0.9% | Broad cyclical |
| Nondefense capital goods ex-aircraft (MoM) | +0.4% | +0.6% | Leading |
| Nondefense capital goods total | $113.5 billion | — | Leading |
The leading indicator logic is intuitive. A manufacturer places an order for new machinery or equipment before it hires workers to operate that equipment. Order growth precedes payroll growth by several quarters, according to the Federal Reserve Bank of St. Louis. The Conference Board includes this series as a core component of its Leading Economic Index for exactly this reason.
The Conference Board Leading Economic Index components explicitly include manufacturers’ new orders for nondefense capital goods excluding aircraft, formalising the series as a core forward-looking signal rather than a coincident or lagging measure of industrial activity.
The Conference Board advises analysts to look for sustained capital goods order movement over 3-6 months as the meaningful signal threshold, rather than reacting to any single monthly release.
Where to find the Census durable goods report each month
The release is titled “Advance Report on Durable Goods Manufacturers’ Shipments, Inventories, and Orders” and typically publishes approximately four weeks after the reference month ends. The nondefense capital goods excluding aircraft line appears in the advance release tables. FRED (Federal Reserve Bank of St. Louis) hosts the full historical series for charting and trend comparison, making multi-month pattern analysis considerably easier than parsing the Census Bureau’s PDF release each month.
The FRED historical series for nondefense capital goods orders (series code NEWORDER) provides the full multi-decade dataset needed to assess whether a two or three month directional move represents a genuine cycle turn or falls within normal short-term noise.
Reading the April 2026 figures as a complete industrial picture
With both data series in hand, the interpretive process follows a three-step sequence:
- Check nondefense capital goods ex-aircraft direction and trend. April’s 0.4 percent gain follows March’s 0.6 percent increase, establishing consecutive monthly gains. The direction is positive and the trend is strengthening.
- Check manufacturing employment and average weekly hours for confirmation or divergence. Manufacturing employment was little changed in April 2026. This is divergence, not confirmation, of the order data’s positive signal.
- Look for subsector variation within the goods-producing breakdown. Construction employment rose 40,000 while manufacturing held flat. The cycle is not moving uniformly across goods-producing industries.
The apparent contradiction between rising capital goods orders and flat manufacturing payrolls has a specific explanation in this cycle. The Wall Street Journal reported on 18 March 2026 that manufacturers are investing in robotics and automation rather than broad-based hiring. Capital expenditure in equipment and software has been rising while manufacturing payrolls remain roughly flat.
AI job exposure data from Bank of America quantifies the structural dimension of this divergence: high-income workers gained 4.2 percent in wages year-over-year in February 2026 while low-income workers gained just 0.6 percent, a distributional pattern consistent with productivity gains accruing to firms and capital as manufacturers invest in automation rather than expanding production-floor headcount.
The Wall Street Journal found that many manufacturers are deploying automation investment rather than expanding headcount, with capital expenditure in equipment and software rising while manufacturing payrolls stay approximately flat, indicating a structural shift toward capital-intensive rather than labour-intensive industrial growth.
Reuters reported on 30 April 2026 that economists describe the worst of the industrial downturn as over, with companies ramping equipment spending after the 2023-2024 slowdown. The Federal Reserve Beige Book for April 2026 corroborated this reading, noting manufacturing activity was generally flat to modestly improving, with some districts citing increased orders in machinery and transportation equipment.
S&P Global Ratings projects modest growth in U.S. industrial production in 2026, driven by nondefense capital goods investment, energy-related projects, and public infrastructure spending.
Flat employment data in a rising capital goods orders environment is not a bearish signal in this cycle. It reflects a structural preference for capital-intensive growth. Investors who read only the jobs number risk misreading the cycle direction entirely.
Translating industrial indicators into equity and ETF analysis
Reading the data is one skill. Connecting it to positioning decisions is another.
Institutional investors use the leading and coincident structure of these two series to time sector allocation adjustments ahead of earnings confirmation. BlackRock iShares treats nondefense capital goods ex-aircraft orders as a leading signal for industrial revenue growth, with manufacturing payrolls serving as coincident confirmation of cycle turns within its factor and sector allocation models. J.P. Morgan Asset Management links the two series as complementary indicators of corporate capex momentum and industrial capacity expansion.
Three institutional applications of this framework stand out:
- Conference Board Leading Economic Index: includes nondefense capital goods ex-aircraft as a core component, helping distinguish between a temporary soft patch and a sustained industrial downturn
- BlackRock iShares factor allocation: uses the leading and coincident structure to adjust industrial sector weightings before earnings data confirms the cycle turn
- J.P. Morgan capex momentum framework: treats Census orders and BLS payrolls as complementary reads on whether corporate capital spending is accelerating or decelerating
Charles Schwab’s guidance for retail investors reinforces one principle: track multi-month trends across all three series (manufacturing employment, average weekly hours, nondefense capital goods ex-aircraft) rather than reacting to any single monthly release. Month-to-month volatility in the durable goods advance report is substantial, and a single print can mislead.
The structural divergence between capital expenditure and headcount in 2025-2026 makes subsector selection within industrials more important than broad sector-level calls. Companies supplying automation equipment and machinery benefit from the capex recovery. Labour-intensive manufacturers with flat order books may see little revenue improvement. The framework does not just signal cycle direction; it points toward which subsectors are positioned to benefit.
Materials sector positioning represents one concrete application of this capex-signals-first approach: Bank of America’s Michael Hartnett identifies four non-correlated demand drivers converging on materials, including $700-750 billion in hyperscaler AI infrastructure spending, that are visible in capital goods order trends before they appear in company revenue guidance or analyst upgrades.
A monthly reading habit that puts government data to work
The analytical framework collapses into a repeatable monthly routine:
- Note the Census Bureau durable goods advance release date (approximately four weeks after the reference month ends).
- Locate the nondefense capital goods excluding aircraft line and record the month-over-month change.
- Note the BLS Employment Situation release date (first or second Friday of each month).
- Extract manufacturing employment and average weekly hours from the goods-producing industry table.
- Compare the direction and trend of both series against the prior two to three months.
- Check for subsector divergence within goods-producing industries (construction versus manufacturing, machinery versus fabricated metals).
The value of this approach accumulates over time. A single month’s data is noisy. Three to six months of consistent direction in capital goods orders, confirmed or diverged by employment trends, produces the kind of signal that institutional analysts act on before it appears in company guidance or analyst upgrades.
The April 2026 data illustrate exactly the kind of nuanced reading this framework enables: rising capex orders alongside flat payrolls, a signal that the industrial cycle is improving through capital investment rather than hiring. That distinction would be invisible to an investor watching only the monthly jobs headline.
This article is for informational purposes only and should not be considered financial advice. Investors should conduct their own research and consult with financial professionals before making investment decisions.