
The industrial sector is one of those corners of the market that rarely makes headlines until a freight recession or defence spending surge forces it into view. Yet the sector accounts for approximately 9% of S&P 500 market capitalisation and touches nearly every other part of the economy, from the raw materials that feed manufacturing lines to the business services that keep supply chains moving. In 2026, the case for paying attention has sharpened. The XLI ETF has returned roughly 11.9%-12.7% year-to-date through late May 2026, outperforming many expectations, but the gains have not been evenly distributed. Aerospace and defence names have surged on geopolitical tailwinds, while cyclical transport companies have lagged. That divergence is itself the argument for understanding sector structure before committing capital. This guide answers the three questions a retail investor actually needs answered: what is the industrial sector and how is it organised, which vehicles offer exposure, and what are the risks and long-term opportunities worth weighing.
What the industrial sector actually is (and why it matters to investors)
Most investors picture factories, hard hats, and maybe Boeing. That mental model is not wrong, but it is incomplete. The industrial sector, as a formal market classification, spans four primary industry groups that together form the connective tissue of the broader economy.
The four industry groups at a glance
- Materials and Parts: Raw and manufactured materials that serve as inputs for finished goods across multiple industries.
- Capital Items: Large-scale installations and equipment purchased by businesses to expand or maintain productive capacity.
- Supplies: Maintenance, repair, and operational supplies consumed in the course of daily business activity.
- Business Services: Advisory, consulting, engineering, and operational improvement functions that support industrial productivity.
That range means a single “industrials” allocation can include everything from a jet engine manufacturer to a facilities management contractor.
The sector’s economic weight reinforces why it deserves attention. The industrial sector contributed an estimated 22.5% of U.S. GDP as of 2022, and more than 23 million individuals held industrial employment positions that year, representing approximately 14.5% of total U.S. workforce participation. Manufacturing alone added approximately $2.4 trillion (roughly 10.2% of GDP in chained 2017 dollars) as of 2023.
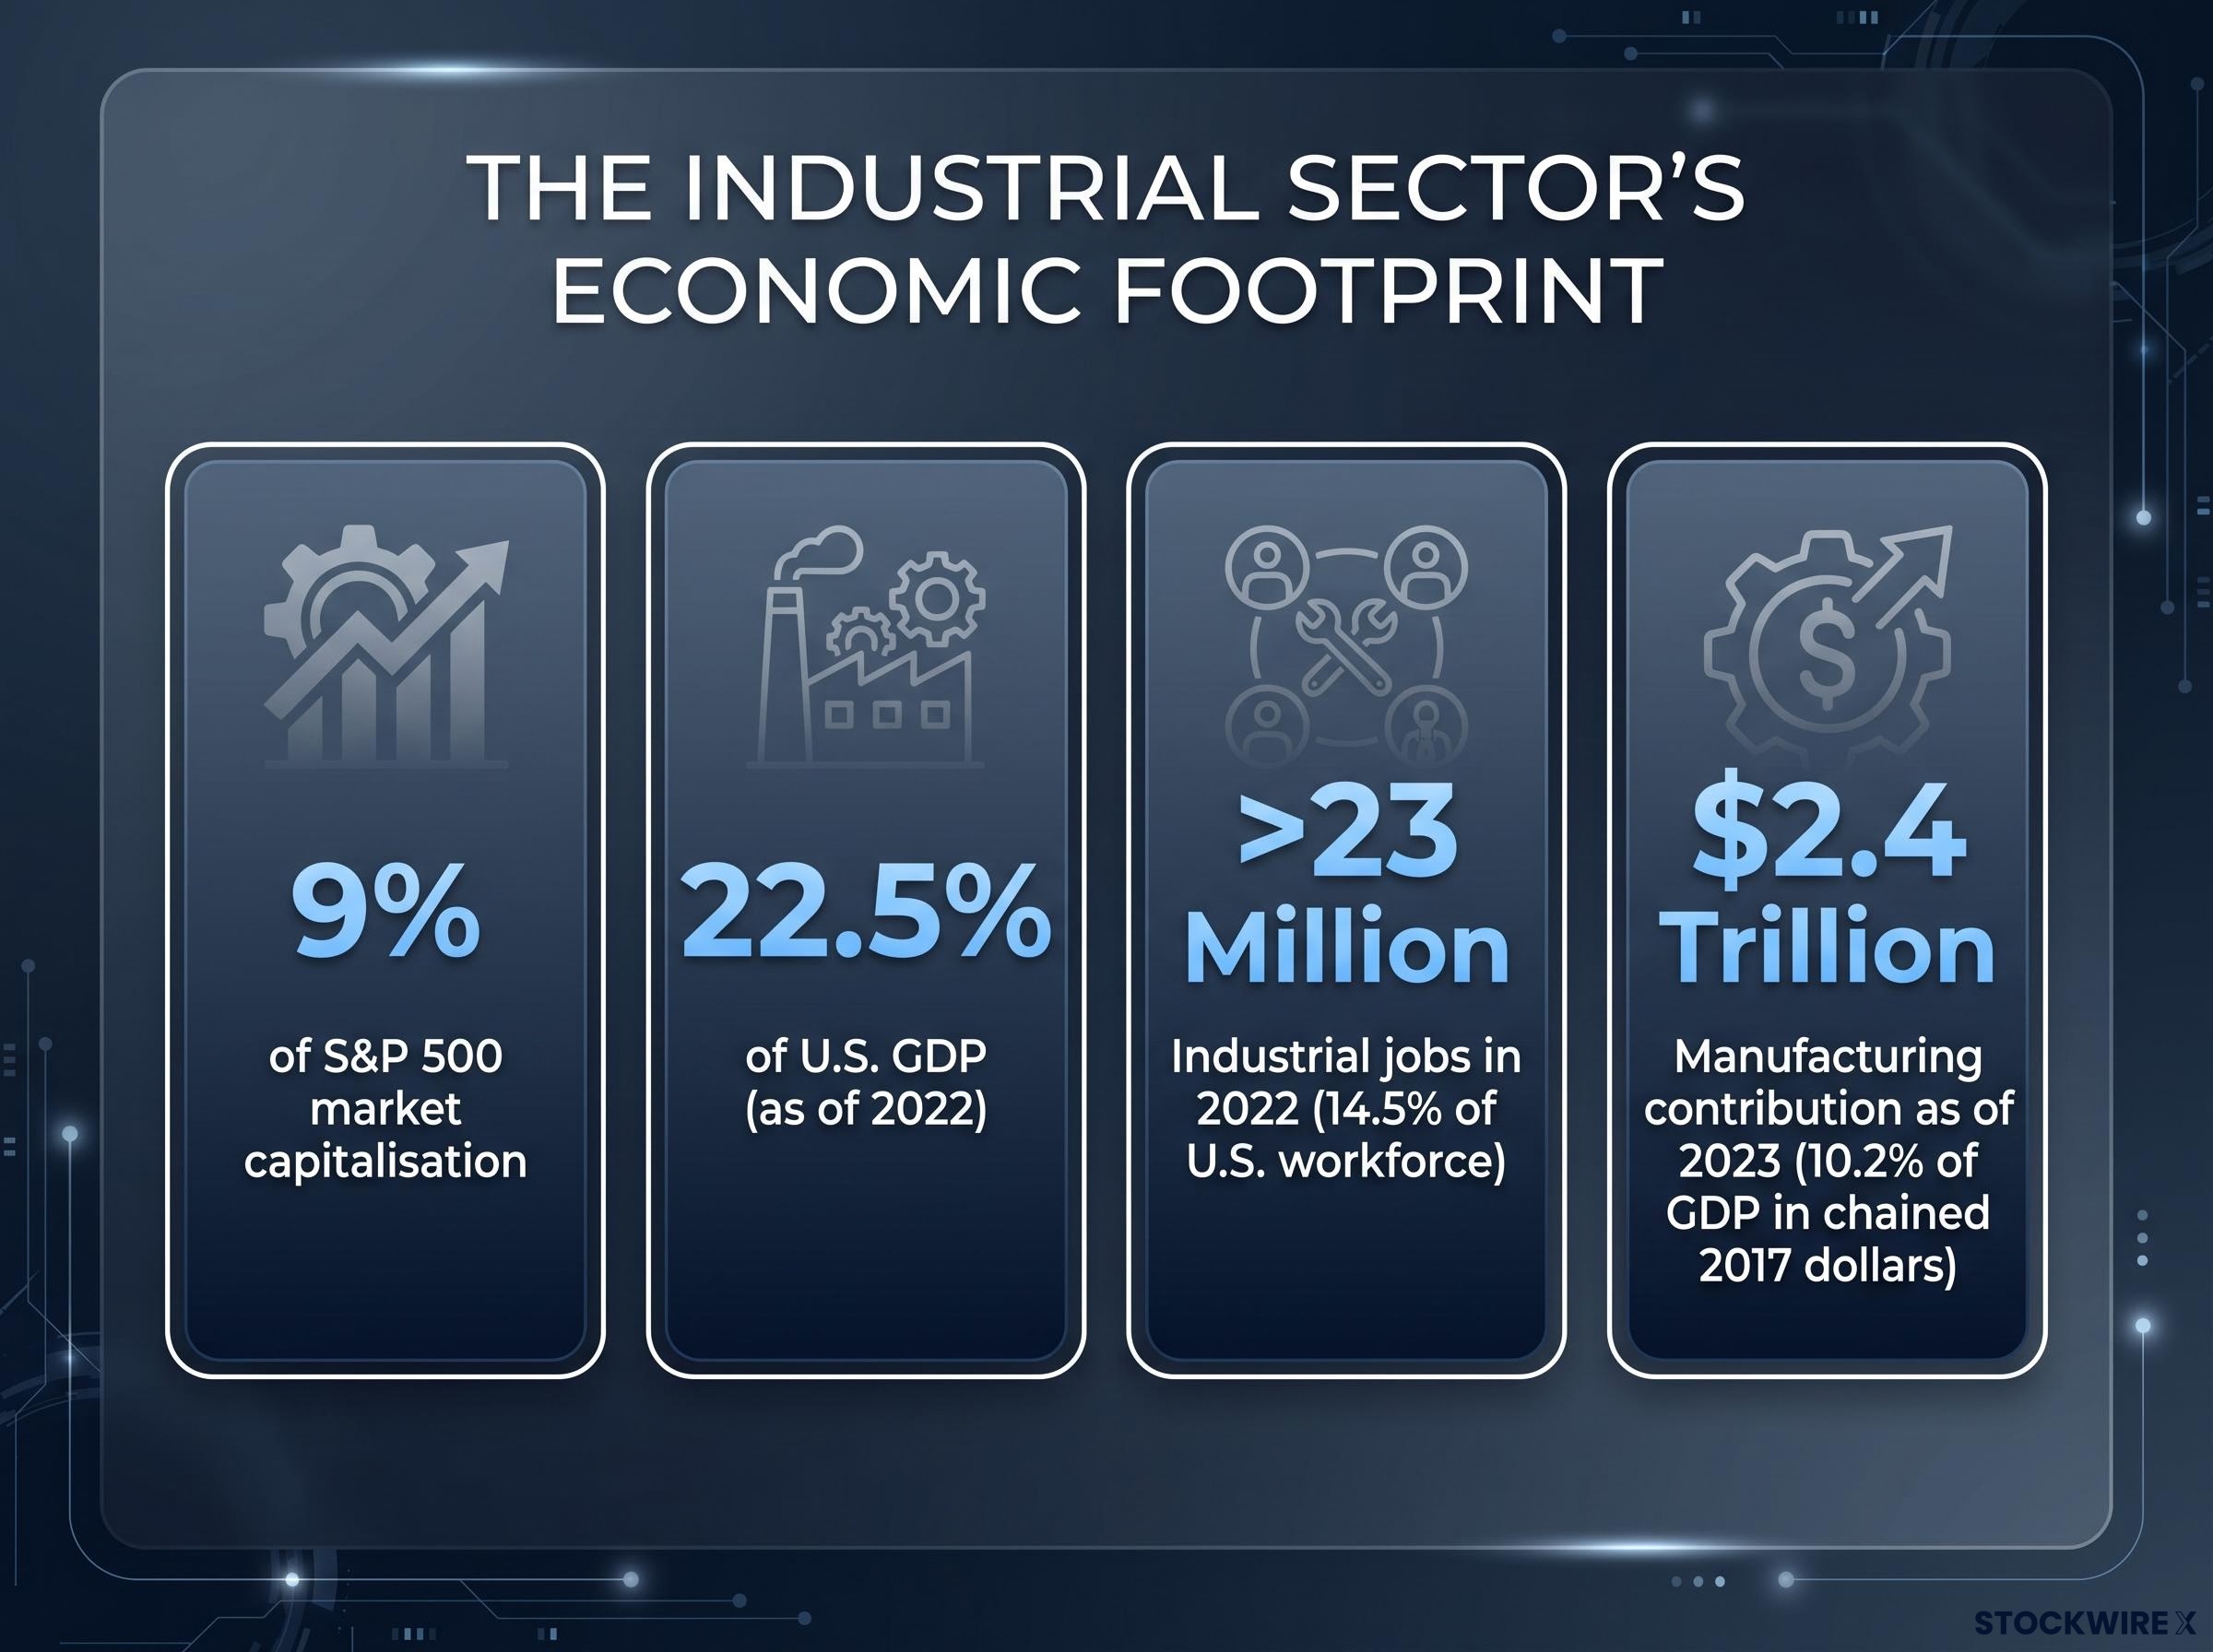
These are not abstract figures. When industrial output expands, it pulls procurement, logistics, and services spending with it. When it contracts, the drag ripples outward. That is why the sector functions as an economic bellwether: its performance often signals where the broader economy is heading before headline GDP numbers confirm it.
The industrial sector’s status as an economic bellwether is inseparable from how sector rotation signals work in practice: institutional capital repositions into or out of cyclicals ahead of official data confirmation, meaning the sector’s relative performance against defensives often previews GDP readings by weeks or months.
When big ASX news breaks, our subscribers know first
How the sector is organised: sub-industries and the companies that define them
Knowing that the sector is large is one thing. Knowing where within it to look, and which companies sit where, is what turns a broad allocation into an informed one.
The sector spans three major activity areas. Manufacturing centres on converting raw inputs into finished goods; infrastructure construction covers residential, commercial, and industrial building projects; and utilities deliver foundational services such as electricity, water, and gas.
| Sub-Industry | Activity Type | Representative Companies | Investor Note |
|---|---|---|---|
| Manufacturing | Cyclical | General Electric (GE), Caterpillar (CAT), Boeing (BA) | Earnings tied closely to capex cycles and global demand |
| Infrastructure Construction | Cyclical | Fluor Corporation (FLR) (Bechtel is private) | Revenue linked to project timing and government spending |
| Utilities | Structural | Duke Energy (DUK), NextEra Energy (NEE) | More defensive; demand less sensitive to economic cycles |
| Aerospace and Defence | Structural | Lockheed Martin, Northrop Grumman | Outperformed in 2025-2026 on geopolitical tailwinds |
These companies are illustrative anchors, not stock picks. The point is orientation: knowing which names sit in which sub-industry helps investors understand why a single industrial ETF can deliver returns that look nothing like what a headline about manufacturing sentiment might suggest.
Cyclical vs. structural sub-industries
The distinction matters for portfolio behaviour. Machinery, freight transport, and economically sensitive manufacturing names rise and fall with the business cycle. Aerospace and defence, by contrast, is driven by multi-year government appropriations and geopolitical demand, forces that operate largely independent of consumer confidence readings. Utilities occupy a similar structural lane. During an economic slowdown, the cyclical names compress while the structural ones can hold or even advance. That within-sector divergence is precisely what played out across parts of 2025-2026.
How to invest in the industrial sector: vehicles and exposure options
Three routes lead into the industrial sector. Each suits a different investor profile, and the choice shapes both the risk and the effort required.
The choice between stocks vs ETFs is not purely about effort or cost: it determines the type of risk the investor actually holds, with single-stock industrial names exposing a portfolio to company-specific earnings shocks that a broad sector ETF dilutes across dozens of positions simultaneously.
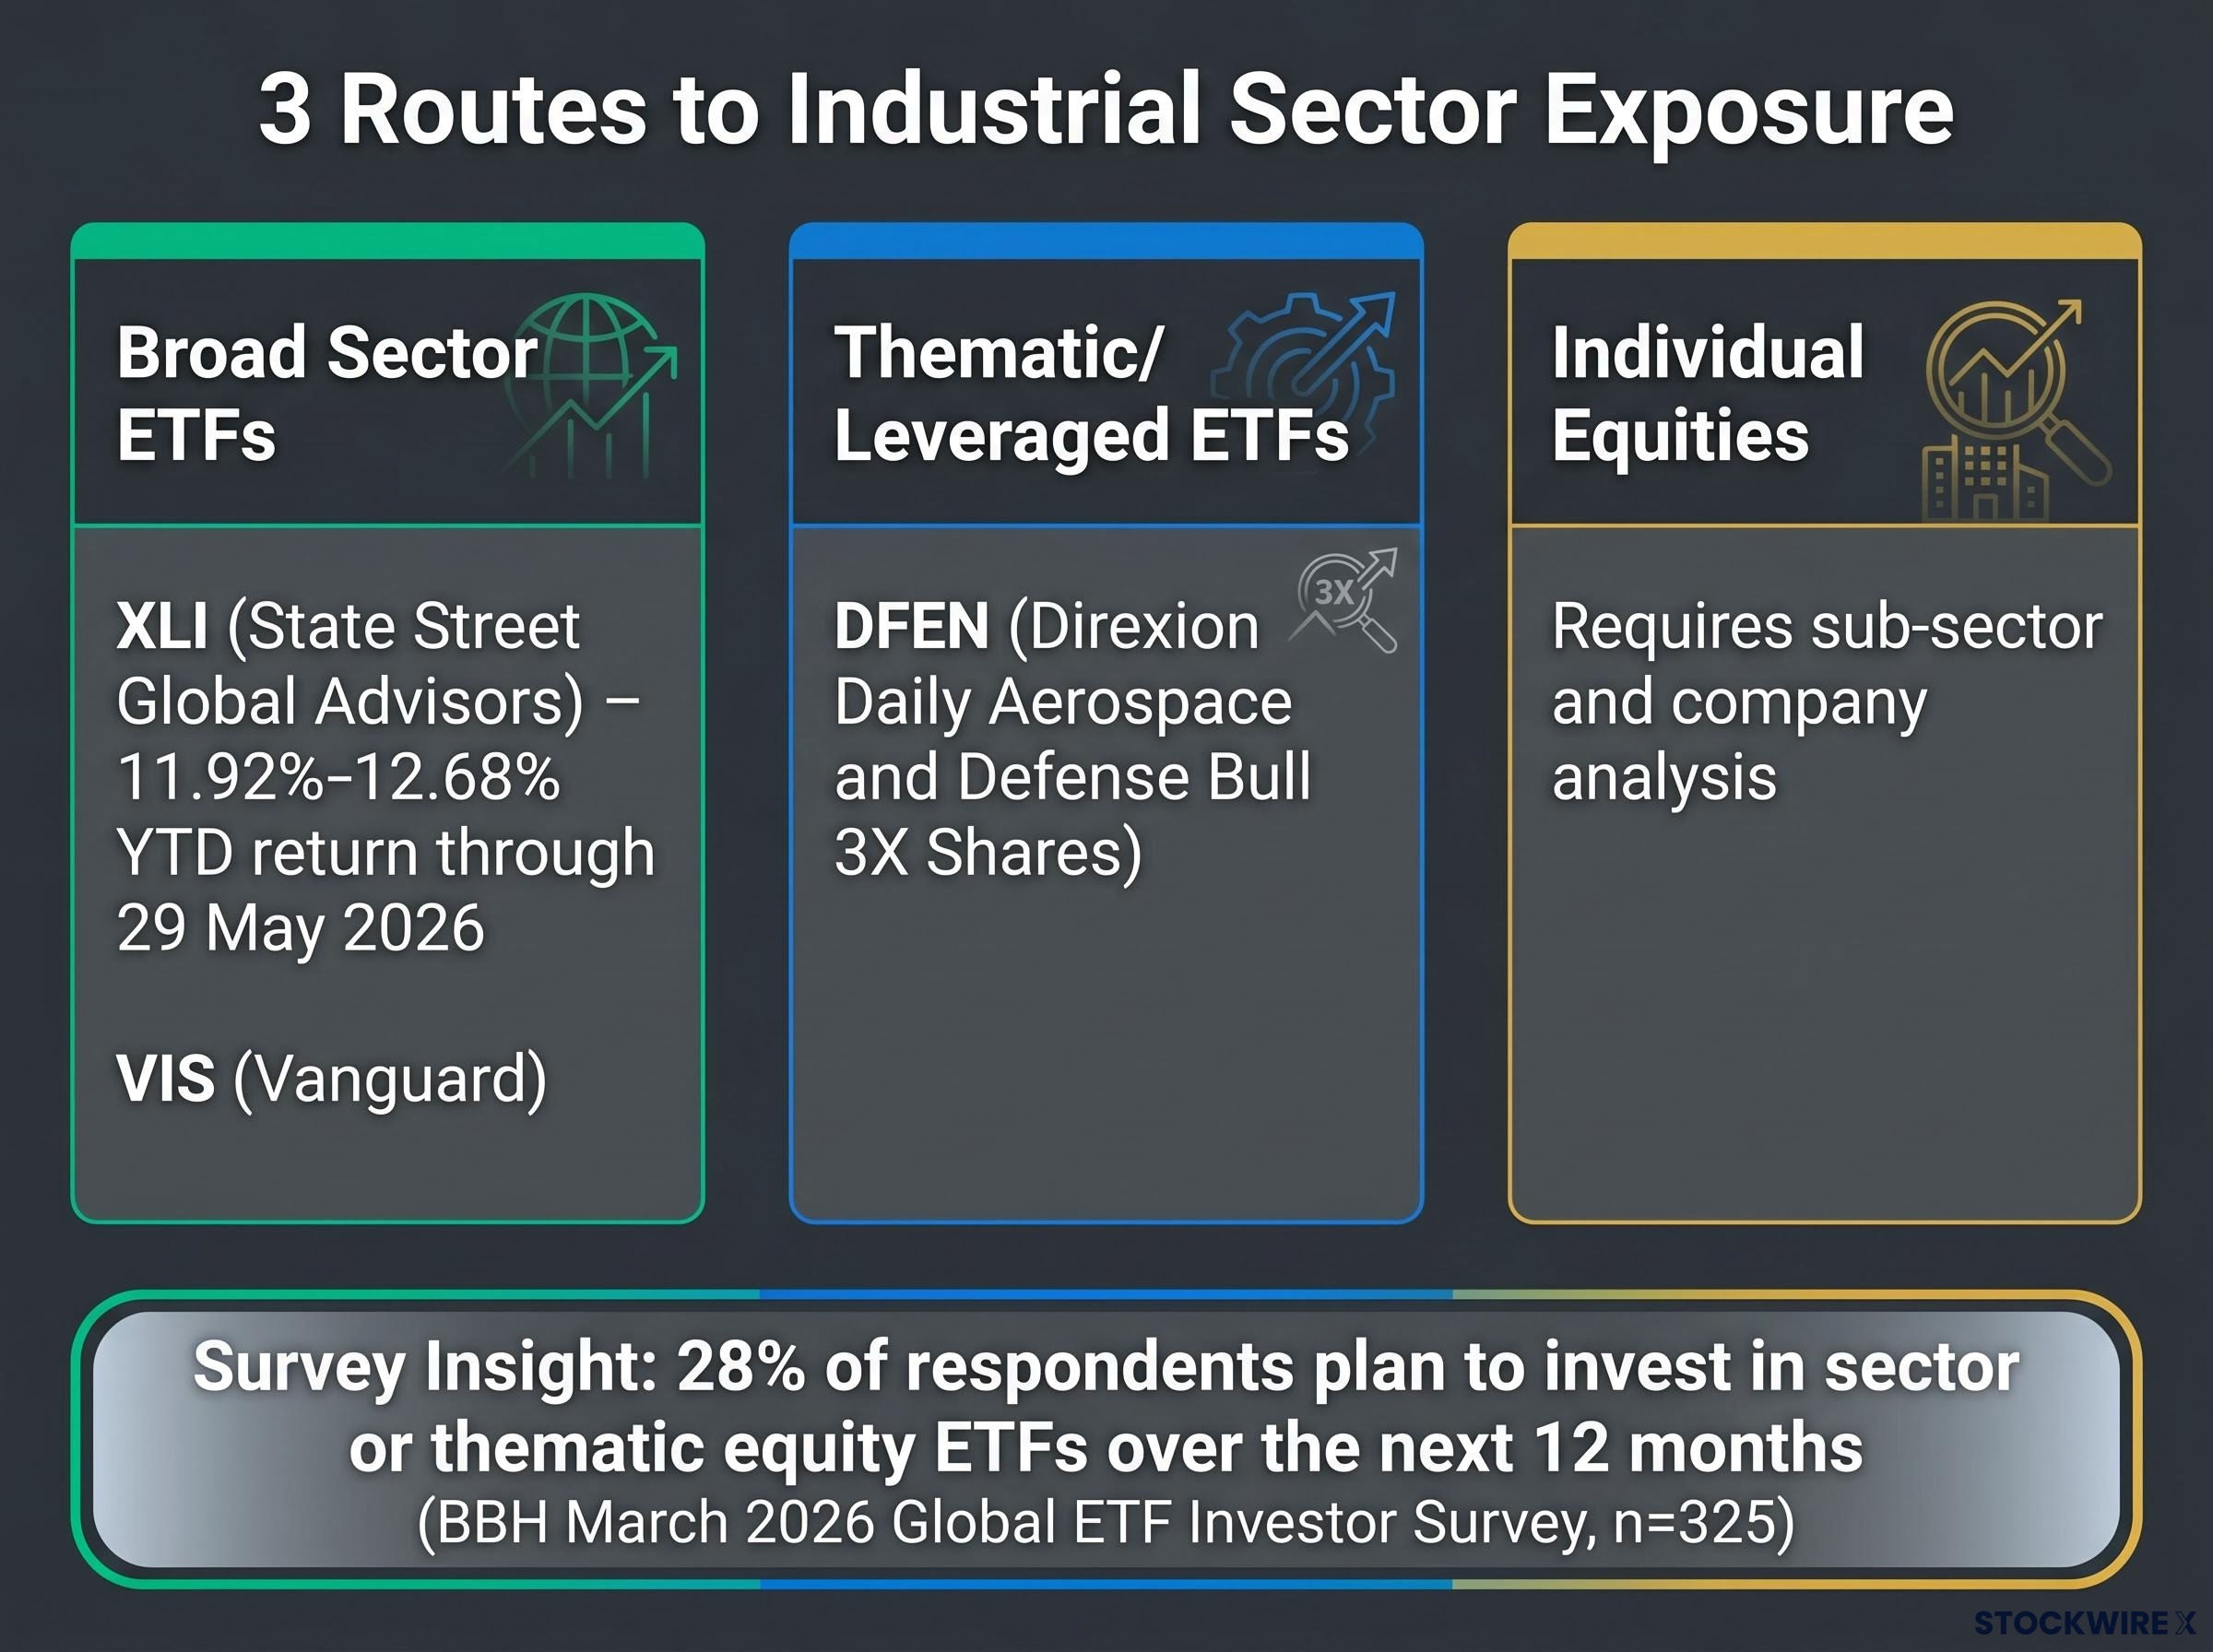
- Broad sector ETFs (lowest effort, broadest exposure): The Industrial Select Sector SPDR Fund (XLI), sponsored by State Street Global Advisors, is the most widely traded industrial sector ETF in the U.S. and delivered a YTD total return of approximately 11.92%-12.68% through 29 May 2026. The Vanguard Industrials ETF (VIS) offers a similar broad exposure from a different sponsor. Both suit investors seeking diversified sector participation without individual stock selection.
- Thematic or leveraged ETFs (targeted, higher risk): The Direxion Daily Aerospace and Defense Bull 3X Shares (DFEN) provides leveraged exposure specifically to the aerospace and defence sub-sector. Its amplified risk profile means it is designed for short-term tactical positioning, not long-term holding.
- Individual equities (highest effort, highest conviction): Selecting individual companies requires sub-sector analysis, company-level fundamental research, and an understanding of how each name’s earnings respond to capex cycles, government contracts, or freight volumes.
Before allocating through any ETF, verify the current assets under management (AUM), expense ratio, and holdings composition directly from the official fund fact sheet. These figures shift with rebalancing and fund flows. Official data is available at ssga.com for XLI, investor.vanguard.com for VIS, and direxion.com for DFEN.
According to the Brown Brothers Harriman 2026 Global ETF Investor Survey (published March 2026, n=325), 28% of respondents planned to invest in sector or thematic equity exposure via ETFs over the next 12 months, confirming sustained institutional and retail appetite for sector-specific vehicles.
Understanding the cyclical risks before you commit capital
The industrial sector’s returns over the past year tell an encouraging story. The risk profile tells a more complicated one. The sector’s strong correlation with broad economic conditions means it amplifies downturns, not just expansions. Investors who enter without acknowledging this risk are likely to be surprised by drawdowns that are structurally predictable, not random.
The four risk categories investors should monitor
- Economic cyclicality: When business sentiment deteriorates and consumer confidence softens, capital expenditure budgets contract, and industrial earnings follow. Cyclical transport and machinery names are the first to feel the impact.
- Tariffs and trade policy: Historically a material risk through the 2018-2024 period, affecting industrial input costs, supply chain logistics, and international competitiveness. Ongoing trade policy developments remain a live concern for companies with global supply chains or export exposure.
- Interest rate sensitivity: Higher-for-longer rate environments compress valuations and delay large capex commitments for capital-intensive companies. The cost of financing new factory builds, equipment upgrades, and infrastructure projects rises in tandem.
- Supply chain and geopolitical disruption: Geopolitical instability is dual-edged. It serves as a tailwind for aerospace and defence spending but can simultaneously disrupt globally exposed industrial supply chains and trade-dependent manufacturers.
Sub-sector diversification within an industrial allocation is one practical mitigation. Spreading exposure across cyclical and structural sub-industries, rather than concentrating in a single theme, reduces the probability that any one risk factor dominates portfolio outcomes.
Why the long-term tailwinds are structural, not cyclical
The risk section frames what can go wrong. This section frames what may keep going right, independently of where the economy sits in the business cycle. Four secular forces are pulling in the same direction, and each connects back to specific sub-sectors investors can target.
- Automation and Industry 4.0 (shortest runway to impact): Factory automation, robotics, and AI-enabled productivity tools are already being deployed across manufacturing lines. These investments are tied to both efficiency gains and reshoring-driven demand for new domestic production capacity. Capital goods manufacturers and industrial software companies are the direct beneficiaries.
- Green energy transition (medium-term): Renewable energy project activity has surged globally, and the industrial companies that build, install, and maintain wind turbines, solar arrays, and grid infrastructure are positioned for sustained demand. Utilities such as NextEra Energy sit at the intersection of this tailwind and the broader sector.
- Infrastructure investment (medium-to-long-term): U.S. infrastructure development initiatives are expected to generate substantial investment opportunities in transportation, telecommunications, and renewable energy. Engineering and construction firms stand to benefit, though project timing and cost inflation have made execution uneven.
- Reshoring-driven capex (longest runway): U.S. policy-linked initiatives, including infrastructure legislation and domestic manufacturing incentives, have provided a multi-year capital expenditure tailwind for select industrial sub-sectors. Execution has been uneven depending on project timing and cost dynamics, but the policy direction remains in place.
Industrial robotics supply chains carry a structural risk that the automation tailwind narrative tends to understate: China controls an estimated 93% of the global permanent magnet market and approximately 99% of heavy rare earth element processing, creating component sourcing dependencies that directly constrain the hardware manufacturers investors are betting on.
U.S. Treasury analysis of manufacturing construction trends documents how legislation including the Infrastructure Investment and Jobs Act, the Inflation Reduction Act, and the CHIPS Act collectively generated a sustained surge in domestic factory construction spending, providing the policy evidence base underpinning the reshoring capex thesis.
The automation and AI/IoT integration theme is additive to reshoring-driven demand. As companies build new domestic production facilities, they are equipping them with next-generation automation from the start, compounding the capital expenditure cycle for industrial suppliers.
What distinguishes these four forces from a simple cyclical recovery is their independence from one another. A slowdown in infrastructure spending does not eliminate the automation trend. A pause in reshoring does not reverse the energy transition. The cumulative effect of multiple independent tailwinds is what makes the industrial sector a long-term thematic allocation, not merely an economic-cycle trade.
Building a position in industrials: what to check before you allocate
Understanding the sector, its structure, and its risk profile is the educational work. Translating that into a position requires a practical framework. The following four steps convert research into a decision.
- Assess the macro backdrop. Consult the Federal Reserve Board G.17 release for industrial production data, the ISM Manufacturing Report on Business for monthly PMI readings, and BEA Fixed Assets data for capital expenditure trends. These three sources provide the clearest read on whether the economic environment favours industrial allocations.
- Select sub-sector exposure. Decide whether the allocation should tilt cyclical (machinery, transport), structural (aerospace and defence, utilities), or remain balanced across both. The sub-industry table earlier in this guide provides the orientation.
- Choose the investment vehicle. Match the vehicle to the conviction level:
- XLI for broad, diversified industrial sector exposure
- VIS as a Vanguard alternative with a similar breadth of holdings
- DFEN for targeted, leveraged aerospace and defence exposure with amplified risk
The Federal Reserve G.17 Industrial Production release provides monthly data on manufacturing output, capacity utilization, and industrial activity across major sectors, making it the primary data source for assessing whether current conditions support or argue against new industrial allocations.
- Set monitoring triggers. Industrials require active attention, not a set-and-forget approach. According to the BBH 2026 survey, 57% of ETF investors identified low-volatility and defensive ETFs as their top pick for managing market volatility. Industrials sit at the opposite end of that spectrum. Monitor PMI trends, defence appropriations news, and trade policy developments on at least a quarterly basis.
Before executing any ETF allocation, verify current AUM, expense ratio, and holdings composition at the official fund fact sheet. These figures are not static.
This article is for informational purposes only and should not be considered financial advice. Investors should conduct their own research and consult with financial professionals before making investment decisions.
The industrial sector rewards patience and structural thinking
The industrial sector’s cyclicality is real, and investors who ignore it are likely to experience drawdowns that feel worse than they should. But the sector’s structural tailwinds, spanning automation, energy transition, infrastructure spending, and reshoring-driven capital expenditure, operate on timelines that extend well beyond any single business cycle.
Investors who understand the sub-sector map, choose exposure at the right level of granularity, and verify ETF fundamentals before allocating are positioned for durable returns, not just economic-cycle participation. The practical steps are straightforward: consult the macro data sources, diversify across cyclical and structural sub-industries, and revisit the position quarterly.
The XLI ETF’s double-digit year-to-date return through May 2026 reflects a sector that is already pricing in several of these tailwinds. The question for investors is not whether the industrial sector matters. It is whether they understand it well enough to hold through the volatility that will inevitably arrive between here and the long-term payoff.
Past performance does not guarantee future results. Financial projections are subject to market conditions and various risk factors.