A stock drops 10% in a single session. No announcement. No change in earnings. The company is performing exactly as it was the day before. For most retail investors, that move reads as a warning signal. For professional small cap managers, it often reads as an opportunity.
Small cap volatility is one of the most persistently misread signals in Australian investing. The S&P/ASX Small Ordinaries is widely treated as the riskier end of the market, while large cap names are assumed to be the stable, sensible choice. This framing shapes how hundreds of thousands of Australian retail investors allocate their portfolios, often to their detriment. What follows unpacks what small cap price swings actually reflect, why the blue chip safety assumption does not hold up to scrutiny, and how thinking about this segment differently can change the quality of investment decisions.
When illiquidity moves the price: separating noise from business reality
Consider a stock priced at 1 cent. A single trade pushes it to 1.1 cents. That is a 10% price swing, and the total volume behind it was $5. The business did not change. The earnings did not change. The competitive position did not change. Five dollars changed hands in a thin order book, and the screen flashed red.
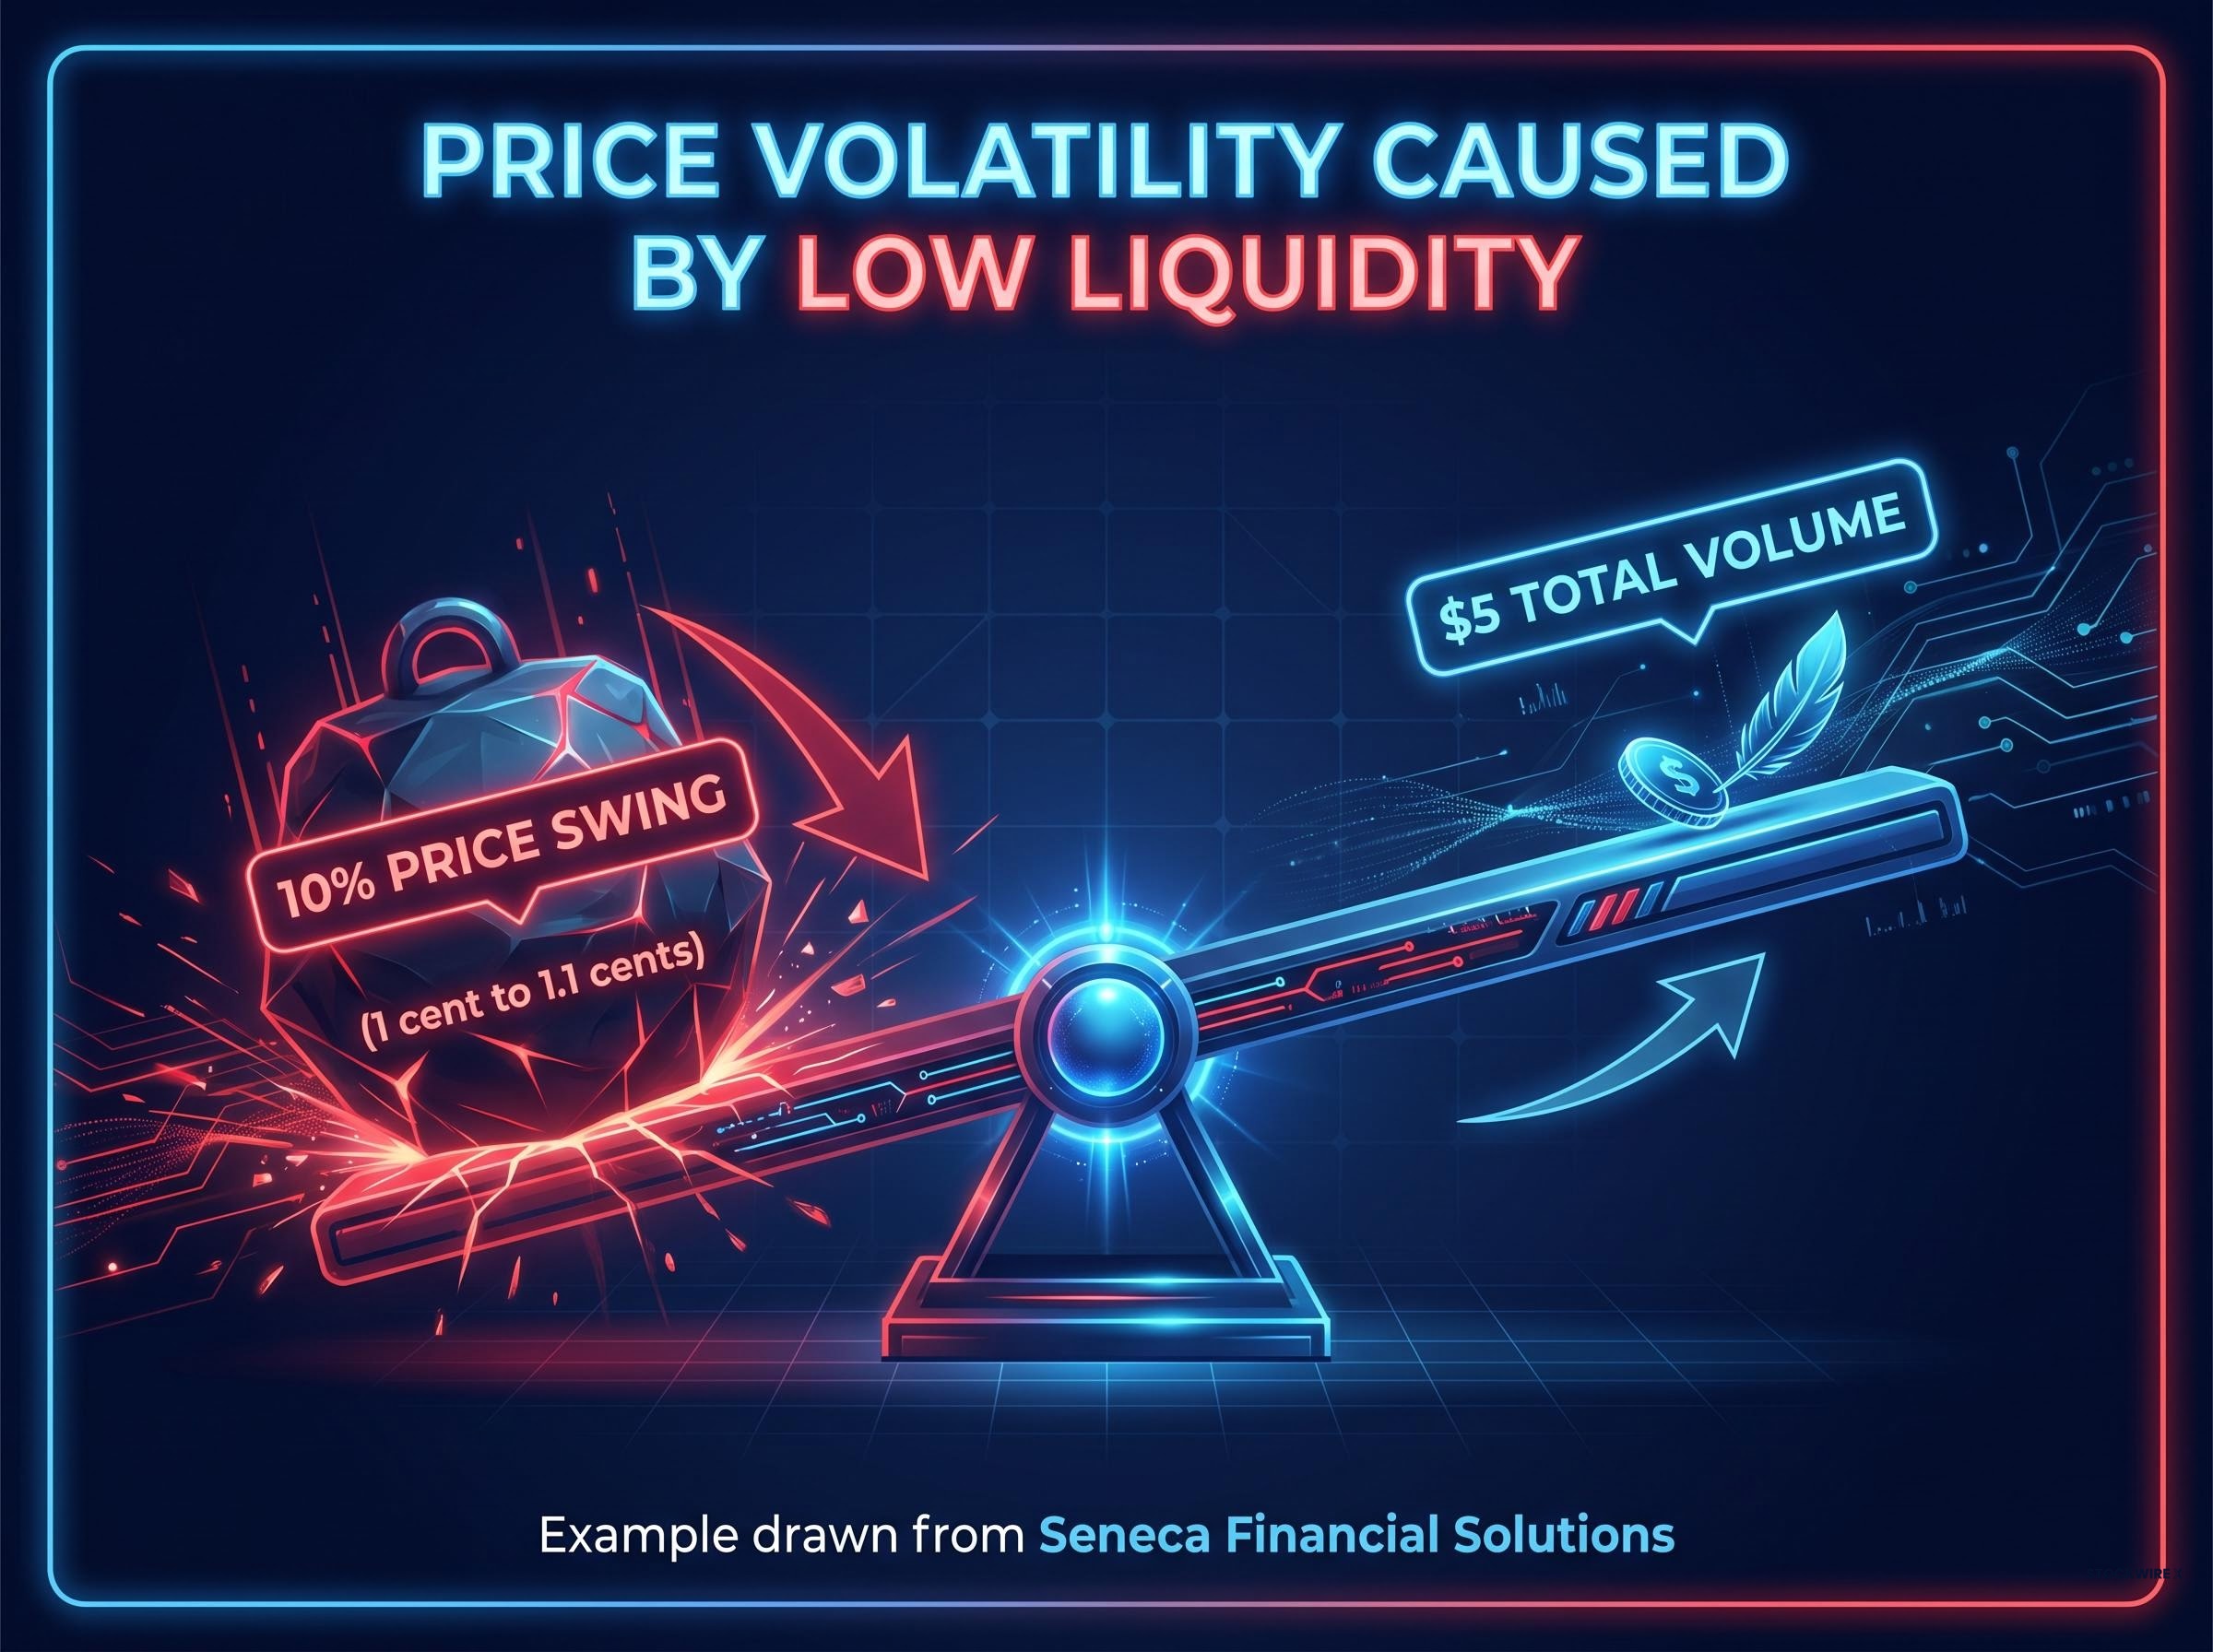
This example, drawn from Seneca Financial Solutions, illustrates a condition that defines the ASX small cap segment: price moves driven by order book thinness rather than any shift in company value or business quality.
What a thin order book actually does to a share price
When a stock has few standing buy orders, even a modest sell order can gap the price lower. This is a market microstructure issue, not a company quality issue. The fewer participants on either side of the book, the larger the price impact of any individual trade.
The pattern plays out across the segment consistently:
- Thin order books amplify the magnitude of price moves relative to the capital actually transacted.
- Those amplified price moves are not evidence of business deterioration; they are artefacts of low participation.
Professional managers operating in this space confirm the distinction repeatedly. Fairlight Asset Management noted in its February 2024 investor letter that multiple portfolio companies experienced drawdowns exceeding 30% on no change to fundamentals and limited trading volume.
“Price volatility is most often a function of liquidity and market positioning rather than deterioration in business quality.” — Fairlight Asset Management, investor letter, 29 February 2024
Spheria Asset Management’s March 2024 quarterly reinforced the point, with portfolio managers Marcus Burns and Matthew Booker noting that daily trading value for many holdings is a fraction of free float, meaning modest fund flows cause substantial price swings. Mark-to-market volatility, they wrote, “should not be confused with business risk.”
An investor who conflates a liquidity-driven drawdown with fundamental deterioration will sell at precisely the wrong moment.
When big ASX news breaks, our subscribers know first
Why volatility became a synonym for risk (and why that equation is wrong)
The instinct to treat volatility as danger is not irrational. In liquid, efficiently priced markets where large numbers of informed participants trade continuously, price moves do tend to reflect genuine new information about a company’s value. A 5% decline in a heavily traded ASX 200 constituent after an earnings miss is likely pricing in real deterioration. In that context, volatility functions as a reasonable proxy for risk.
Stock price mechanics in liquid, widely-covered markets create conditions where price moves are genuinely informative, because large numbers of informed participants are continuously incorporating new data; those same mechanics produce very different signals in thin small cap order books where a single forced seller can gap a stock lower without any change to company fundamentals.
The assumption breaks down in illiquid markets where price discovery is poor and a single seller can gap a stock lower. Ben Griffiths of Eley Griffiths Group wrote in April 2024 that small caps “can move 5-10% on very light volume,” with price moves often “completely unrelated to changes in fundamentals.”
Griffiths described illiquidity as a “double-edged sword” that magnifies drawdowns but also provides entry opportunities when forced sellers hit thin order books.
A structural dynamic deepens this condition. As ETF adoption grows, passive, market-cap-weighted structures concentrate flows into larger index constituents. Smaller companies become relatively under-owned and analytically under-covered, which thins their order books further and widens the gap between price movement and fundamental reality.
Wilson Asset Management’s WAM Microcap half-year report (released February 2025) attributed part of 2024 microcap volatility to “ETF and mandate redemptions” rather than stock-specific fundamentals. Portfolio manager Oscar Oberg noted that microcaps “remain extremely sensitive to marginal buyers and sellers, with sizeable price moves on low liquidity.”
The distinction matters practically. Volatility is a meaningful risk signal when:
ASIC’s retail investor warnings on volatile markets specifically flag the tendency for retail participants to increase trading activity during price swings, a behaviour that can compound losses when the underlying cause of those swings is structural illiquidity rather than genuine business deterioration.
- The stock is liquid and widely covered
- The price move follows material new information
- Multiple independent participants are pricing in the same conclusion
Volatility is more likely a liquidity artefact when:
- The stock trades on thin daily volume relative to free float
- No new announcement or guidance has been issued
- The move coincides with broader fund flow dynamics (ETF redemptions, mandate changes)
The first question to ask after any small cap move is not “what went wrong?” but “who was selling, and was there anyone to buy?”
Large cap stocks and the limits of perceived safety
“Blue chip” has no formal regulatory definition in Australia. ASIC’s Moneysmart guide (updated 2024) describes blue chip shares as “large, well-established companies with a history of stable earnings” but warns that the label does not guarantee safety or returns, noting that “some companies once considered blue chip have performed poorly.” The Australian Financial Review put it more directly in September 2024: the term is “used liberally by brokers and marketers to confer a sense of safety that isn’t always deserved.”
The “blue chip” label is “used liberally by brokers and marketers to confer a sense of safety that isn’t always deserved.” — Australian Financial Review, 12 September 2024
The evidence from recent years supports that assessment. Several of the ASX’s most recognised large cap names have delivered significant capital losses driven by genuine fundamental deterioration, not the illiquidity artefacts described in earlier sections.
| Company | Event | Approximate Impact | Year |
|---|---|---|---|
| Telstra (ASX: TLS) | FY25 guidance downgrade | Billions wiped from market cap in a single session | 2024 |
| Qantas (ASX: QAN) | Profit decline, ACCC case, reputational fallout | Significant share price decline from 2023 highs | 2024 |
| Lendlease (ASX: LLC) | Strategic restructuring and asset write-downs | Described as “destroying billions in shareholder value over the last decade” | 2024 |
| CSL (ASX: CSL) | Ongoing margin pressures, trading below 2021 peak | Extended capital loss despite blue chip status | 2023-2024 |
Seneca Financial Solutions highlighted a comparable pattern from the other direction: a $5 billion market cap company that had its earnings estimates reduced by approximately 80% over six months. The risk in each of these large cap cases was real fundamental risk. The contrast with the small cap drawdowns described in earlier sections is stark: in those cases, the fundamentals did not change. The price moved; the business did not.
For Australian retail investors whose portfolios skew heavily toward large cap names on the assumption of lower risk, the actual risk distribution looks different from the assumption. Scale is not a substitute for earnings quality or balance sheet strength.
ASX 200 earnings risk has become increasingly concentrated in ways that compound the large cap safety assumption: with the equity risk premium at approximately 80 basis points and roughly 10 percentage points of FY26 index-level EPS growth dependent on the resources sector, the ASX 200 prices in a near-perfect earnings delivery that leaves limited buffer if company fundamentals deteriorate.
Why patient investors treat small cap illiquidity as an advantage, not a flaw
The illiquidity that creates those unsettling 10% swings on thin volume is the same structural condition that creates mispricing opportunities. The mechanism is straightforward: when fewer analysts cover a company, fewer investors own it, and fewer trades set the price, the gap between market price and underlying value can widen significantly. Patient capital that can tolerate mark-to-market swings without being forced to sell is positioned to exploit those gaps.
Price and value gaps of this kind are not temporary anomalies; they are a structural feature of markets where passive investing concentrates analytical attention on larger index constituents and behavioural biases cause investors to sell at precisely the moment the gap between market price and business value is widest.
Auscap Asset Management made this argument explicitly in July 2024, writing that patient capital can exploit “price dislocations induced by liquidity-driven selling” and that positions should be treated “as if the market may close for years.”
The structural parallels with private equity are not incidental:
- Analyst coverage: Fewer sell-side analysts, creating more scope for differentiated research
- Liquidity: Lower trading volumes, meaning price reflects sentiment as much as value
- Time horizon: Longer holding periods rewarded more readily than in liquid large cap markets
- Management access: Greater opportunity to engage directly with management teams
- Price efficiency: Less efficient pricing, creating wider gaps between market price and intrinsic value
Spheria Asset Management described its own process in 2024 investor presentations as “private-equity style research in public small caps,” referencing site visits and unit economics modelling. Auscap highlighted the opportunity to “partner with management teams over multi-year periods.”
What patience actually buys you in a thinly traded stock
The illiquidity premium, the excess return available from investing in less liquid securities, is only accessible to investors who can hold through the volatility without being forced to sell. This is why time horizon matters more than risk tolerance as a qualifying characteristic for small cap exposure.
The payoff for that patience can be substantial. Seneca Financial Solutions referenced a portfolio holding that had delivered dividend growth exceeding 15% per annum at a market capitalisation of approximately $280-287 million. Strong fundamental performance is entirely possible in smaller companies; it simply coexists with a price chart that looks far more volatile than the underlying business warrants.
What rigorous risk assessment actually looks like in ASX small caps
If daily price movement is not a reliable risk signal in small caps, what is? Genuine risk concentrates in fundamentals: balance sheet quality, earnings reliability, management track record, and the durability of competitive position.
Professional managers build portfolios designed to isolate these factors while managing the liquidity challenge. The ASX Investor Study 2023 found that only 10% of Australian investors held small cap or micro cap shares directly, compared with 58% holding large cap shares. The gap reflects the perception of difficulty, but the discipline behind professional small cap investing is well defined.
Seneca Financial Solutions works from an investable universe of more than 1,000 ASX-listed companies, constructing a concentrated portfolio of approximately 20-60 holdings. Spheria runs 30-50 stocks and avoids owning more than a set percentage of free float to maintain exit flexibility. Fairlight holds 30-40 names, applying liquidity screens and position sizing caps to ensure portfolios can be liquidated within a defined number of trading days under stressed volumes. WAM Microcap maintains 50-70 holdings, with position sizing linked to company quality, balance sheet strength, and liquidity.
The five questions to ask before selling on a down day
For retail investors who may not run concentrated, research-intensive portfolios, the framework simplifies to a practical sequence. Before concluding that a small cap price move reflects genuine risk, work through these questions in order:
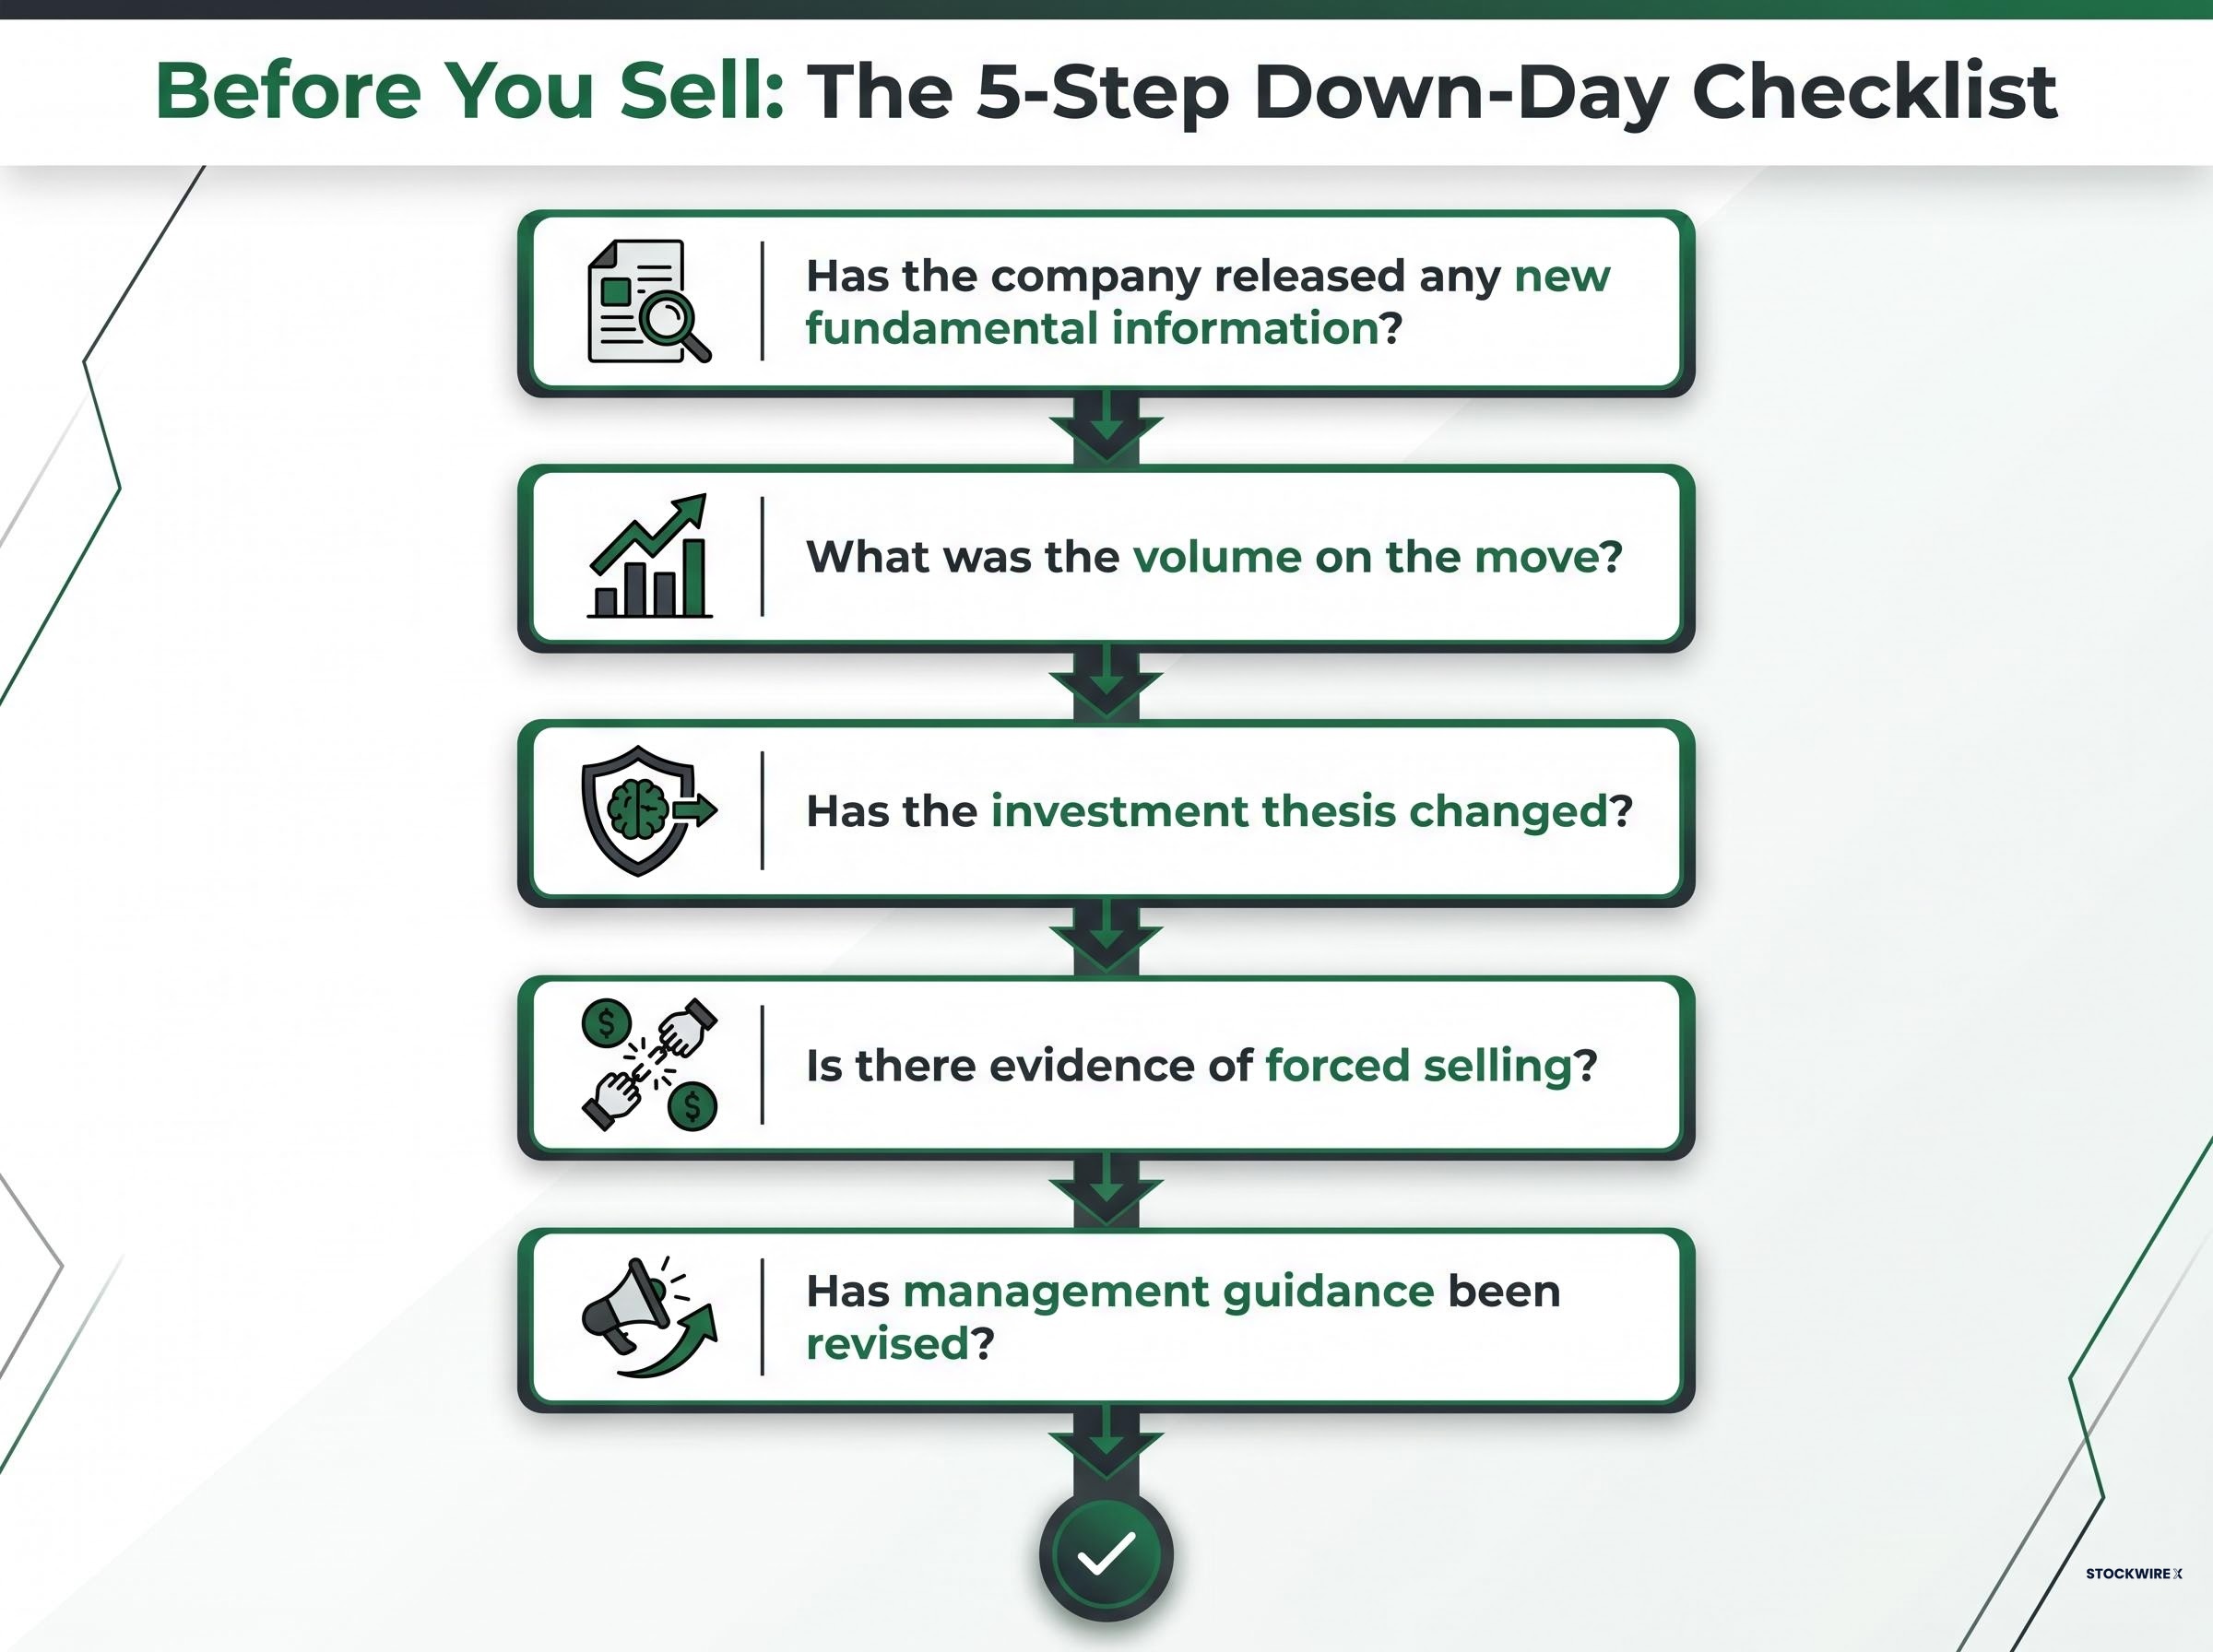
- Has the company released any new fundamental information? Check the ASX announcements platform. If nothing has been disclosed, the price move is less likely to reflect a business change.
- What was the volume on the move? A large percentage decline on minimal volume is a liquidity event, not a verdict on the company.
- Has the investment thesis changed? Revisit the original reasons for buying. If the competitive position, earnings trajectory, and balance sheet remain intact, the thesis has not deteriorated.
- Is there evidence of forced selling? ETF redemptions, mandate changes, or end-of-quarter rebalancing can create selling pressure unrelated to company quality.
- Has management guidance been revised? If the company has not downgraded its outlook, the most likely explanation for the move is structural rather than fundamental.
The sequence matters. Check fundamentals before liquidity, and liquidity before sentiment. That order prevents the most common retail error: interpreting a liquidity-driven drawdown in a sound business as a reason to sell.
Volatility is not the enemy. Misreading it is.
For most Australian retail investors, the instinctive equation of small cap volatility with danger is backwards. It mistakes the symptom, price movement caused by illiquidity, for the disease, genuine business deterioration. The cases examined here show that real fundamental risk has destroyed more wealth in supposedly safe large cap names than illiquidity-driven drawdowns have in fundamentally sound small caps.
That does not mean genuine risk is absent from the segment. It means distinguishing liquidity-driven volatility from fundamental risk requires effort and a longer time horizon than most retail investors apply. Building the habit of asking “what caused this move?” before “should I sell?” is the most transferable skill this distinction provides.
The next time a small cap holding drops 10% on no news, the appropriate first response is not alarm. It is investigation.
Investors exploring how to access the small cap illiquidity premium without running a concentrated, research-intensive portfolio will find our full explainer on quality-screened small cap ETFs, which examines the VanEck QSML structure, the profitability filters that distinguish it from broad passive indexes, and the three historical triggers for small cap leadership that were partially in place as of mid-2026.
This article is for informational purposes only and should not be considered financial advice. Investors should conduct their own research and consult with financial professionals before making investment decisions.
—