
The S&P 500 closed April 2026 at 7,209, an all-time record, capping a month that delivered roughly 10.5% in gains alone. That performance arrived inside the very six-month window that one of Wall Street’s oldest adages says investors should avoid entirely. Every spring, the phrase “sell in May and go away” resurfaces in headlines, portfolio discussions, and retail investor anxiety. It circulates with far more confidence than the evidence behind it is ever examined.
What follows traces the adage from its pre-electronic origins through nearly a century of S&P 500 data, surfaces the specific numbers that define the April-to-October window, and explains why the same data that confirms a seasonal pattern simultaneously argues against mechanical selling.
How a horse racing calendar became an investment rule
The adage belongs to a world that no longer exists. When it first took hold, all securities transactions occurred physically on exchange trading floors in major financial centres. Summer meant traders left for country estates and coastal towns. Their absence genuinely reduced liquidity, thinned order books, and widened price swings during the warmer months.
The adage’s floor-trading origins reflect a genuine historical reality: when participation thins, supply and demand mechanics shift in ways that genuinely widen spreads and amplify price moves, making seasonal withdrawal a structural risk in a market where liquidity depended on physical presence.
The cultural anchor was British. The St Leger Stakes, a horse race held each September in Doncaster, historically marked the symbolic end of the summer season. The advice was simple: sell your positions before summer, return to markets after the St Leger.
Decades later, researchers formalised what had been a gentleman’s calendar rule into a quantitative pattern, identifying April 30 through October 31 as the measurably weakest average six-month window on the calendar. The adage evolved in three distinct stages:
- Floor-trading culture: summer absences reduced participation and liquidity
- British racing calendar anchor: the St Leger Stakes marked the symbolic return date
- Quantitative seasonal pattern identification: researchers measured the April-to-October window as the weakest rolling six-month period
That evolution matters. A rule born from physical absence on a trading floor carries different weight in a market where algorithms never take holidays.
When big ASX news breaks, our subscribers know first
What nearly 100 years of S&P 500 data actually shows
The headline number is real. According to Finaeon, Inc. data covering 1926 through 2025, the April 30 to October 31 window has historically averaged approximately 4.5% in returns, making it the weakest six-month calendar window on average across the full dataset.
That figure, on its own, sounds like vindication for the adage. It is not.
No six-month calendar window in the same dataset has averaged a negative return. “Weakest” means weaker than the November-through-April stretch. It does not mean bad, and it does not mean losing money.
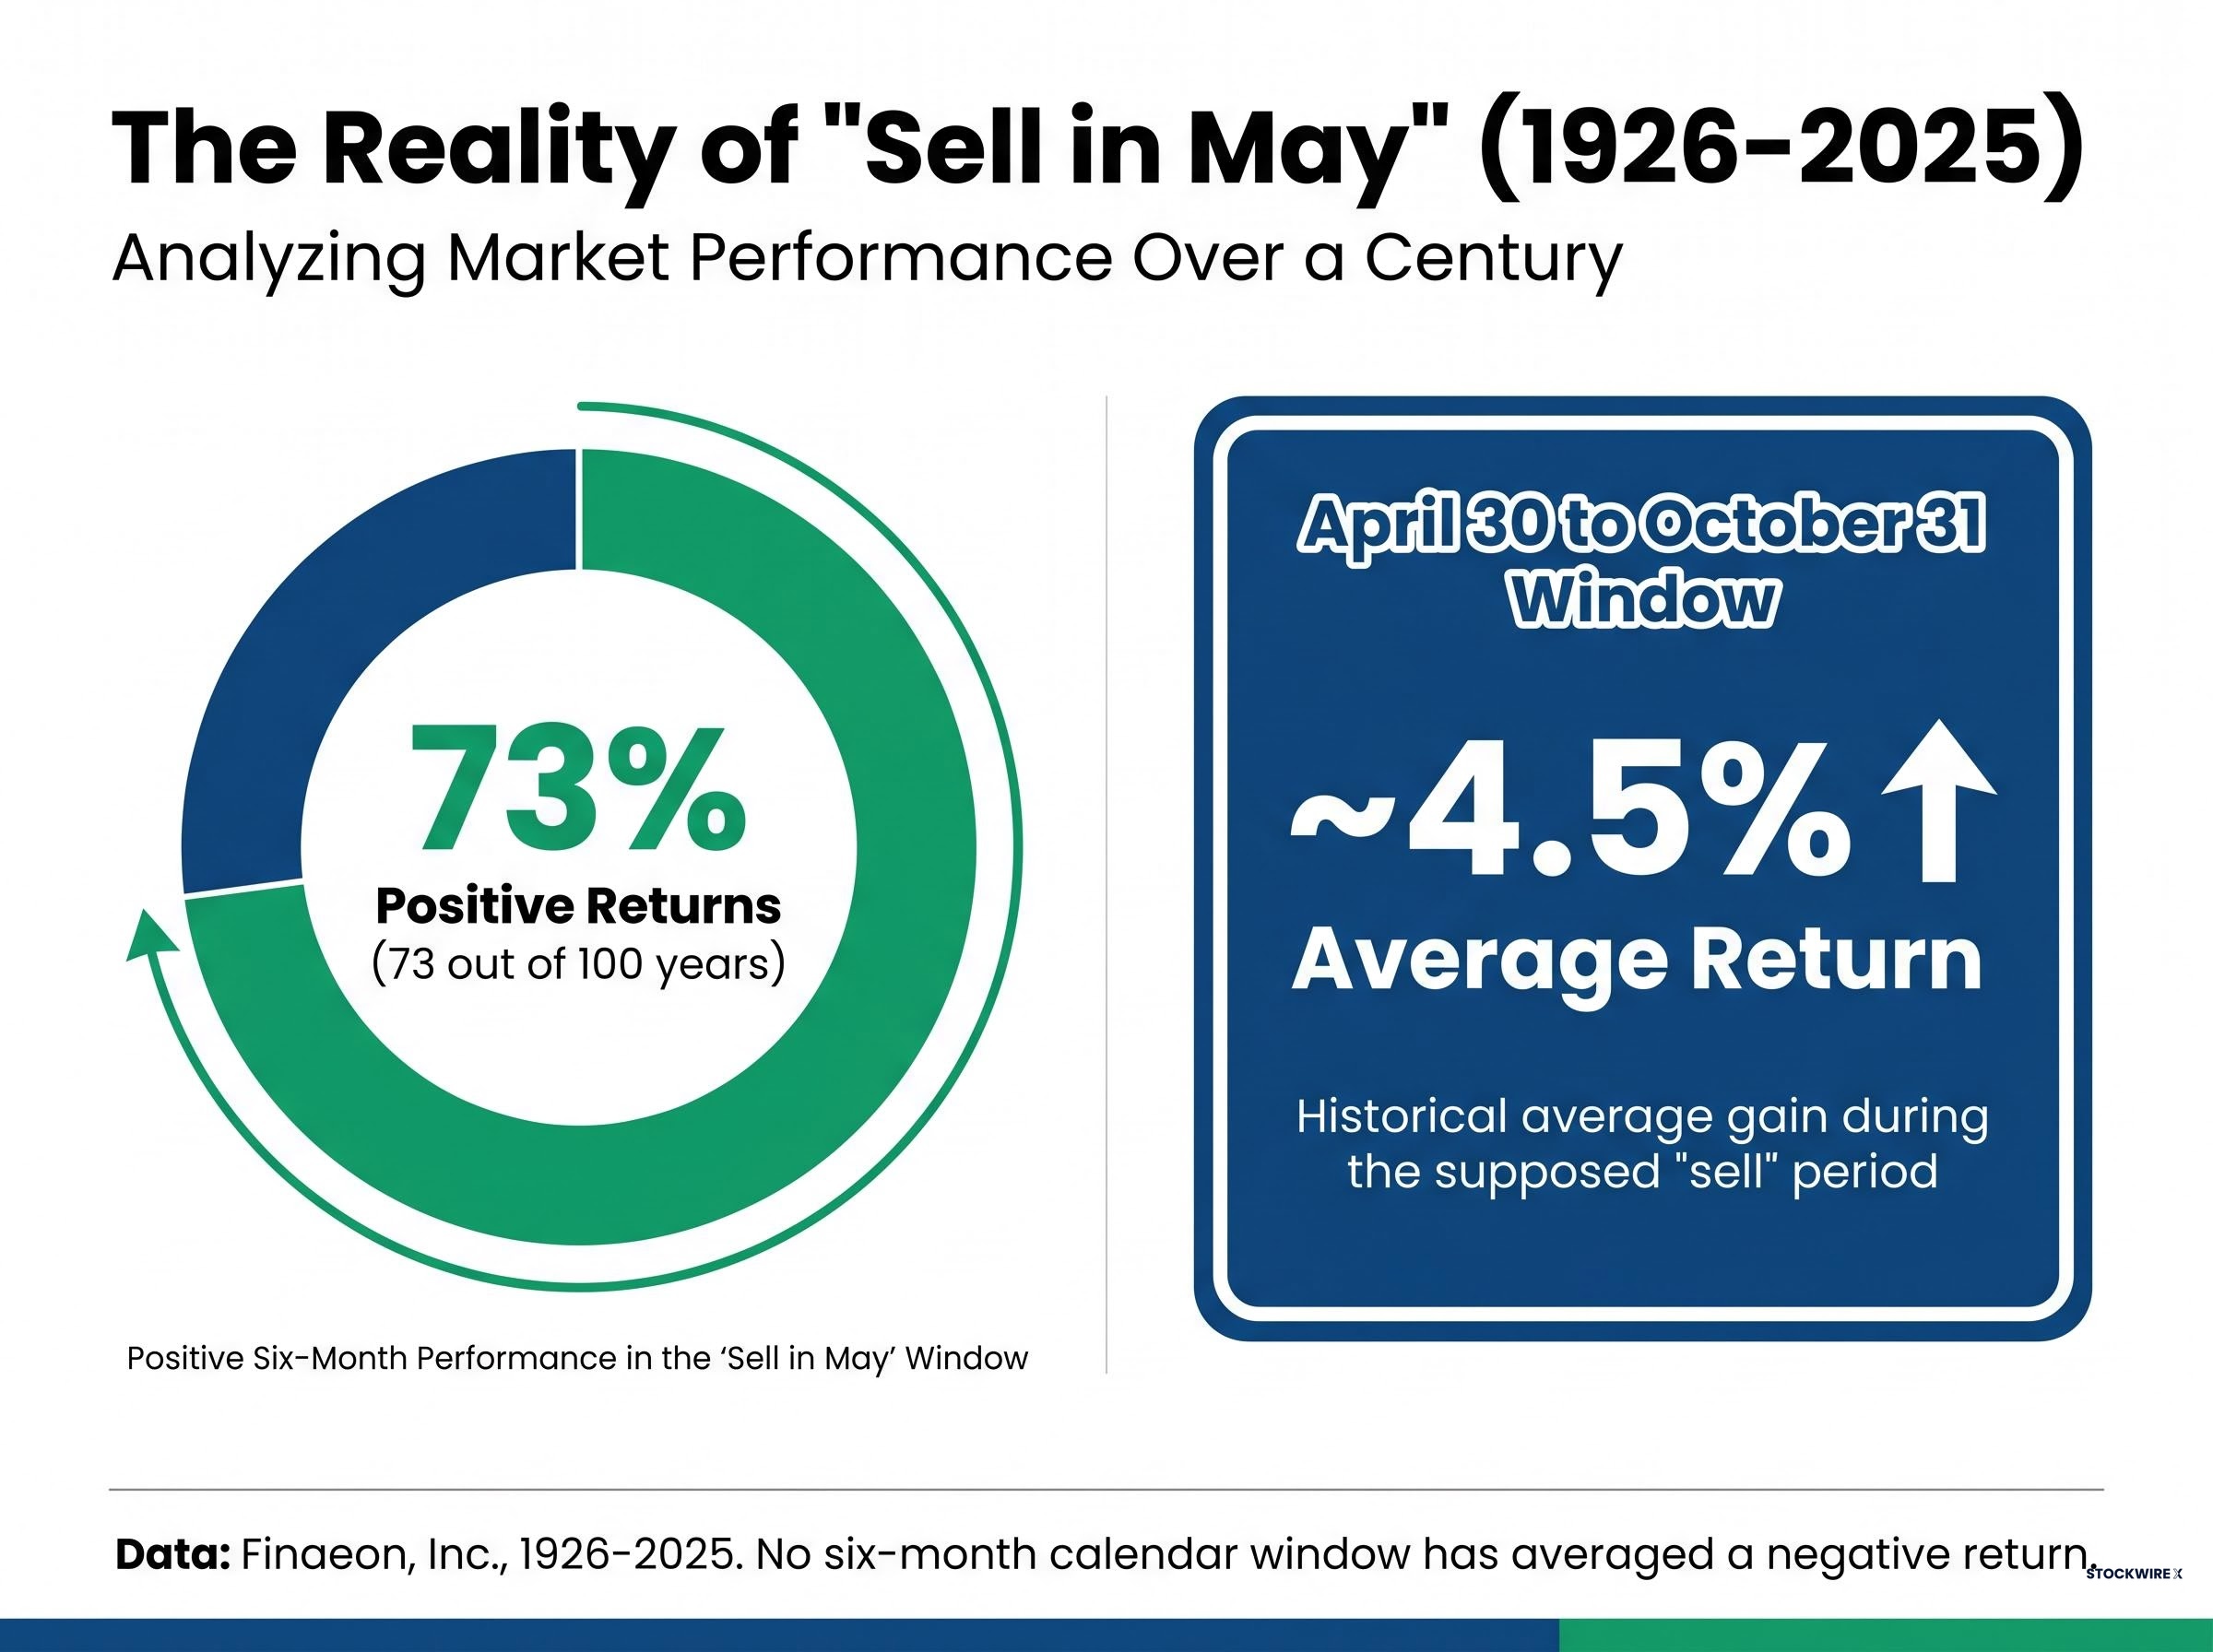
| Metric | Value |
|---|---|
| Average return, Apr 30 to Oct 31 (1926-2025) | ~4.5% |
| Any six-month window with negative avg. return | None |
| Positive return frequency, Apr 30 to Oct 31 | 73 out of 100 years (73%) |
The difference between “weakest” and “negative”
The 4.5% average is below what the stronger half of the calendar delivers. But it remains a positive expected return, and positive expected returns compound meaningfully over decades when not foregone.
The April 30 to October 31 window produced positive S&P 500 returns in 73 out of 100 years, or 73% of the time, from 1926 onward (Finaeon, Inc., as of 29 May 2026).
An investor mechanically exiting each May would have sat in cash during a rising market in roughly three out of every four years. The pattern is measurable. The instruction to act on it is where the logic breaks.
Why investors remember the losses but not the gains: the psychology of the pattern
If the window is positive 73% of the time, the adage should have faded decades ago. It has not. The reason is psychological, not statistical.
Memorable summer selloffs, the kind that produce sharp August drawdowns or sudden volatility spikes, create stronger mental imprints than unremarkable positive summers. A flat July followed by a steady August leaves no mark. A 5% weekly drop in late August stays vivid for years. This is availability bias at work: the events easiest to recall feel the most representative, regardless of how frequently they actually occur.
Loss aversion amplifies the effect. The 27% of years when the window produced negative returns feel disproportionately significant compared to the 73% of positive years. A loss of 8% over one summer registers more intensely than a gain of 6% over three consecutive summers combined.
Morningstar’s ‘Mind the Gap’ research quantifies what loss aversion bias costs investors in practice: a recurring shortfall of roughly 1-2 percentage points per year, driven primarily by selling near market lows and re-entering only after prices have already recovered, exactly the sequence a mechanical May exit invites.
Three cognitive mechanisms sustain the adage well beyond what the base rate justifies:
- Availability bias: dramatic summer losses are easier to recall than quiet positive summers
- Loss aversion: negative outcomes carry roughly twice the psychological weight of equivalent gains
- Annual media recurrence: every spring, fresh commentary on the adage renews the sense that the risk is current and salient
Consider the current environment. The S&P 500 gained approximately 10.5% in April 2026 alone, closing at a record 7,209 (Crestwood Advisors, May 2026). An investor weighing a mechanical May exit right now confronts a recency anchor that actively contradicts the adage, yet the phrase still generates attention.
How modern markets have quietly eroded whatever edge existed
Even setting aside the psychology, the structural cause of the pattern has largely dissolved.
The StoneX RSHIP equity strategy team framed the adage as “dated” in its May 2026 analysis, pointing to three forces that have reshaped how markets function since the era of floor-based trading:
- Passive index funds now hold a substantial share of US equities. These funds do not exit markets in May by mandate. They hold continuously, absorbing and dispersing the seasonal liquidity withdrawal that originally underpinned the pattern.
- Quantitative and algorithmic strategies trade on volatility, factor signals, and intraday patterns rather than calendar folklore. Any predictable seasonal withdrawal effect is identified and arbitraged away before it can produce a reliable edge.
- Globalisation and 24-hour electronic trading have replaced the geographically concentrated, physically floor-based market that the original adage described. When London’s trading floor empties for summer, Tokyo, New York, and Sydney do not.
Investment Company Institute data on passive fund assets as of March 2026 quantifies how thoroughly index funds have reshaped US equity ownership, with indexed mutual funds and ETFs now commanding a share of total fund assets large enough to sustain continuous market participation through periods that seasonal sellers would otherwise vacate.

Dave Keller, Chief Market Strategist at StockCharts, characterised “Sell in May” in May 2026 as a “sentiment phrase” rather than a trading signal, recommending that investors respect price trend and breadth signals rather than date-driven exits.
The market the adage was built for no longer exists. The pattern it describes may persist as a statistical residue, but the mechanism that created it has been replaced by continuous, globally distributed participation.
The hidden costs of actually following the rule
Grant, for argument’s sake, that an investor still finds the seasonal data persuasive. The practical act of following the rule introduces costs that the adage never accounts for.
- Capital gains tax realisation: Exiting in May triggers taxable events. For positions held less than one year, gains are taxed at short-term capital gains rates, which are materially higher than long-term rates for most US investors. A strategy that forces annual selling systematically converts long-term holdings into short-term taxable events.
- Opportunity cost from missed rallies: April 2026 delivered approximately 10.5% in gains. A mechanical May exit would have caused an investor to miss one of the strongest single months on record in the period immediately before the supposed danger window opened. Multiple recent market environments, including the 2025-2026 period, demonstrate that this cost is recurring, not hypothetical.
- Institutional tracking error: Investors with benchmark mandates face structural barriers to implementing the strategy. Any deviation from continuous equity exposure introduces tracking error relative to benchmarks, a measurable performance drag that compounds over time.
IRS Publication 550 defines the one-year holding period threshold that separates short-term from long-term capital gains, and it is that threshold which makes annual May selling so tax-inefficient: positions sold before reaching twelve months are taxed at ordinary income rates rather than the preferential long-term rates most equity investors are building toward.
Carnegie Investment Counsel’s May 2026 commentary framed the mid-year environment as a “mix of competing forces,” with geopolitics, consumer pressure, and earnings trends all operating simultaneously. The point is instructive: macro drivers overwhelm calendar-based positioning, and the investor who exits in May is not removing risk. That investor is replacing market risk with the risk of being wrong about the calendar.
Macro drivers can overwhelm any calendar-based positioning both to the upside and the downside: with Goldman Sachs, J.P. Morgan, and Moody’s Analytics placing 12-month US recession probability at 30%, 35%, and 48.6% respectively as of April 2026, the question of whether to hold through May is secondary to whether the fundamental conditions underpinning the current index level are coherent.
This article is for informational purposes only and should not be considered financial advice. Investors should conduct their own research and consult with financial professionals before making investment decisions.
A more useful seasonal framework than binary selling
The alternative is not to ignore seasonality entirely. It is to treat seasonal data as one input among several, rather than a standalone trigger for exiting equities.
Technical strategists offer one framework. Dave Keller of StockCharts recommends watching for confirmed technical deterioration, a breakdown in price trend, narrowing market breadth, or a failure to hold support, rather than selling because the calendar reads May. The date is not the signal. The market’s behaviour is.
Fundamental analysts offer another. StoneX and Carnegie Investment Counsel both emphasise that earnings revisions, Federal Reserve policy direction, and macro conditions are the primary inputs to mid-year positioning. If earnings are accelerating and credit markets are stable, the calendar date carries little weight.
A three-step alternative framework replaces the binary sell-or-hold decision:
- Assess price trend and market breadth. Exit only when confirmed technical deterioration appears across multiple signals, not when a date arrives.
- Review earnings revisions and macro conditions. If forward estimates are rising and credit spreads are stable, the fundamental case for staying invested remains intact.
- Use seasonal data as a secondary risk-awareness input only. The 4.5% average return for the window is worth noting as context, not worth acting on as a trigger.
This approach works across different market regimes, not just the bull markets where the adage’s costs are most visible.
Investors wanting to understand which data-backed seasonal patterns carry stronger predictive weight than the May adage will find our full explainer on the midterm election stock market cycle useful; it examines why the S&P 500 has averaged 15.4% gains in the 12 months following midterms since 1950 and how the 2026 setup maps onto that historically more reliable pattern.
The data has spoken: the pattern is real, but the instruction is wrong
The April-to-October window is measurably the weakest six-month period on the calendar. That finding is statistically real, supported by data spanning 1926 through 2025. It has also been positive 73% of the time, and no six-month calendar window has ever averaged a negative return historically.
Structural changes in market participation, the tax friction of annual selling, and the opportunity cost of missed rallies further weaken the case for mechanical implementation. The adage describes a pattern. It does not deliver a strategy.
Readers arriving at this article during the May 2026 window are now inside the period the adage warned about, sitting on an S&P 500 at 7,209 after the strongest April in recent memory. A century of data mostly argues for staying the course, absent specific signals that the market’s trend, breadth, and fundamentals have deteriorated. The calendar, on its own, is not one of those signals.
Past performance does not guarantee future results. Financial projections are subject to market conditions and various risk factors.