An Australian investor holding VGS, IVV, and NDQ across three separate ETFs might reasonably assume they own hundreds of companies spread across dozens of countries. The reality is more concentrated than that assumption suggests. Their three largest stock positions are likely Nvidia, Apple, and Microsoft, repeated in every single fund simultaneously. This combination of one global fund, one US fund, and one tech-growth fund represents one of the most common multi-ETF portfolios among Australian retail and SMSF investors, with combined funds under management totalling approximately $70 billion as of May 2026. The appeal is intuitive. The problem is structural and invisible unless you look inside each fund. What follows explains precisely why holding these three ETFs together compounds concentration rather than creating diversification, what the actual holdings numbers look like right now, and how any Australian investor can audit their own portfolio using free, accessible tools in a single afternoon.
The diversification assumption that quietly breaks down
The investor’s logic runs like this: VGS covers developed markets globally, IVV delivers deep US exposure, and NDQ captures high-growth technology. Three different providers, three different index acronyms, three different return profiles. The assumption is that different fund names and different benchmarks mean different underlying holdings.
That assumption rests on a category error. All three indices are cap-weighted, which means the largest companies in the world by market capitalisation dominate all three simultaneously. Different labels do not guarantee different stocks.
The gap between an ETF’s label and its underlying holdings is a recurring theme across passive investing, and what ETF ownership actually means in practice differs from the intuitive assumption that buying a fund is equivalent to spreading risk evenly across all its constituents.
- VGS (Vanguard MSCI Index International Shares ETF): Tracks the MSCI World ex-Australia Index across 70-plus countries. Funds under management approximately $46.9 billion.
- IVV (iShares S&P 500 ETF): Tracks the S&P 500 Index. Funds under management approximately $13.4 billion.
- NDQ (BetaShares NASDAQ 100 ETF): Tracks the Nasdaq-100 Index. Funds under management approximately $9.7 billion.
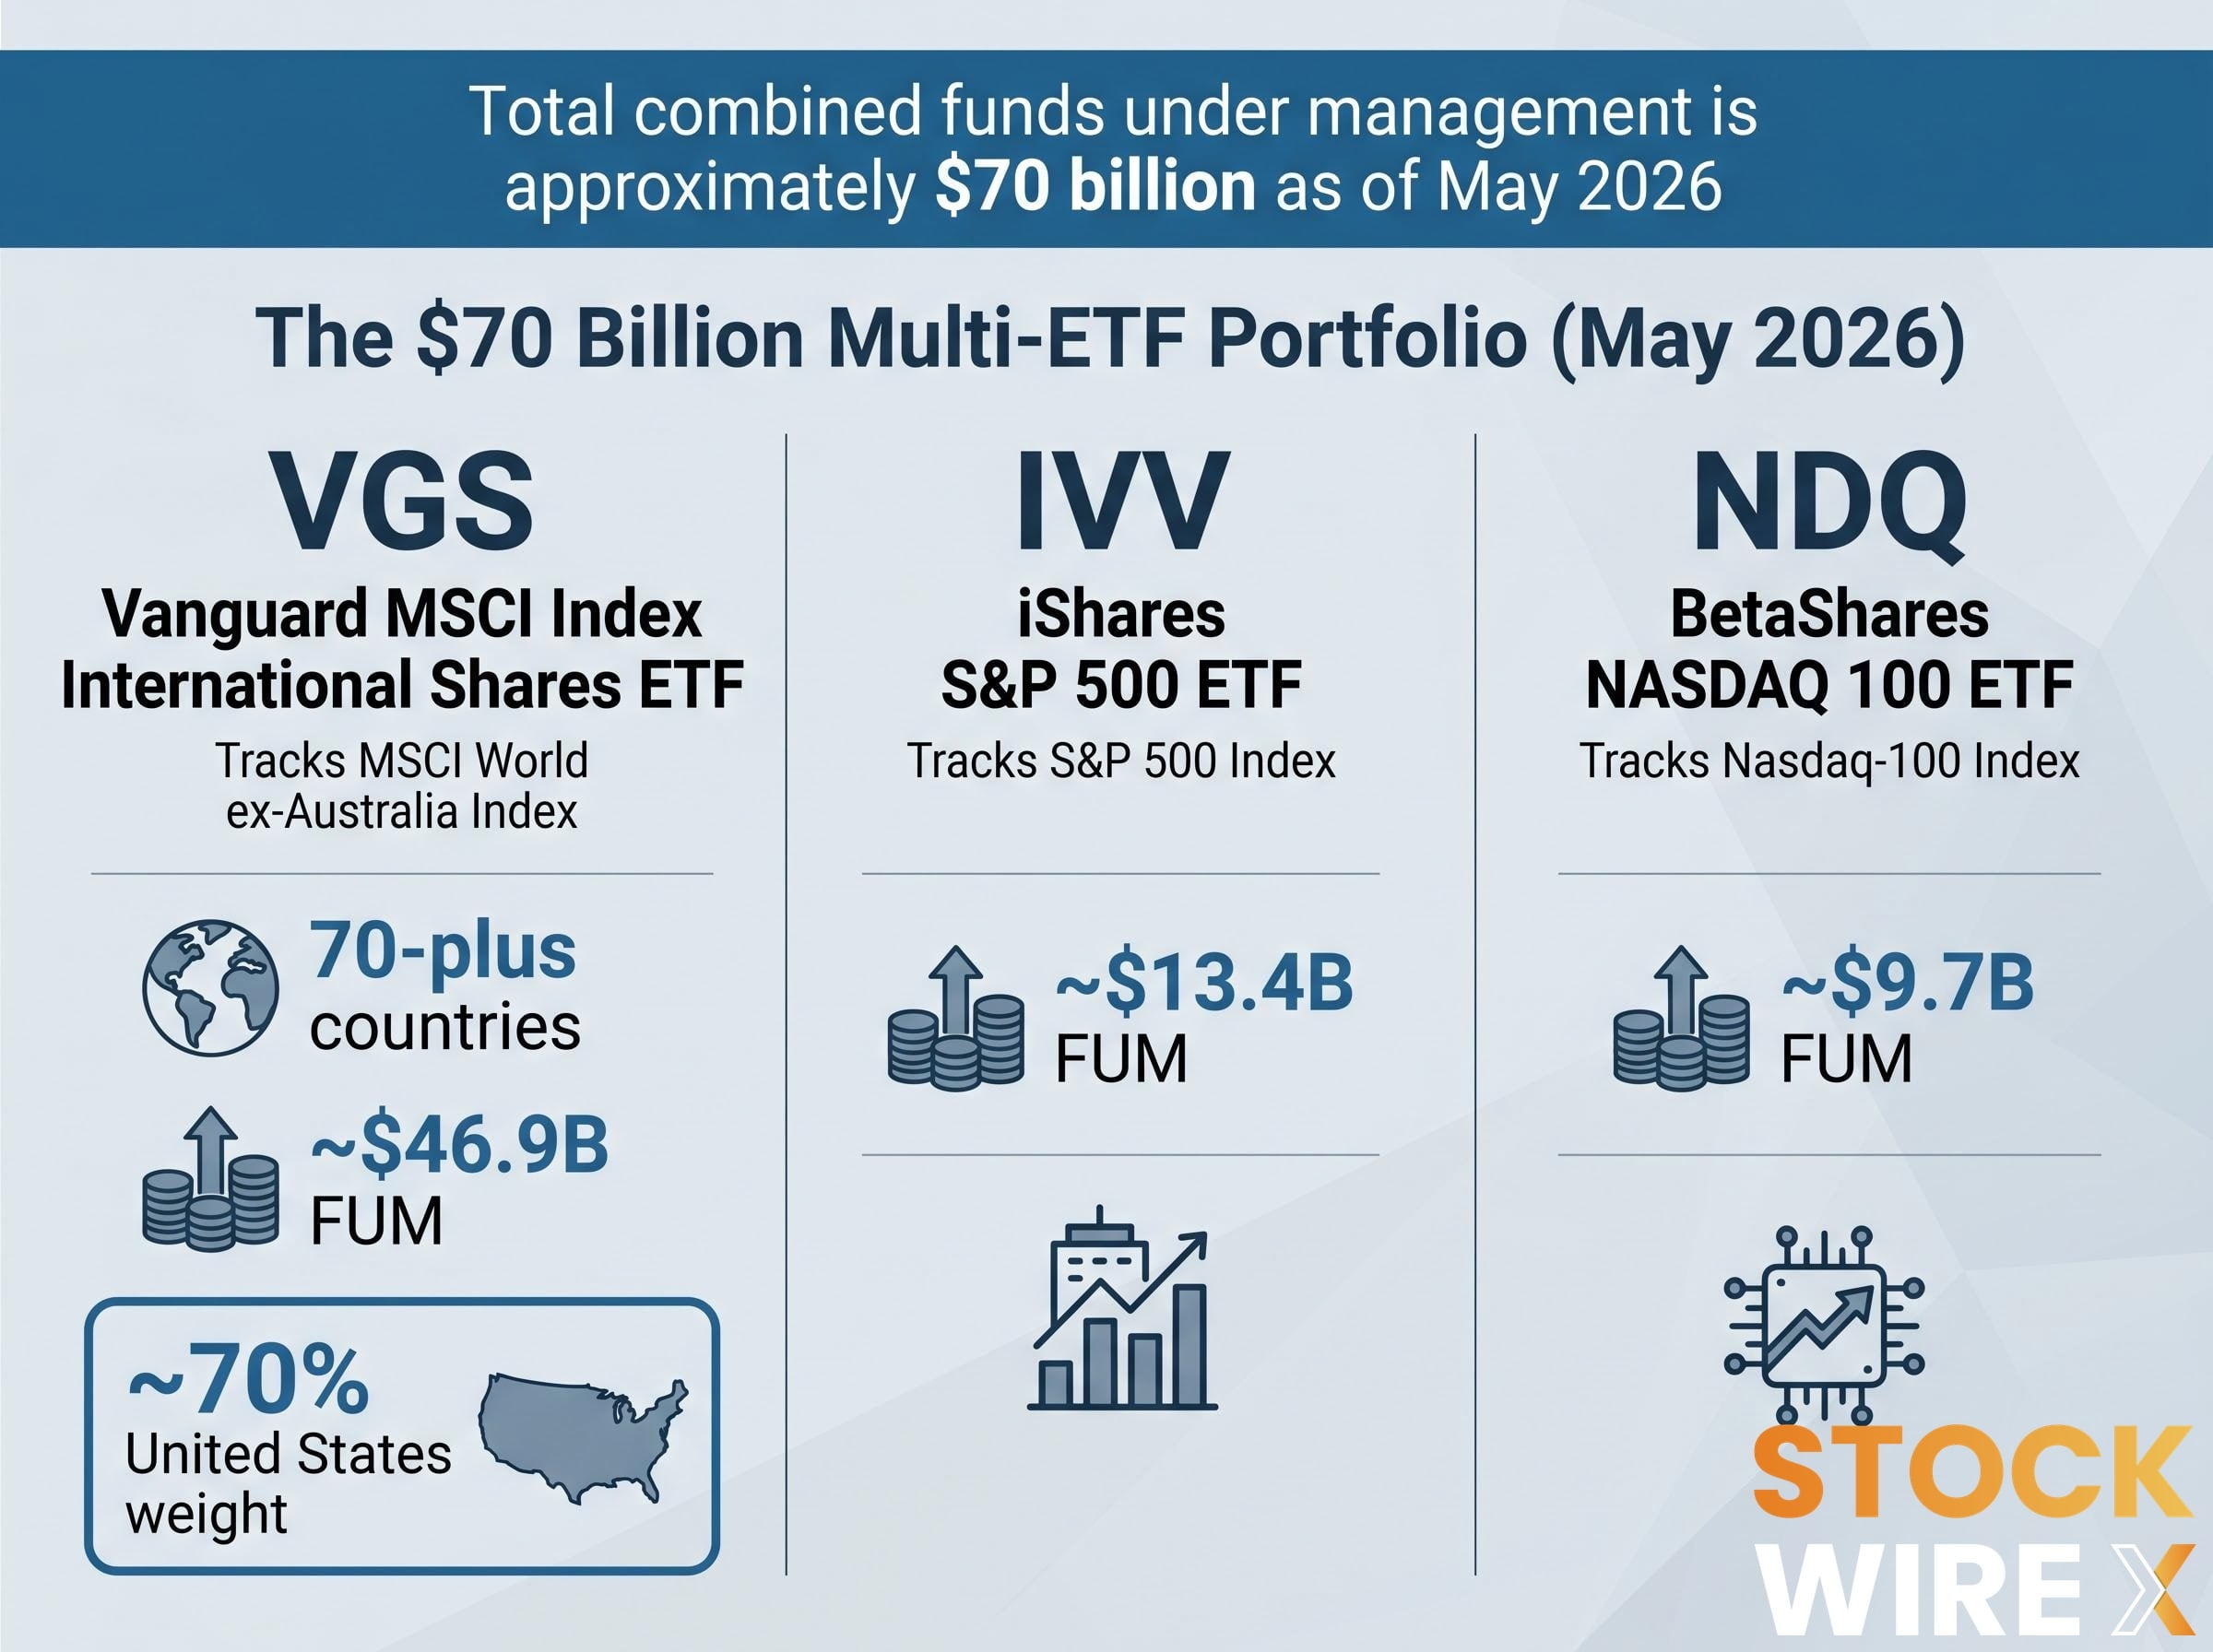
VGS covers dozens of developed economies, yet the United States alone constitutes approximately 70% of its weight. That single figure is the first sign the diversification assumption is breaking down. The rest of this article explains why.
When big ASX news breaks, our subscribers know first
Why cap-weighted indices funnel money to the same handful of stocks
In a cap-weighted index, each company’s share of the index is determined by its market capitalisation. The more a company is worth, the larger its allocation. Passive ETFs tracking these indices replicate that weighting automatically, which means they hold more of the most valuable companies and less of everything else.
This is not a flaw in any individual product. It is the mechanical output of how the index is built. The MSCI World ex-Australia, the S&P 500, and the Nasdaq-100 all draw from the same pool of US mega-cap technology companies at or near their top weights, because those companies happen to be the most valuable on earth by market capitalisation.
Nvidia constitutes 8.59% of the S&P 500 index as of 18 May 2026, despite being one of 500 constituents.
An investor tracking any of these three indices is not making three independent stock selection decisions. They are following the same gravitational pull toward the same companies, three times over.
US index concentration has reached levels that now exceed historical peaks from the 1930s, with five mega-cap stocks controlling roughly 23% of the broad market index and accounting for more than half of April 2026’s market recovery, a dynamic that compounds the overlap problem for any Australian investor running multiple US-exposed ETFs simultaneously.
The Magnificent 7 and why they appear in every index
The so-called Magnificent 7, Apple, Microsoft, Nvidia, Alphabet, Amazon, Meta, and Tesla, are mega-cap companies listed on US exchanges. Their market capitalisations make them eligible for, and dominant within, all three underlying indices simultaneously.
This is not a comment on the quality or prospects of these businesses. It is a structural consequence. When the same companies are the largest constituents in every cap-weighted index, holding multiple cap-weighted ETFs does not spread risk across them. It layers the same risk on top of itself.
What the actual numbers show across VGS, IVV, and NDQ
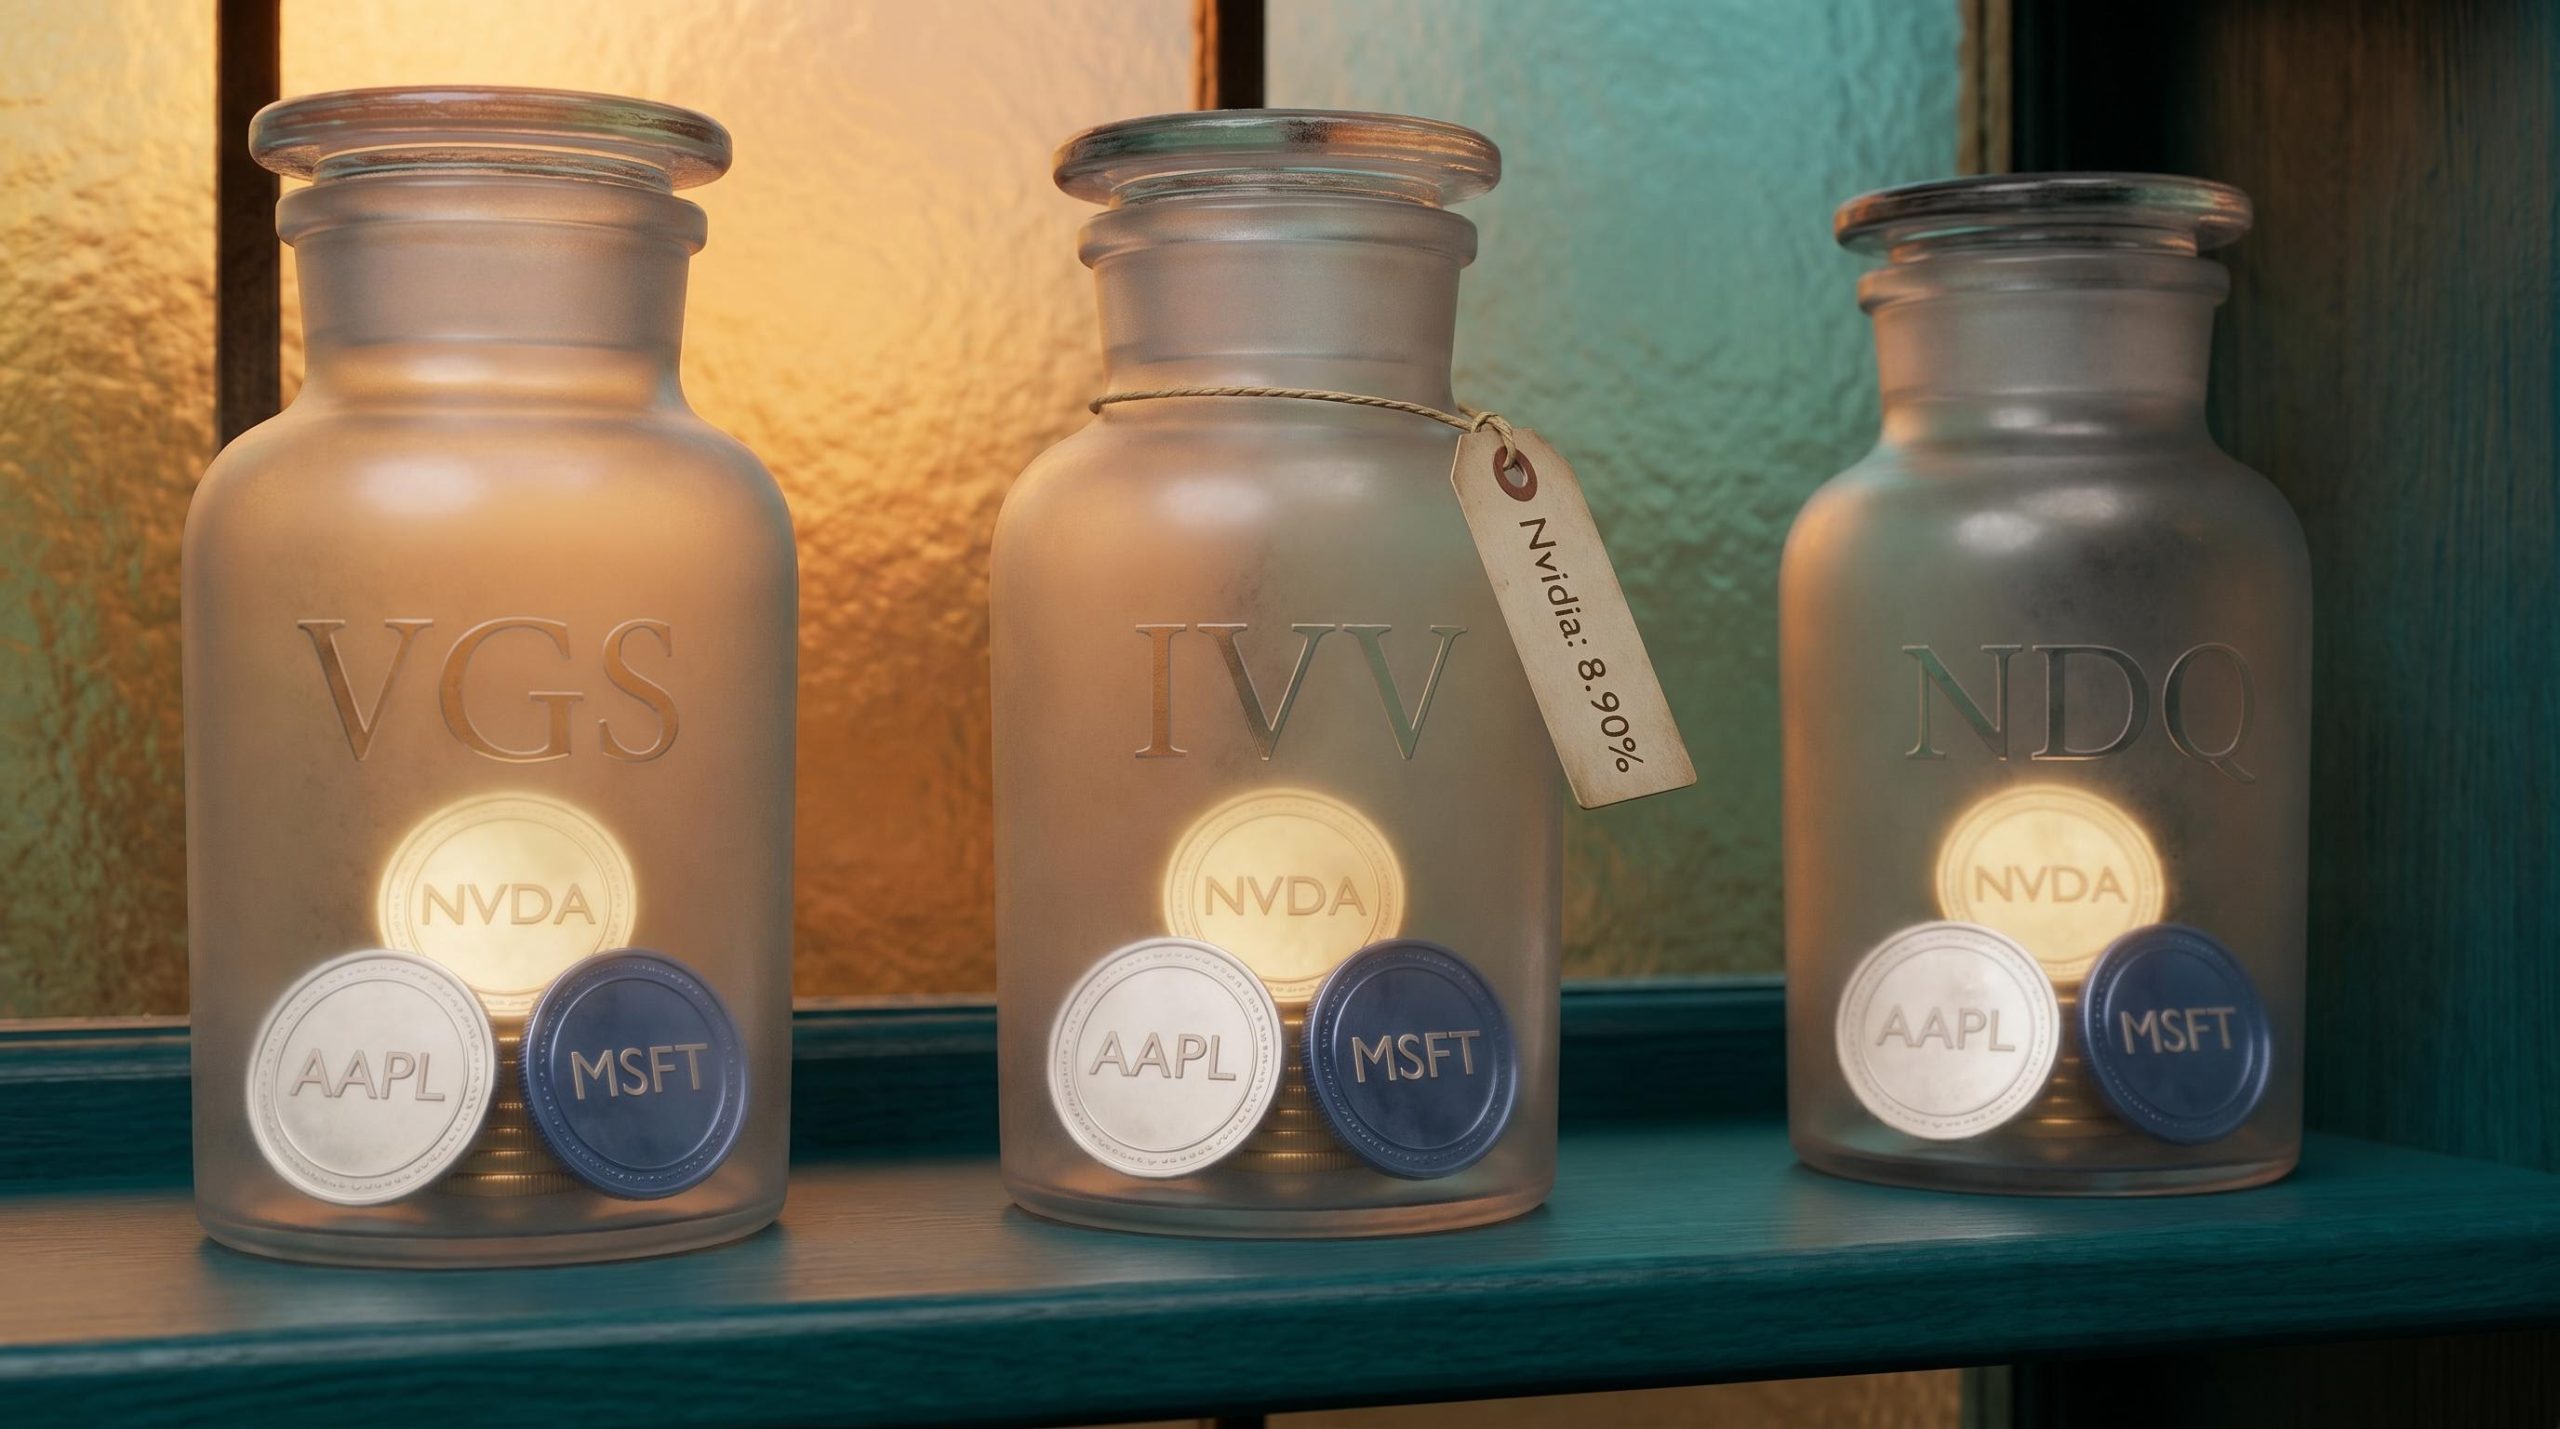
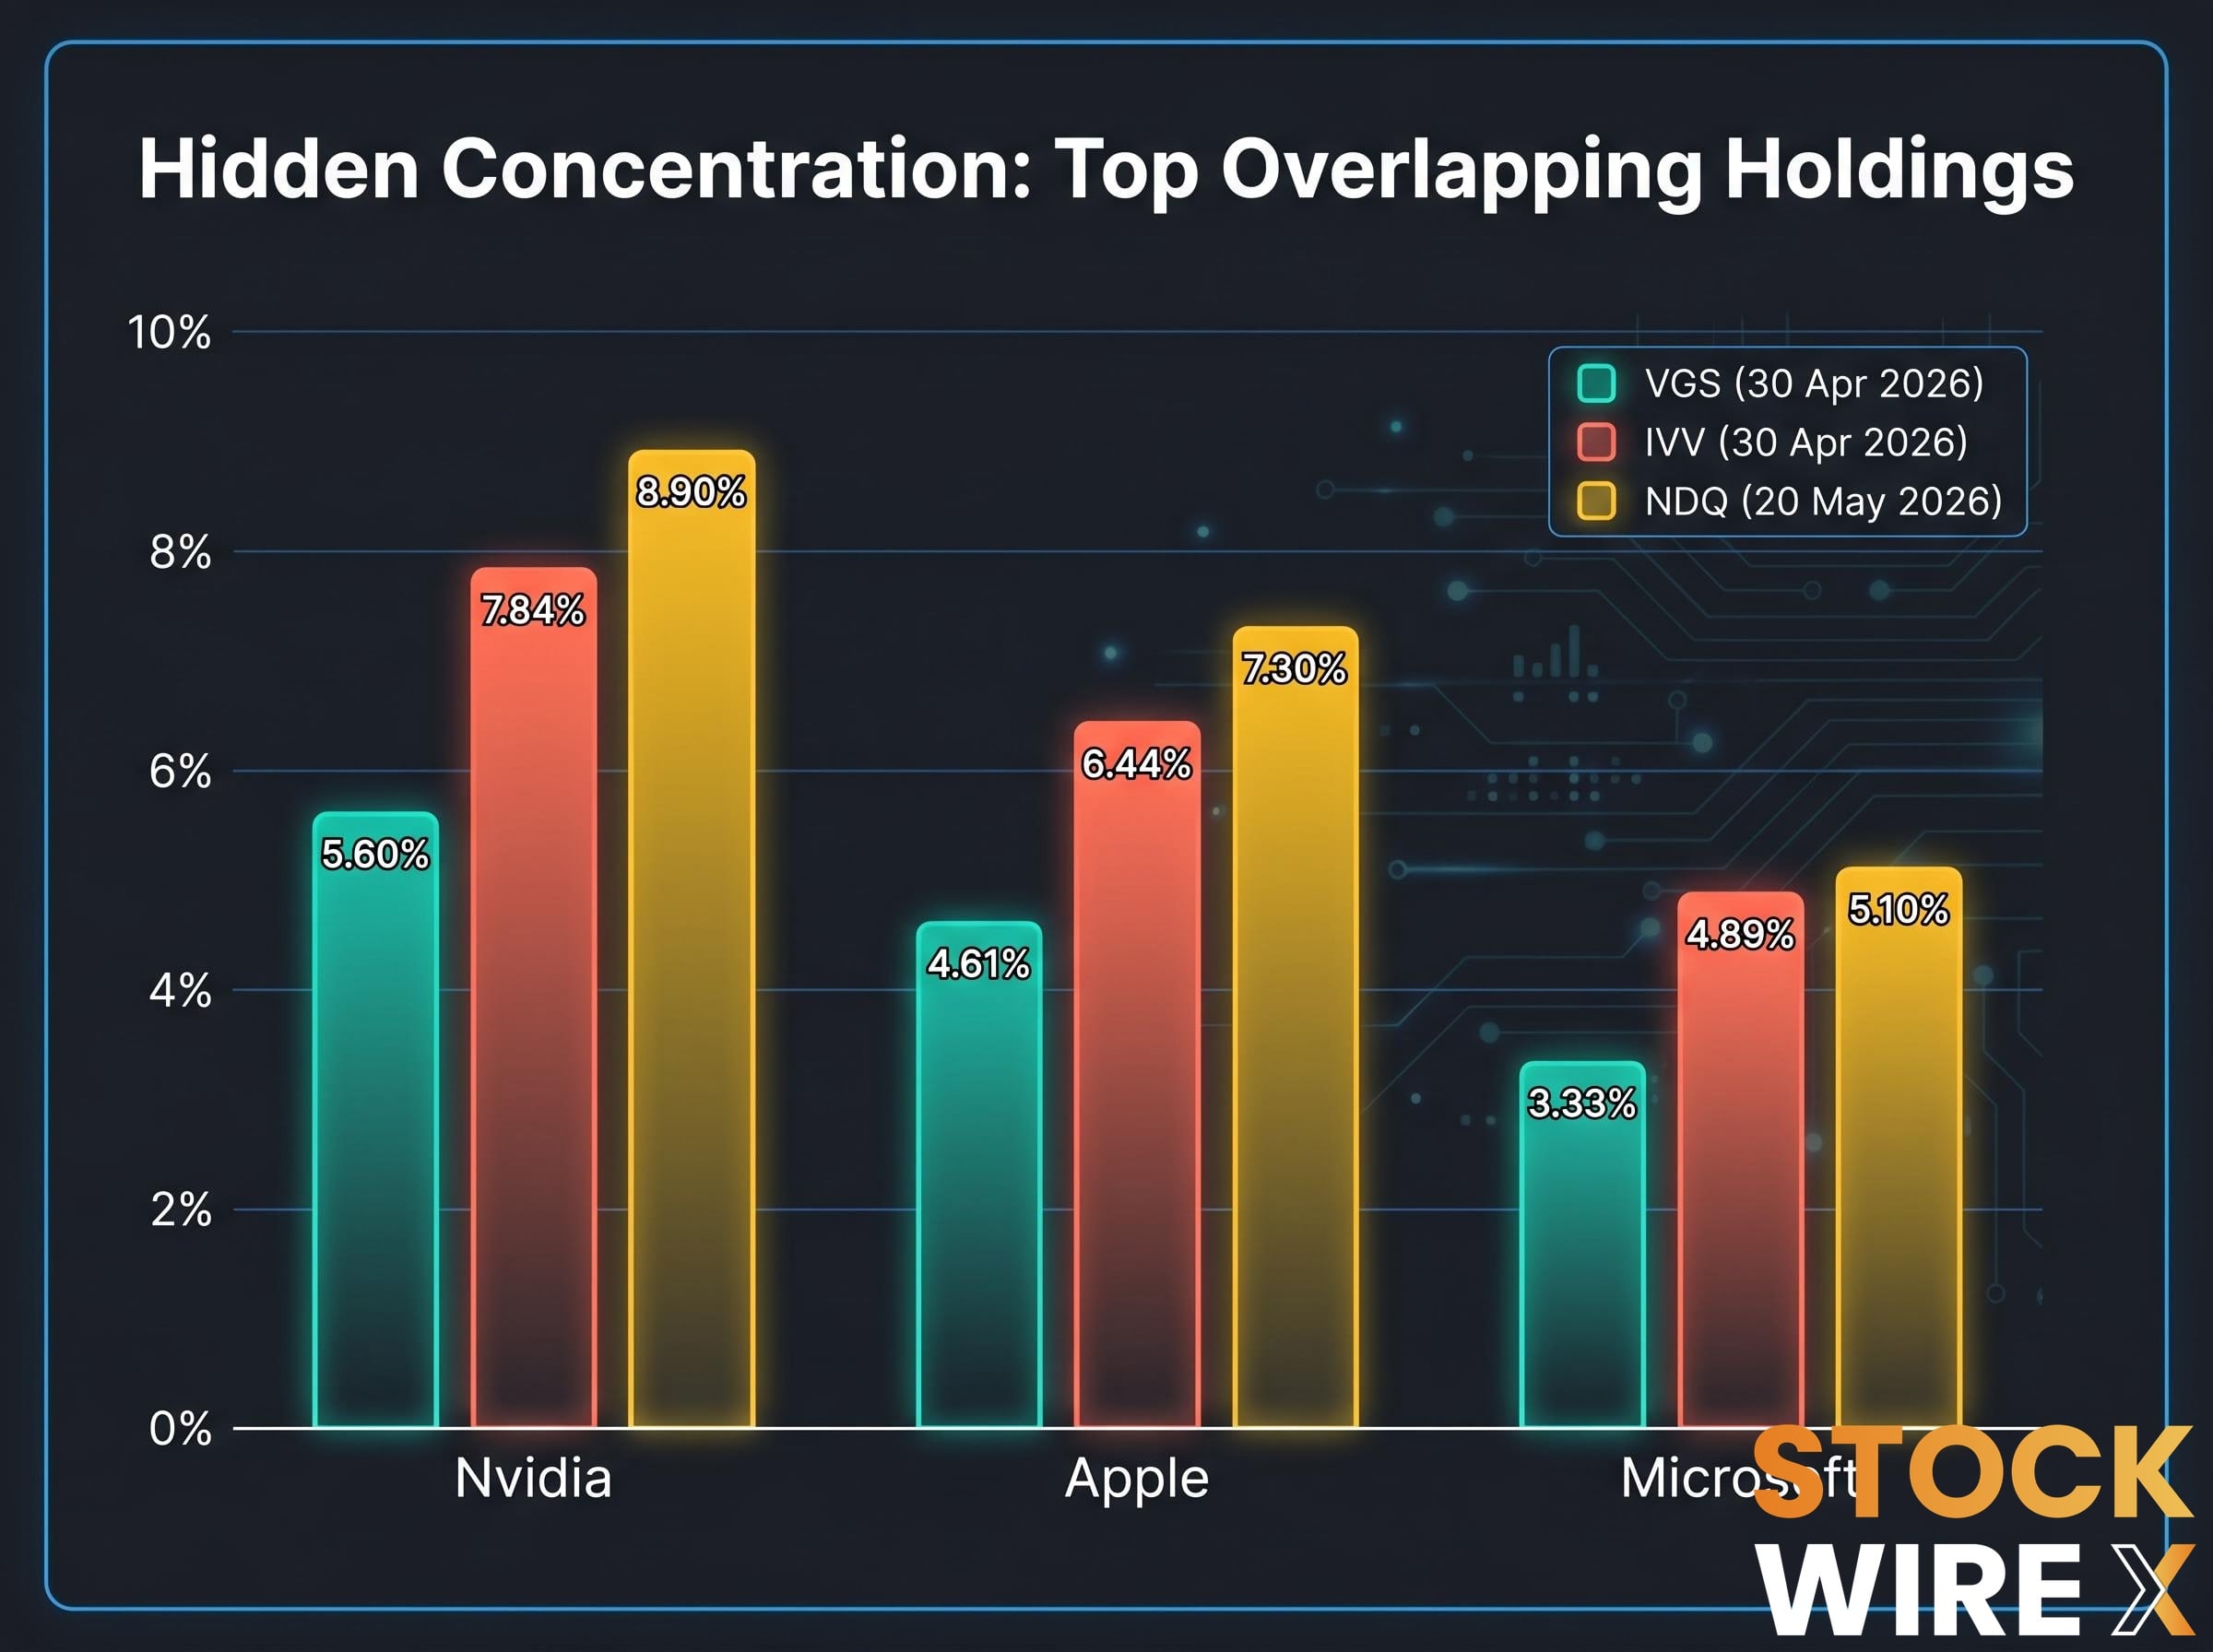
The holdings data from the most recent available factsheets makes the overlap concrete. The table below presents the approximate portfolio weight of the three largest overlapping positions across all three funds.
| Stock | VGS (30 Apr 2026) | IVV (30 Apr 2026) | NDQ (20 May 2026) |
|---|---|---|---|
| Nvidia | 5.60% | 7.84% | 8.90% |
| Apple | 4.61% | 6.44% | 7.30% |
| Microsoft | 3.33% | 4.89% | 5.10% |
Factsheet publication dates differ slightly across providers, and weights shift with daily market movements. The pattern, however, is structural and consistent rather than date-dependent. An investor holding equal portions of all three funds carries meaningful exposure to the same narrow group of stocks in every sleeve of their international equity allocation.
The overlap extends beyond these three names. The following companies are also confirmed constituents of all three underlying indices as of May 2026:
- Alphabet
- Amazon
- Meta
- Tesla
IVV’s top-10 holdings alone represent approximately 38.4% of the fund. NDQ’s concentration is even tighter. The numbers leave little ambiguity about whether overlap exists.
How to audit your own portfolio for hidden concentration
Identifying overlap does not require professional software or a paid subscription. Three approaches are available to Australian retail investors, starting with the simplest.
The manual spreadsheet method requires nothing beyond a browser and a spreadsheet application. The steps are sequential:
- Download the full holdings list (CSV format where available) from each ETF provider’s product page: Vanguard Australia for VGS, BlackRock/iShares Australia for IVV, and BetaShares for NDQ.
- Combine all three holdings lists into a single Excel or Google Sheets file.
- Apply a `SUMIF` formula on the company name or ticker column to aggregate the combined portfolio weight for each stock across all three funds.
- Sort the results by combined weight to reveal the top-10 holdings across the entire multi-ETF portfolio.
- Review the output for any single stock or sector carrying more weight than intended.
All three providers update their holdings data monthly or quarterly. Vanguard Australia, BlackRock/iShares Australia, and BetaShares publish full holdings lists on their respective product pages, downloadable as CSV or PDF files.
Platform and tool-based options for Australian investors
For investors who prefer an integrated approach, several platforms surface concentration data without manual spreadsheet work:
- Morningstar Portfolio X-Ray: Accessible via the Portfolio page for each ETF on the Morningstar platform. Surfaces stock-level, sector-level, and region-level concentration in a single view. Frequently recommended in Australian financial adviser commentary (2024-2025) as the primary tool for identifying overlap across funds.
- SelfWealth: Displays sector and regional breakdowns of the full portfolio including ETFs, allowing investors to see concentration in US equities and technology at the portfolio level.
- CommSec: Provides top holdings, sector, and country breakdown data for individual ETFs, which can be compared across products to infer overlap.
- Sharesight: Widely used by Australian investors for performance and diversification analysis by sector and geography, supporting overlap identification across holdings.
The goal with any of these tools is the same: identify the combined weight to any single stock or sector across all holdings, not just within a single ETF.
What to do if you find significant overlap in your portfolio
Overlap is not inherently a mistake. An investor who understands their concentration and accepts the associated risk has made an informed decision. The problem is unexamined overlap, where an investor believes they are diversified but is not.
For investors who identify significant concentration and want to act, three practical responses are available:
- Accept and document: Acknowledge the concentration, confirm it aligns with risk tolerance and investment goals, and revisit periodically as market conditions shift.
- Consolidate to fewer ETFs: Hold VGS alone rather than VGS plus IVV plus NDQ. A single broad global ETF already provides US mega-cap exposure; adding US and Nasdaq-specific funds layers more of the same.
- Add genuinely diversifying exposures: Consider ex-US international funds, small-cap ETFs, Australian equities, or equal-weight and factor-based alternatives to cap-weighted products.
According to Morningstar Australia analysis by Shani Jayamanne, investors concerned about concentration in cap-weighted indices may benefit from considering factor or equal-weight alternatives, which distribute portfolio weight more evenly across constituents rather than concentrating in the largest names.
For investors wanting to understand the structural mechanics before deciding whether to adjust their allocations, our full explainer on cap-weight versus equal-weight ETFs covers how weighting methodology determines real concentration at both the ASX and global level, including data on MVW’s historical performance relative to cap-weighted peers and the fee trade-offs involved.
Firstlinks commentary has noted that SMSF trustees and retirees relying on global ETFs face particular risk from a de-rating in US mega-cap technology, given their portfolio dependence on these funds and limited capacity to recover losses over shorter investment horizons.
The ATO guidance on SMSF investment strategy requires trustees to explicitly consider the composition and diversity of fund investments, noting that concentrating retirement savings in a single asset class creates concentration risk, a standard that applies directly when the bulk of a fund’s international equity allocation flows through overlapping cap-weighted ETFs.
One trade-off deserves acknowledgement. Reducing overlap may also reduce exposure to the performance tailwind that US mega-cap technology has provided in recent years. Passive ETFs have no internal mechanism for managing concentration drift; the index replicates whatever the market has already priced as most valuable. The decision to adjust sits with the investor, not the fund.
Overlap is invisible until you look, and looking takes one afternoon
The gap between what investors think they own and what they actually own is not a failure of judgement. It is a structural feature of how cap-weighted ETFs work. Three fund names, three providers, and three index acronyms create the appearance of diversification. The holdings data tells a different story: the same companies, carrying the same risks, repeated across every sleeve.
The audit is simple. The tools are free. The decision that follows belongs to the investor, made with full information rather than assumptions. An investor who understands their concentration can choose whether it matches their risk tolerance, their time horizon, and their goals. That is a meaningfully different position from discovering the concentration during a market event, when the ability to act calmly has already narrowed.
Benchmarking portfolio performance against a blended index that reflects actual asset class exposures is the logical follow-on step after an overlap audit; an investor who has identified their true concentration can then measure whether their returns reflect the risk they are actually carrying rather than the diversification they assumed.
This article is for informational purposes only and should not be considered financial advice. Investors should conduct their own research and consult with financial professionals before making investment decisions.