How 4.35% Is Splitting the ASX Into Winners and Losers
36 mins ago


Australia’s four largest ETFs hold more than $94 billion in investor capital, yet each carries a form of concentration risk that sits hidden behind names like “global shares” and “Australian shares index.” The Australian ETF industry recorded $330.6 billion in funds under management at the end of 2025, with record inflows of $53 billion during the year and forecasts pointing past $400 billion during 2026. Much of that growth has flowed into four products: Vanguard MSCI Index International Shares ETF (VGS), Vanguard Australian Shares Index ETF (VAS), iShares S&P 500 ETF (IVV), and BetaShares NASDAQ 100 ETF (NDQ). Many investors hold two, three, or all four as their core positions, assuming the word “index” or “international” signals genuine breadth. What follows is a detailed examination of where concentration is hiding inside each fund, why passive structures amplify rather than correct that concentration over time, and how investors can assess whether their combined portfolio carries more exposure than they realise.
Passive ETFs replicate an index. They buy what the index holds, in the weight the index assigns, and they do so without any active decision about whether that weight has become uncomfortably large. That mechanism is the product’s appeal: low cost, transparent, no manager risk. It is also the mechanism that locks in concentration drift.
As mega-cap technology firms have grown to dominate US and global benchmarks, passively managed products have automatically increased their weight in those names. No portfolio manager made a call to add more Apple or Nvidia. The index composition shifted, and the ETF followed. There is no corrective mechanism built into passive replication. The name on the tin and the breadth of the mandate do not tell an investor how concentrated the underlying exposure actually is.
The distinction between owning shares in a company and owning units in an index-replicating fund shapes what passive ownership means in practice: fund holders do not control position sizing, cannot exclude overvalued names, and absorb concentration automatically as market capitalisations shift.
ASIC Regulatory Guide 282 sets out the disclosure obligations ETF issuers must meet when distributing index-tracking products to retail investors in Australia, including requirements around how concentration risks and underlying index composition are communicated in product documentation.
Morningstar Australia’s Shani Jayamanne, Director, Investment Specialist, Wealth, published an analysis on 25 May 2026 examining this same theme across the four largest Australian ETFs by FUM. The timing is notable: Australian retail investors have never been more exposed to these products.
The four ETFs examined in this article are:
VGS promises developed-market international exposure across North America, Europe, and Asia. The MSCI World ex-Australia Index is a broad mandate. The reality underneath is less balanced. The United States constitutes approximately 70% of the portfolio’s total weight, with mega-cap technology names including Apple, Microsoft, and Nvidia among the largest individual holdings. An investor treating VGS as global diversification is making a concentrated wager on the US market, denominated in foreign currency.
That currency point compounds the geographic tilt. VGS operates without hedging, meaning Australian dollar movements directly affect local returns. A weaker AUD boosts the value of US-denominated holdings; a stronger AUD erodes it. The unhedged structure layers currency exposure on top of an already US-heavy composition.
VAS, by contrast, delivers domestic equity exposure via the ASX 300. The concentration sits not in geography but in sector composition. According to Vanguard’s fact sheet as at 31 March 2026, Financials represent 33.8% of the fund and Materials represent 25.2%, meaning two sectors account for approximately 59% of the total portfolio weight. The top 10 holdings represented 47% of the index as of mid-May 2026, with the two largest constituents alone exceeding 20%.
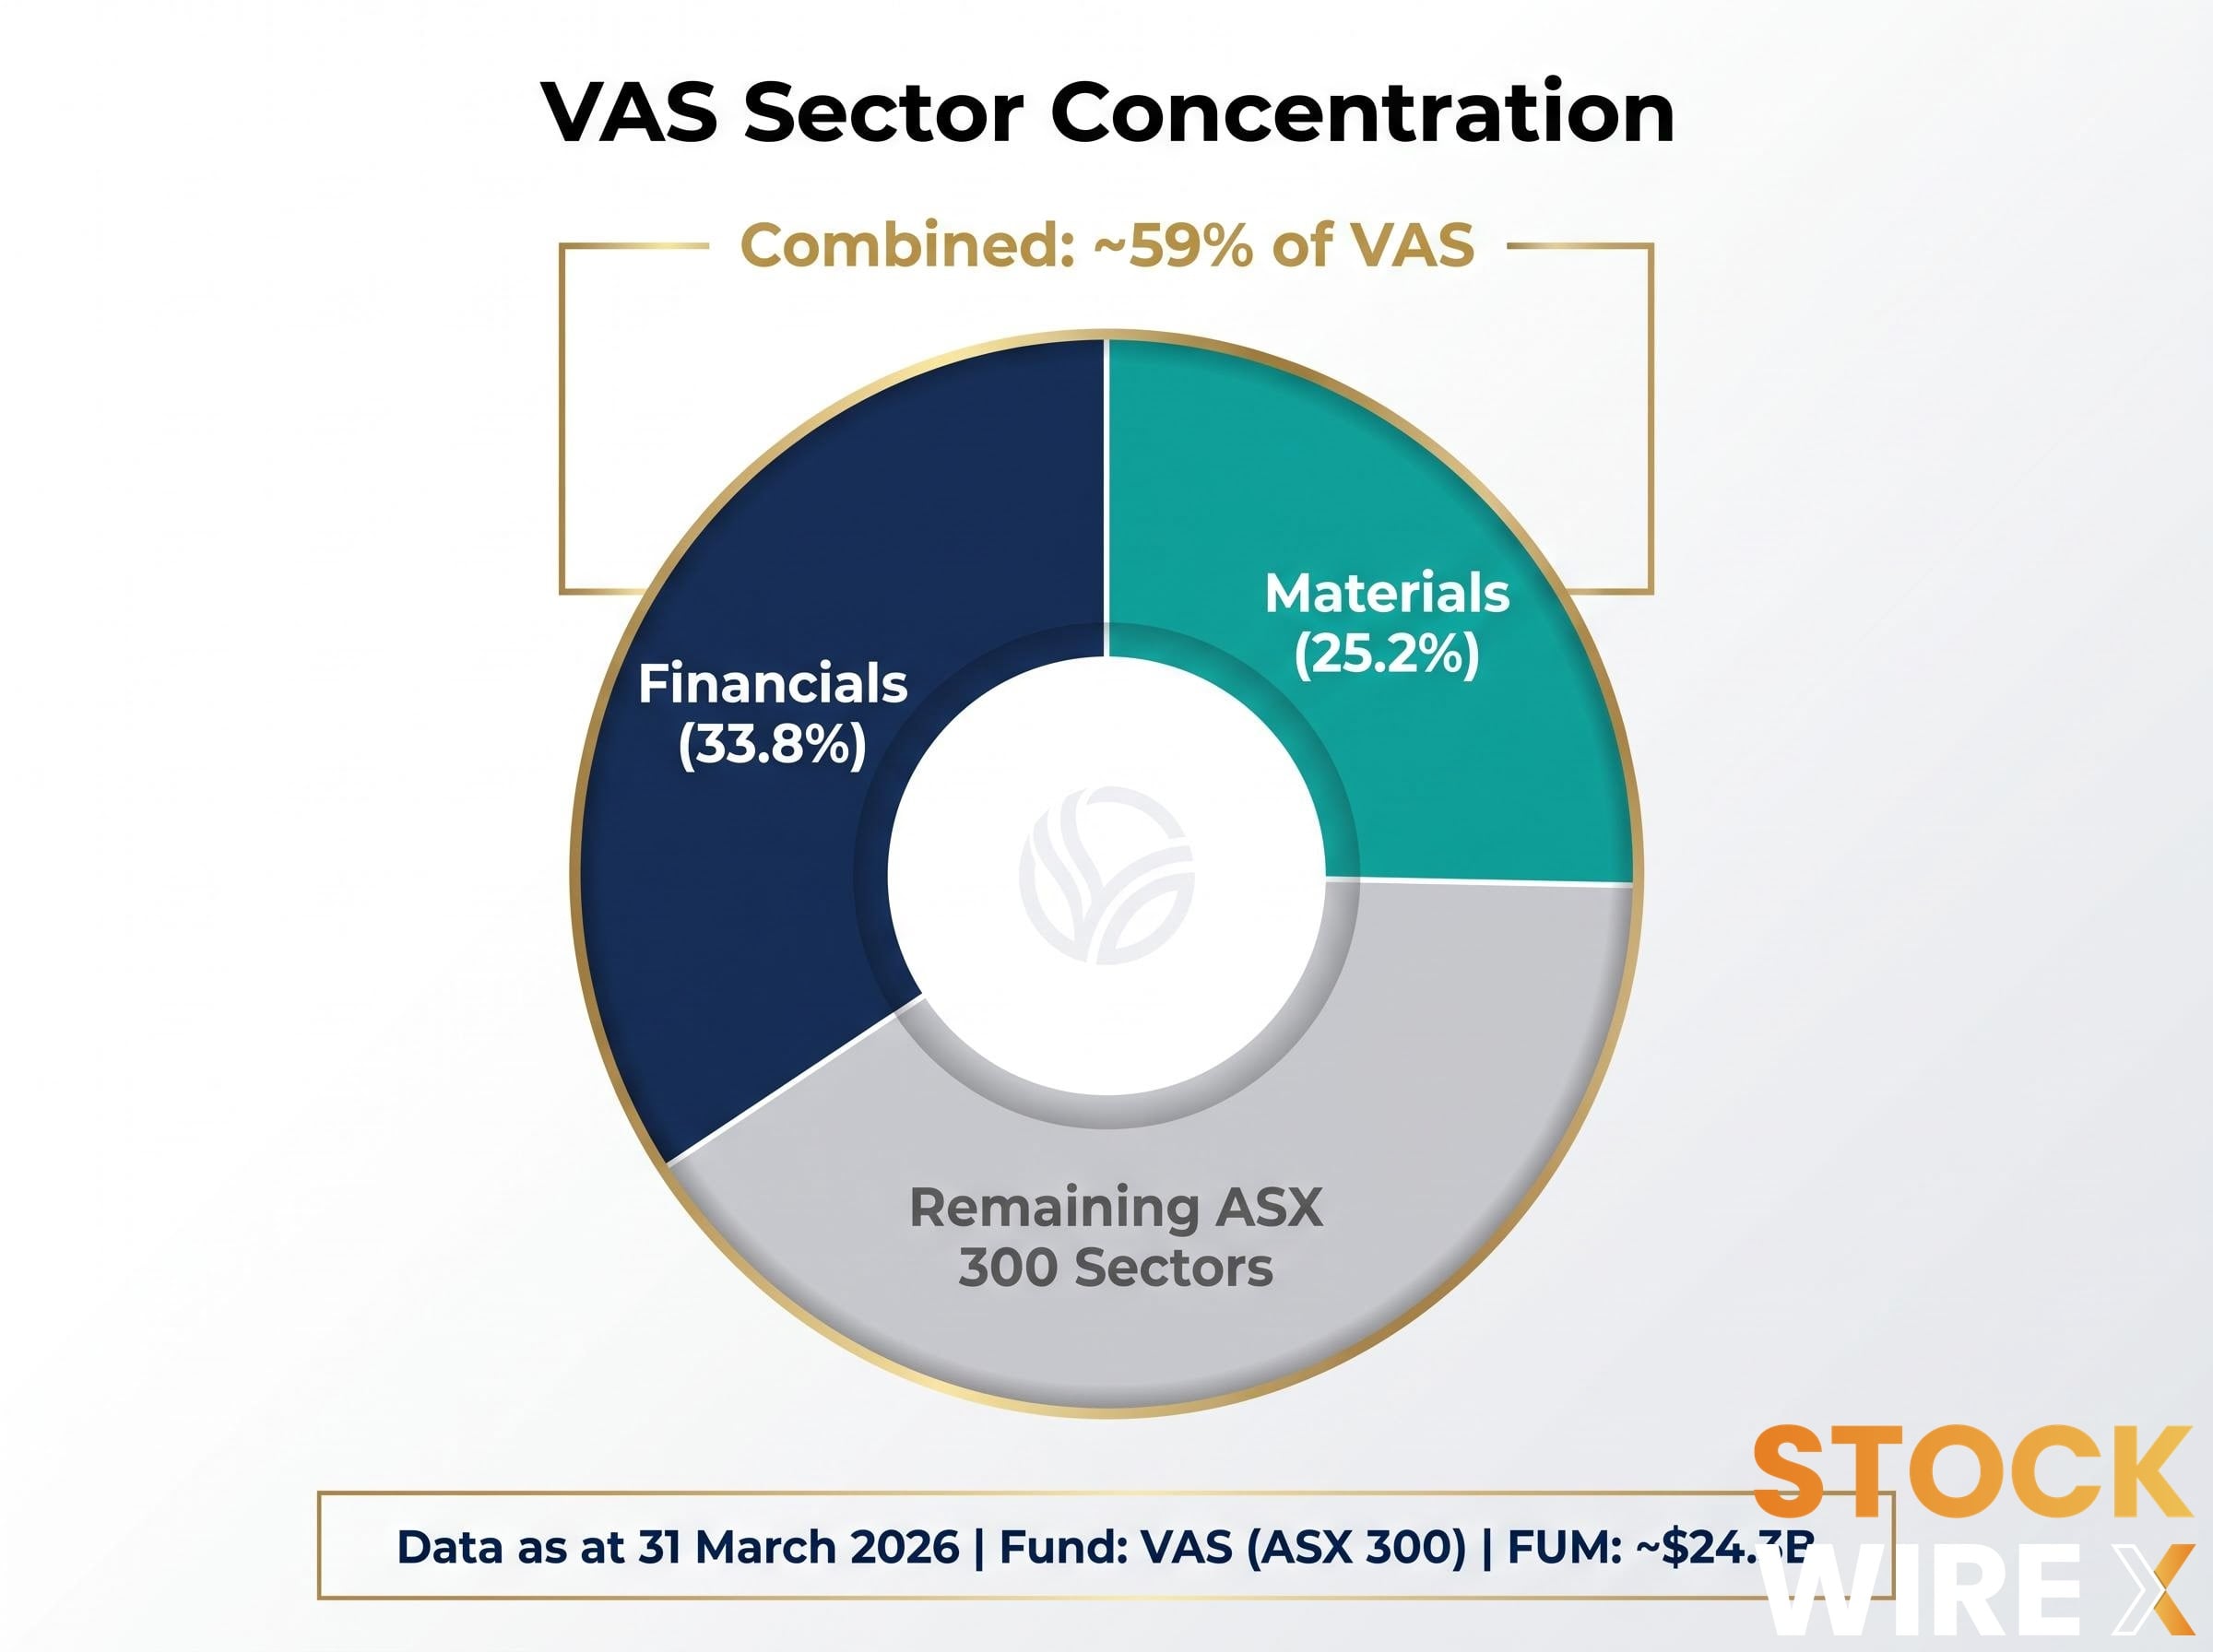
Financials and Materials together account for approximately 59% of VAS, tying the fund’s returns closely to Australian banks and commodity prices.
Note on VGS FUM: Morningstar’s May 2026 analysis reports VGS FUM at approximately $46.9 billion, while separate ASX data indicates approximately $16.22 billion. Investors should verify current figures directly with Vanguard Australia or ASX.
| ETF | Benchmark | FUM (May 2026) | Primary Tilt | Key Risk Factor |
|---|---|---|---|---|
| VGS | MSCI World ex-Australia | ~$46.9B | ~70% US weight; mega-cap tech | Unhedged AUD exposure compounds US tilt |
| VAS | ASX 300 | ~$24.3B | Financials 33.8% + Materials 25.2% | Returns tied to banks, housing, and commodities |
Investors holding both VGS and VAS believing they have achieved domestic plus international diversification have, in practice, built a portfolio dominated by US technology on one side and Australian banks and miners on the other.
IVV covers 500 companies. The number suggests breadth. The weight distribution tells a different story. As of 18 May 2026, the ten largest holdings represented 39% of the S&P 500 index. Two individual stocks carry outsized influence:
A single company, Nvidia, constitutes a larger share of the S&P 500 than the bottom 100 index constituents combined in many recent periods. The structural tailwinds that drove this concentration, particularly the expansion of cloud computing and artificial intelligence, contributed to strong earnings growth among the dominant technology cohort. The same concentration that delivered those gains creates asymmetric downside risk if that cohort reprices. A sector rotation or valuation compression in mega-cap technology would hit IVV holders far harder than the 500-stock label implies.
Mega-cap concentration in US indexes had reached historical extremes by mid-2026, with five stocks controlling approximately 23% of the broad market and driving the majority of both quarterly losses and recoveries, a dynamic that amplifies the asymmetric downside risk the article above describes for IVV holders.
NDQ tracks the NASDAQ 100, which comprises the 100 largest non-financial businesses listed on the NASDAQ exchange. The exclusion of financial companies is a design feature that further concentrates the fund into technology and communication services. Names like Apple, Microsoft, and Amazon feature prominently.
Growth-oriented companies are more sensitive to interest rate movements and valuation changes than their value-oriented counterparts. NDQ delivered strong returns during periods of economic expansion and declining rates, but the same composition creates volatility asymmetry. When valuation pressures emerge, the fund’s narrow, growth-heavy universe tends to reprice more sharply than broader market products.
Australian investors often hold IVV and NDQ together, treating them as complementary US market positions. The underlying compositions overlap significantly, meaning the combined position is not twice the exposure but a doubled bet on the same cluster of mega-cap technology names.
The concentration within each individual ETF is only half the picture. The compounding effect across a multi-ETF portfolio is where the risk becomes most consequential and least visible.
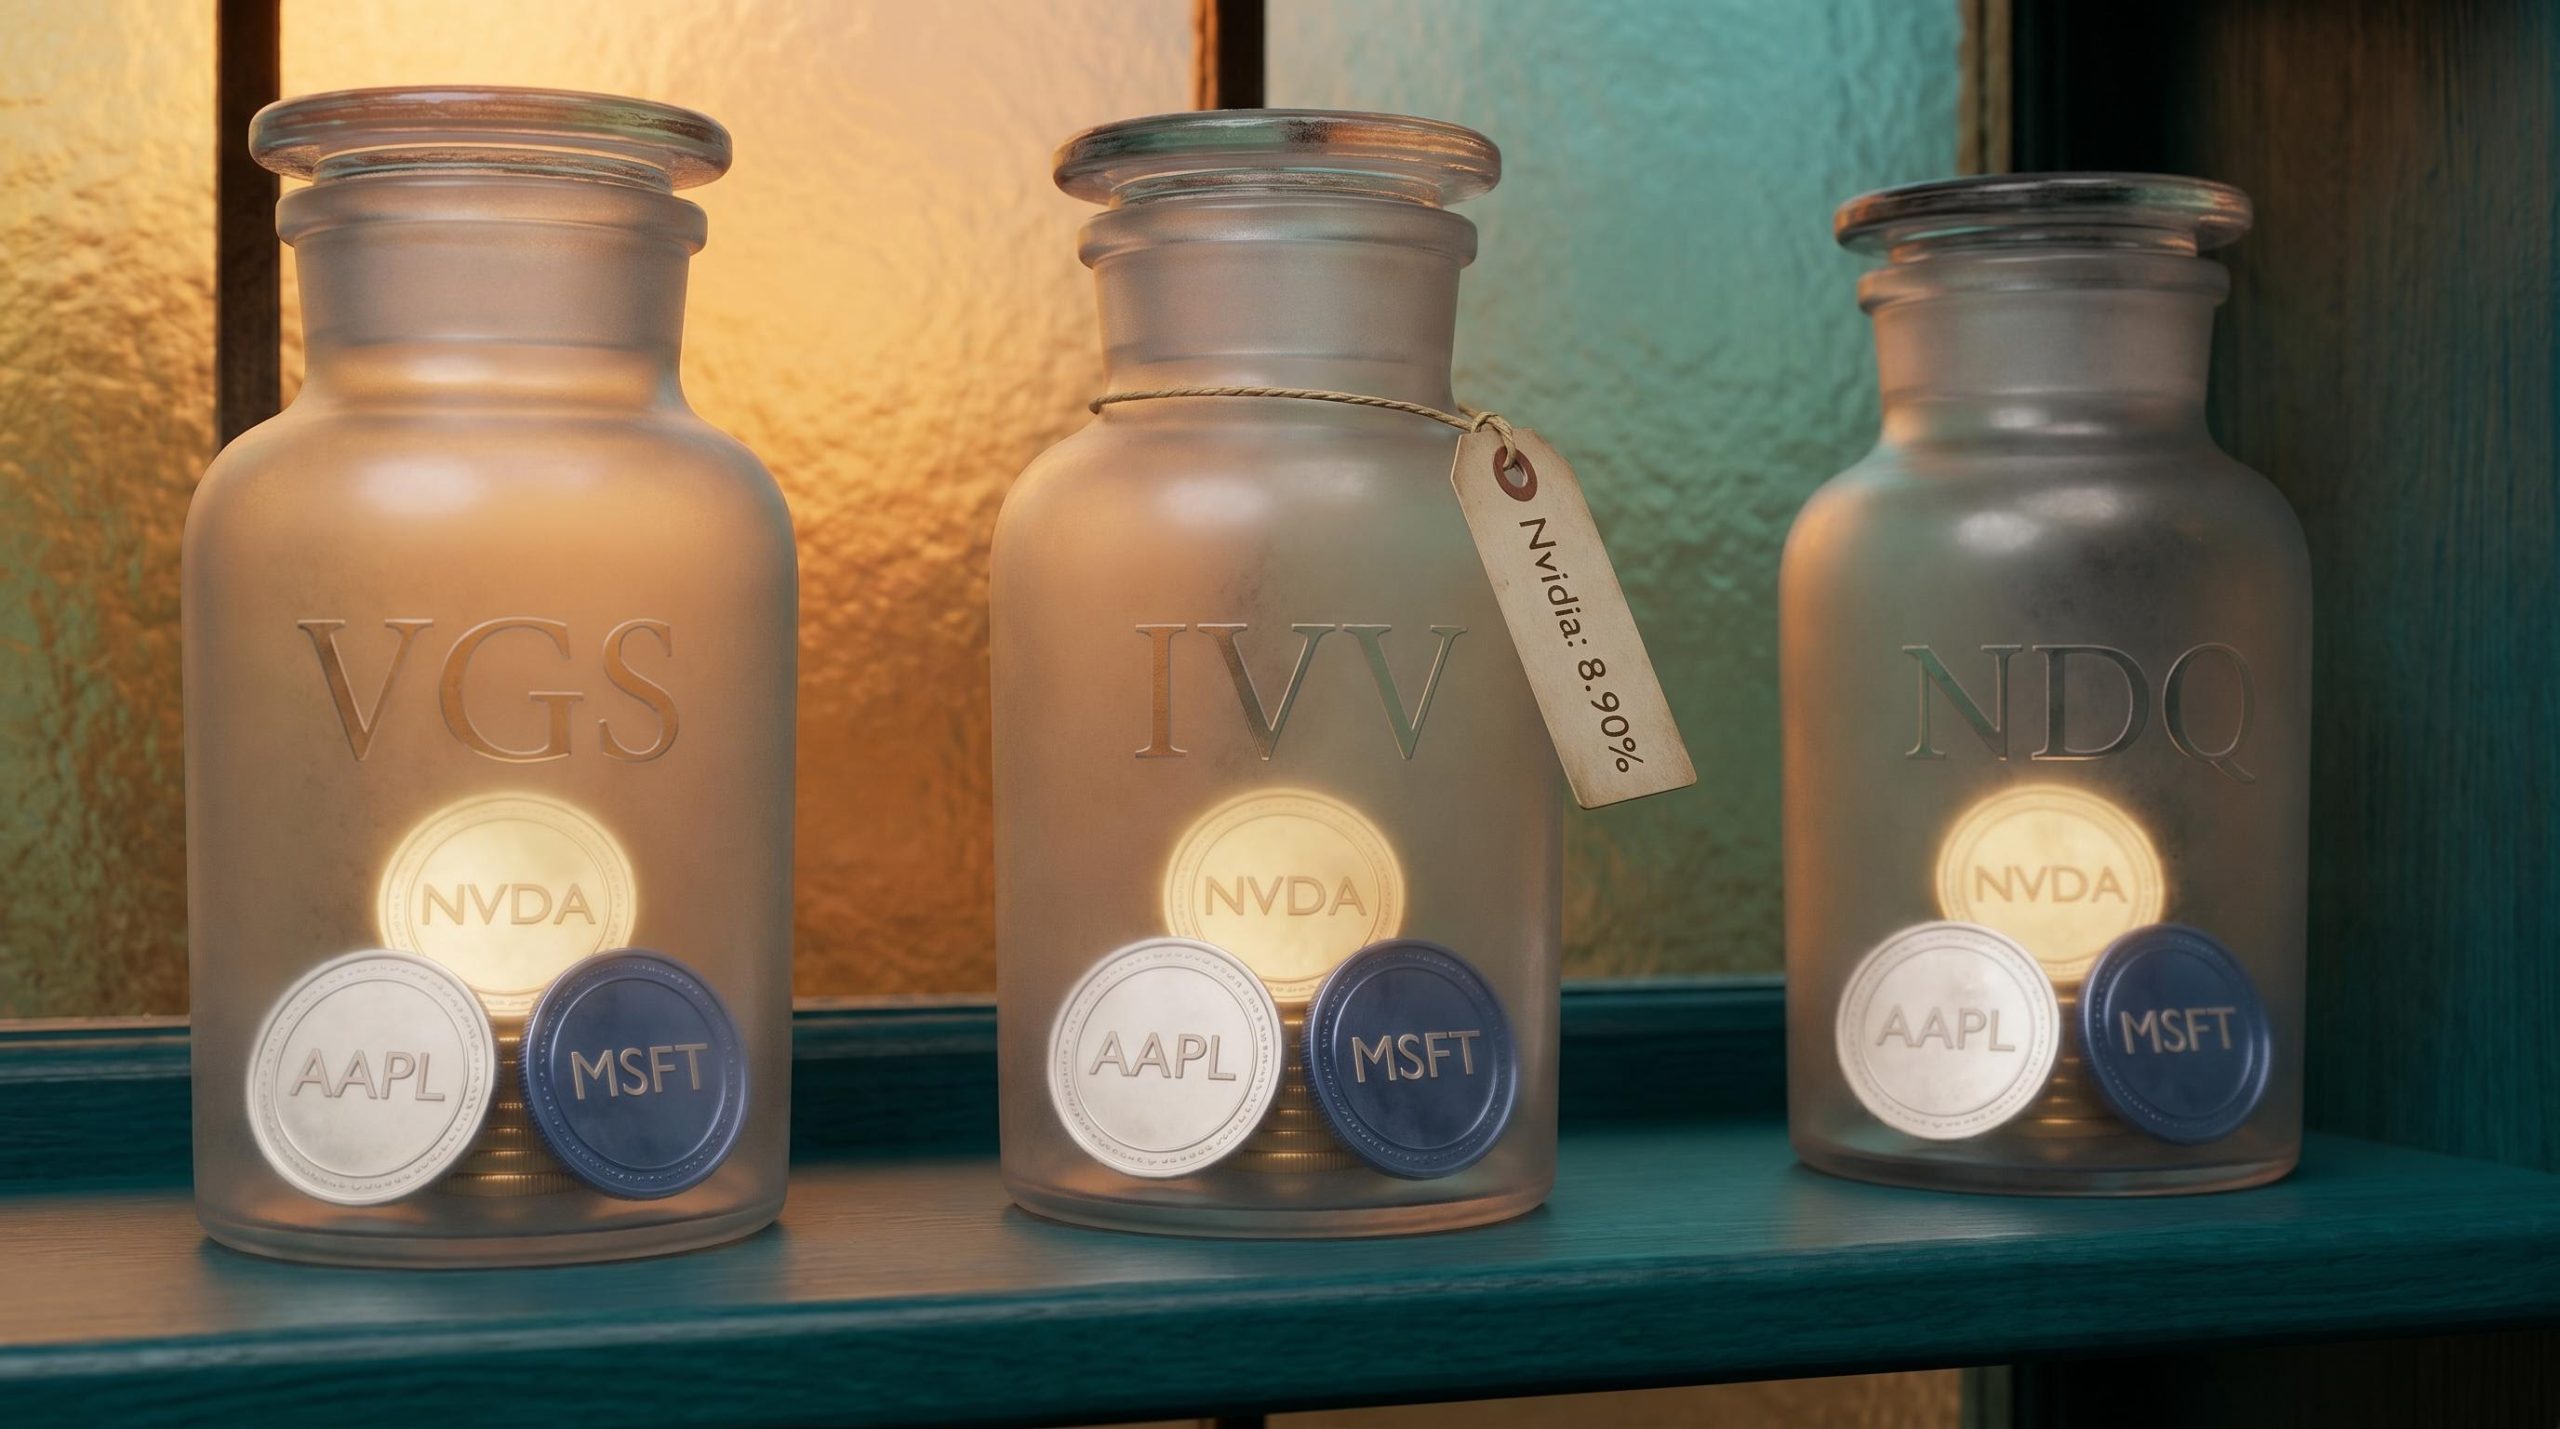
Apple, Microsoft, and Nvidia appear as significant holdings in VGS, IVV, and NDQ simultaneously. An investor holding all three products is not diversifying across three different pools of companies. They are tripling their exposure to the same narrow cohort of US mega-cap technology stocks. That overlap is invisible at the fund-label level. VGS says “international shares.” IVV says “S&P 500.” NDQ says “NASDAQ 100.” The labels suggest three distinct mandates. The underlying securities overlap substantially.
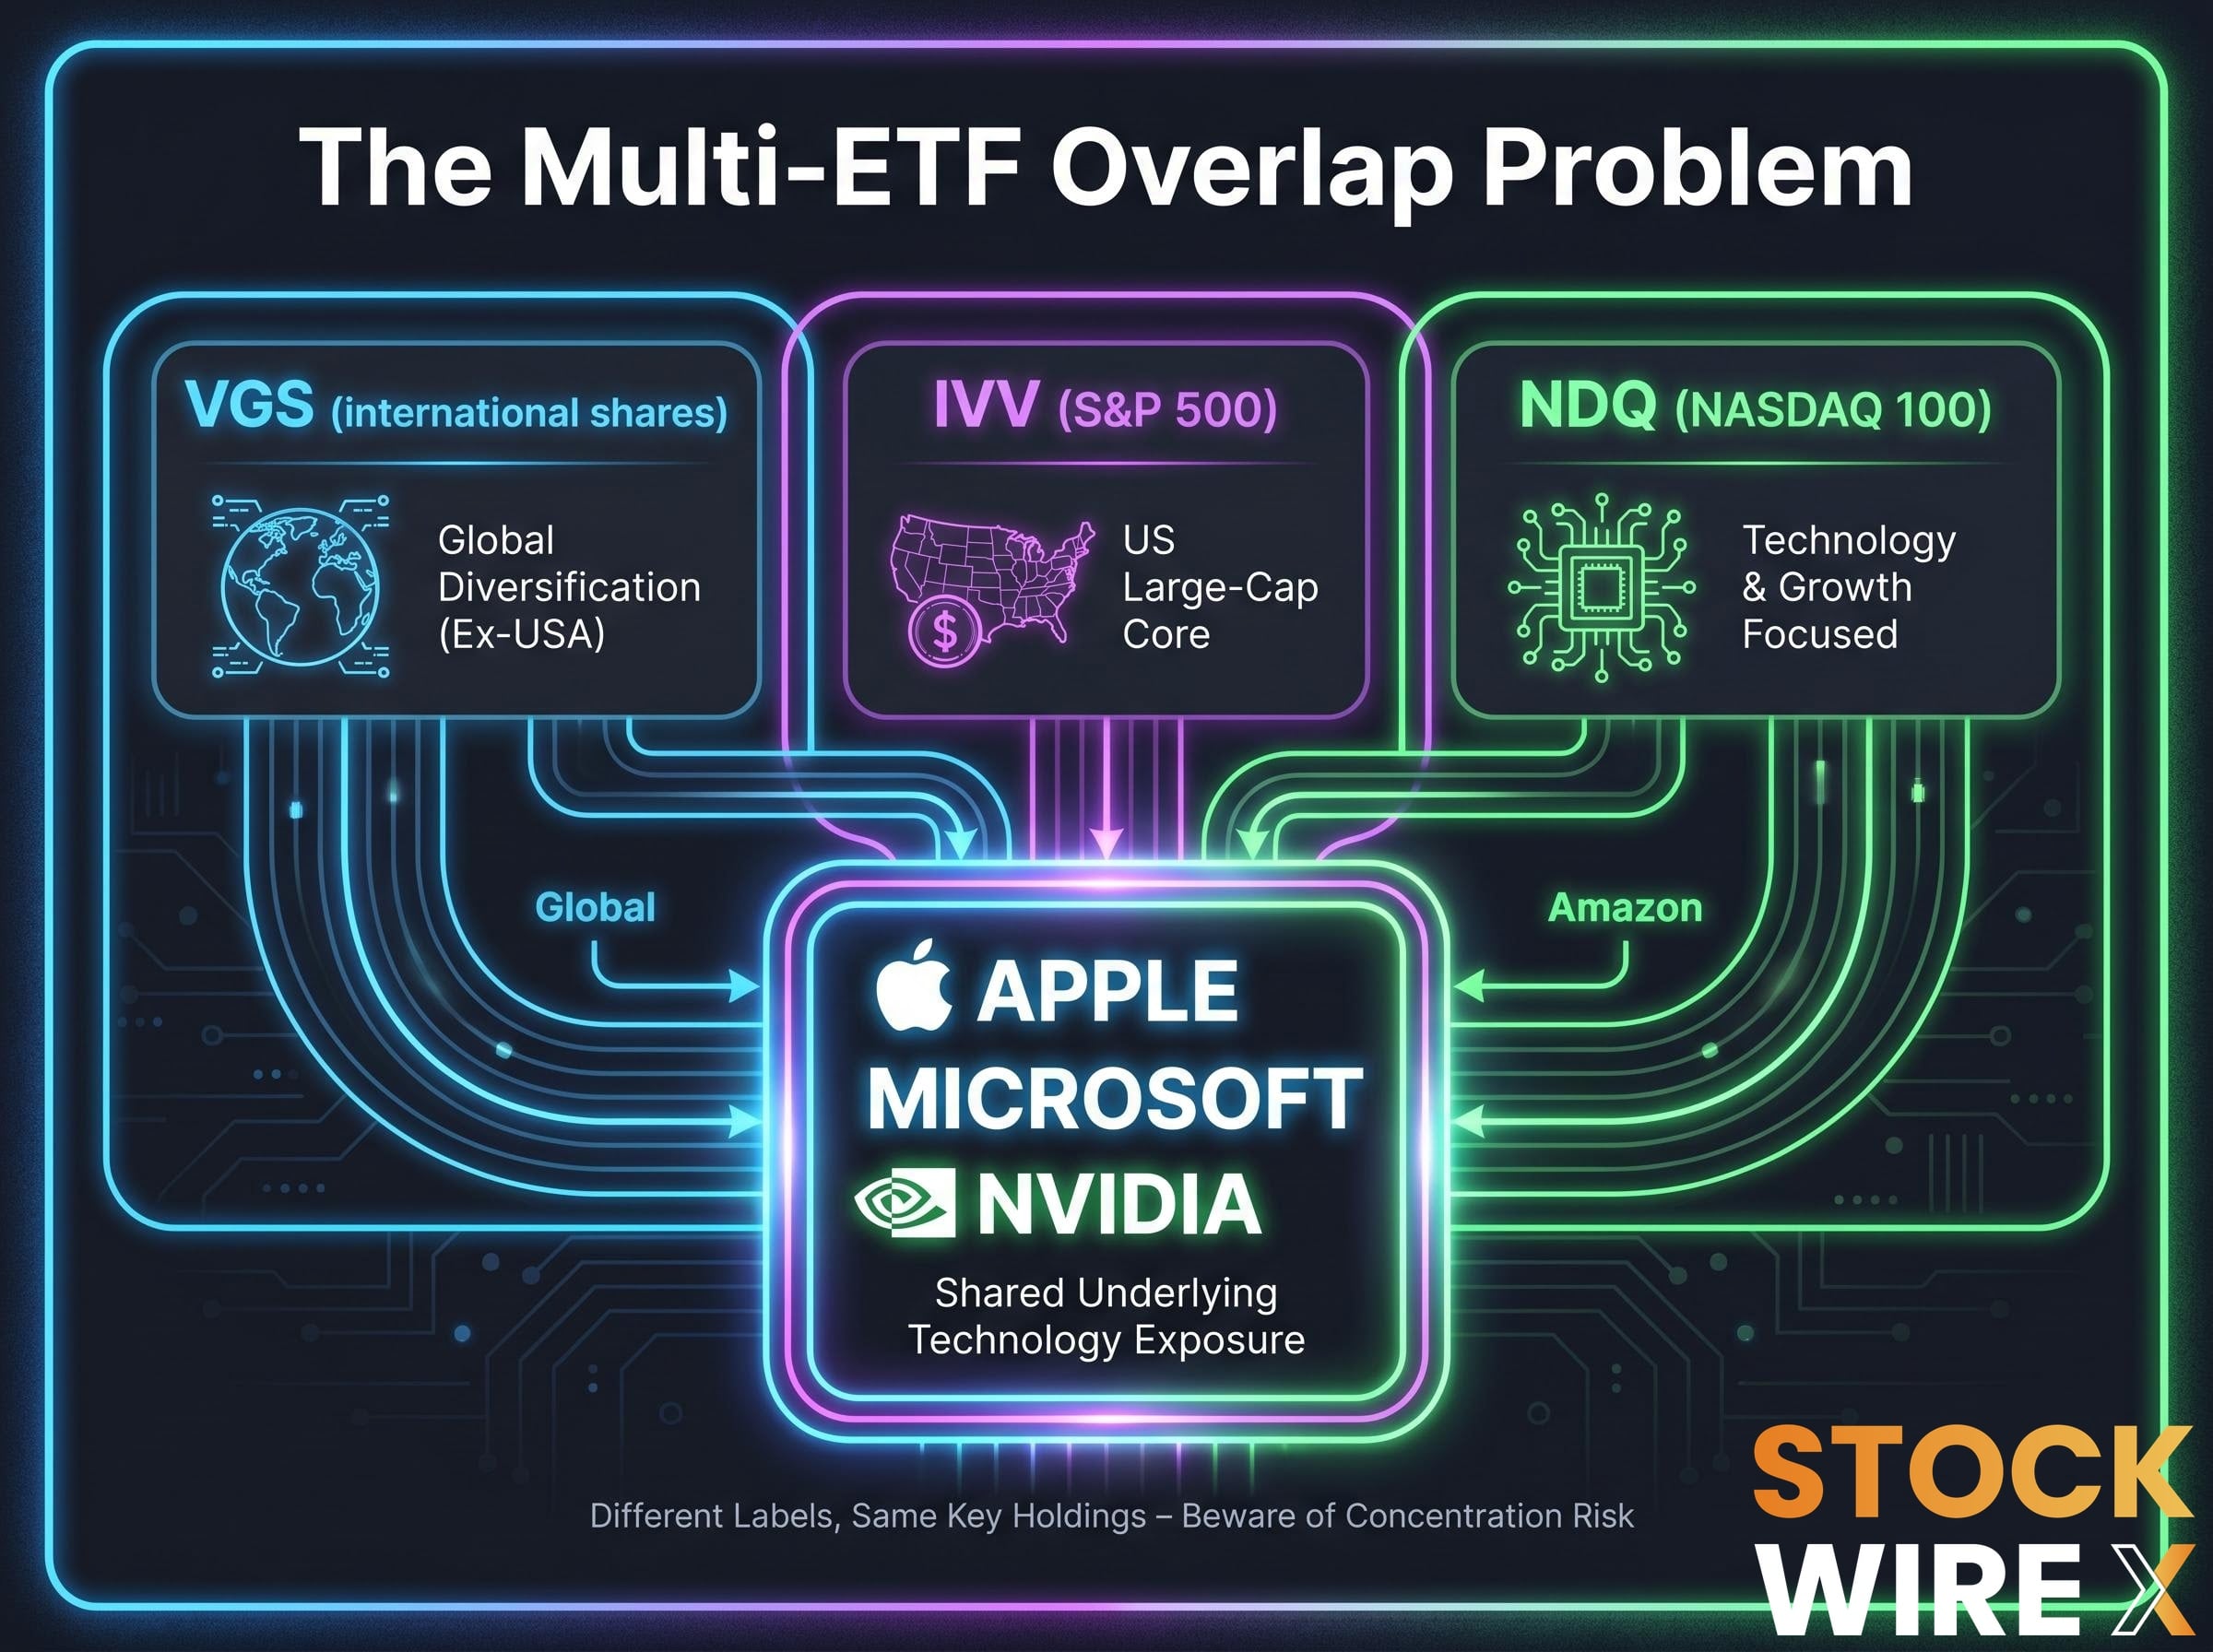
Apple, Microsoft, and Nvidia appear as significant holdings across VGS, IVV, and NDQ simultaneously, meaning investors holding all three are compounding rather than diversifying their exposure to US mega-cap technology.
Adding VAS does not offset that technology exposure so much as layer a different concentration alongside it. The resulting four-ETF portfolio, one that more than $94 billion in Australian investor capital is deployed across, can function in aggregate as a concentrated position in US mega-cap technology plus Australian banks and miners.
Valuation spreads between US technology and international markets have widened to multi-decade extremes, with MSCI EAFE trading at roughly a 50-55% forward P/E discount to the S&P 500 IT sector as of Q1-Q2 2026, a gap that historical concentration episodes suggest tends to compress over the subsequent decade.
| ETF | Benchmark | US Tech Exposure | Overlapping Major Holdings |
|---|---|---|---|
| VGS | MSCI World ex-Australia | High (~70% US; mega-cap tech dominant) | Apple, Microsoft, Nvidia |
| VAS | ASX 300 | Minimal (domestic focus) | Limited overlap with other three |
| IVV | S&P 500 | High (top 10 = 39% of index) | Apple, Microsoft, Nvidia |
| NDQ | NASDAQ 100 | Very high (tech and comms dominant) | Apple, Microsoft, Nvidia, Amazon |
Morningstar’s Portfolio X-Ray tool offers one mechanism for surfacing this overlap, aggregating underlying securities across multiple holdings to reveal the true sector and geographic exposures of a combined portfolio.
Passive ETFs are designed to track markets, not to manage investor-level concentration. That responsibility falls entirely on the holder. The following questions provide a starting framework for assessing whether a multi-ETF portfolio carries more concentration than intended.
According to Morningstar, the Portfolio X-Ray tool (accessible via the Portfolio page on the Morningstar platform) allows investors to input their holdings and receive an aggregated view of underlying securities, sector allocations, and geographic exposures across the entire portfolio. The tool can reveal when the same company appears across multiple ETFs, quantifying the overlap that fund-level labels obscure.
For investors holding combinations of VGS, IVV, NDQ, and VAS, the X-Ray output can surface precisely how much of the total portfolio is allocated to US mega-cap technology or Australian financials, providing the data needed to determine whether the aggregate exposure is deliberate.
VGS, VAS, IVV, and NDQ remain effective long-term portfolio building blocks. Their low costs, transparency, and structural simplicity are genuine advantages. VAS’s sector composition, weighted toward financials, reflects the design of the Australian equity market and suits income-oriented investors who benefit from dividend income and franking credits. The issue is not that these products are flawed. The issue is that many investors hold them without examining the aggregate effect.
Record $53 billion in inflows to Australian ETFs during 2025 signals that these products have become the default investment vehicle for a growing share of the retail market. Combined FUM across the four largest ETFs exceeds $94 billion. Whether that concentration of investor capital is accompanied by a clear understanding of the underlying risks is what separates informed portfolio construction from passive assumption.
For investors who have identified unintentional concentration in their current holdings and want to explore structural alternatives, our full explainer on equal-weight ETFs examines how products like MVW assign identical allocations to every constituent and rebalance quarterly, reducing the automatic concentration drift that cap-weighted indexes embed, along with the performance trade-offs that structure carries.
The distinction that matters is between unexamined concentration, which is a risk, and deliberate, understood concentration, which is a valid investment thesis.
This article is for informational purposes only and should not be considered financial advice. Investors should conduct their own research and consult with financial professionals before making investment decisions. Past performance does not guarantee future results.
ETF concentration risk refers to the outsized exposure a fund carries to a small number of stocks, sectors, or geographies, even when its name implies broad diversification. For Australian investors in products like VGS and IVV, this means a large portion of their portfolio can be tied to a narrow cluster of US mega-cap technology companies without them realising it.
Approximately 70% of VGS (Vanguard MSCI Index International Shares ETF) is weighted toward the United States, with mega-cap technology names including Apple, Microsoft, and Nvidia among its largest holdings, meaning investors seeking global diversification are primarily taking on US equity exposure.
Financials and Materials together account for approximately 59% of VAS, with Financials at 33.8% and Materials at 25.2% as of 31 March 2026, tying the fund's returns closely to Australian banks, housing, and commodity prices.
Morningstar's Portfolio X-Ray tool allows investors to input multiple ETF holdings and receive an aggregated view of underlying securities, sector allocations, and geographic exposures, revealing when the same company such as Apple, Microsoft, or Nvidia appears across several funds simultaneously.
IVV and NDQ share significant underlying holdings including Apple, Microsoft, and Nvidia, meaning investors holding both products are not gaining additional diversification but are instead doubling their exposure to the same cluster of US mega-cap technology stocks.