SpaceX IPO: Verified Assets vs. a $2 Trillion AI Bet
5 mins ago


A $10,000 investment in the iShares S&P 500 ETF (ASX: IVV) made in April 2021 has grown to roughly $19,200 by April 2026, a 90% unit price gain that outpaced most managed funds at a fraction of the cost. With the five-year performance window now firmly closed, Australian retail investors have a meaningful data set to evaluate IVV on its own terms: annualised returns, currency drag, affordability shifts, and concentration exposure. The fund holds more than AUD 13.5 billion in net assets and trades on the ASX as one of the most widely held low-cost US equity vehicles available to self-directed investors.
This analysis unpacks what drove IVV’s five-year result, what the AUD/USD rate meant for Australian-dollar returns, how unit price appreciation has changed entry-point economics, and what considerations should shape any decision to invest today.
Between April 2021 and April 2026, IVV delivered an annualised total return of approximately 14.5% per year. That figure sounds strong in isolation. Applied over five compounding years, it produced an outcome that illustrates why compounding is the most powerful force in long-term investing.
A $10,000 starting position did not simply add 14.5% each year in a straight line. Each year’s gains became the base for the next year’s growth. The cumulative result: more than 90% unit price appreciation over the full period, turning that initial $10,000 into approximately $19,200.
Compounding mechanics across decade-length horizons explain why the second decade of a held position generates nearly double the dollar gains of the first on the same initial capital, a structural advantage that makes IVV’s 14.5% annualised return meaningful not just as a historical result but as a baseline for projecting what uninterrupted time in the fund could produce.
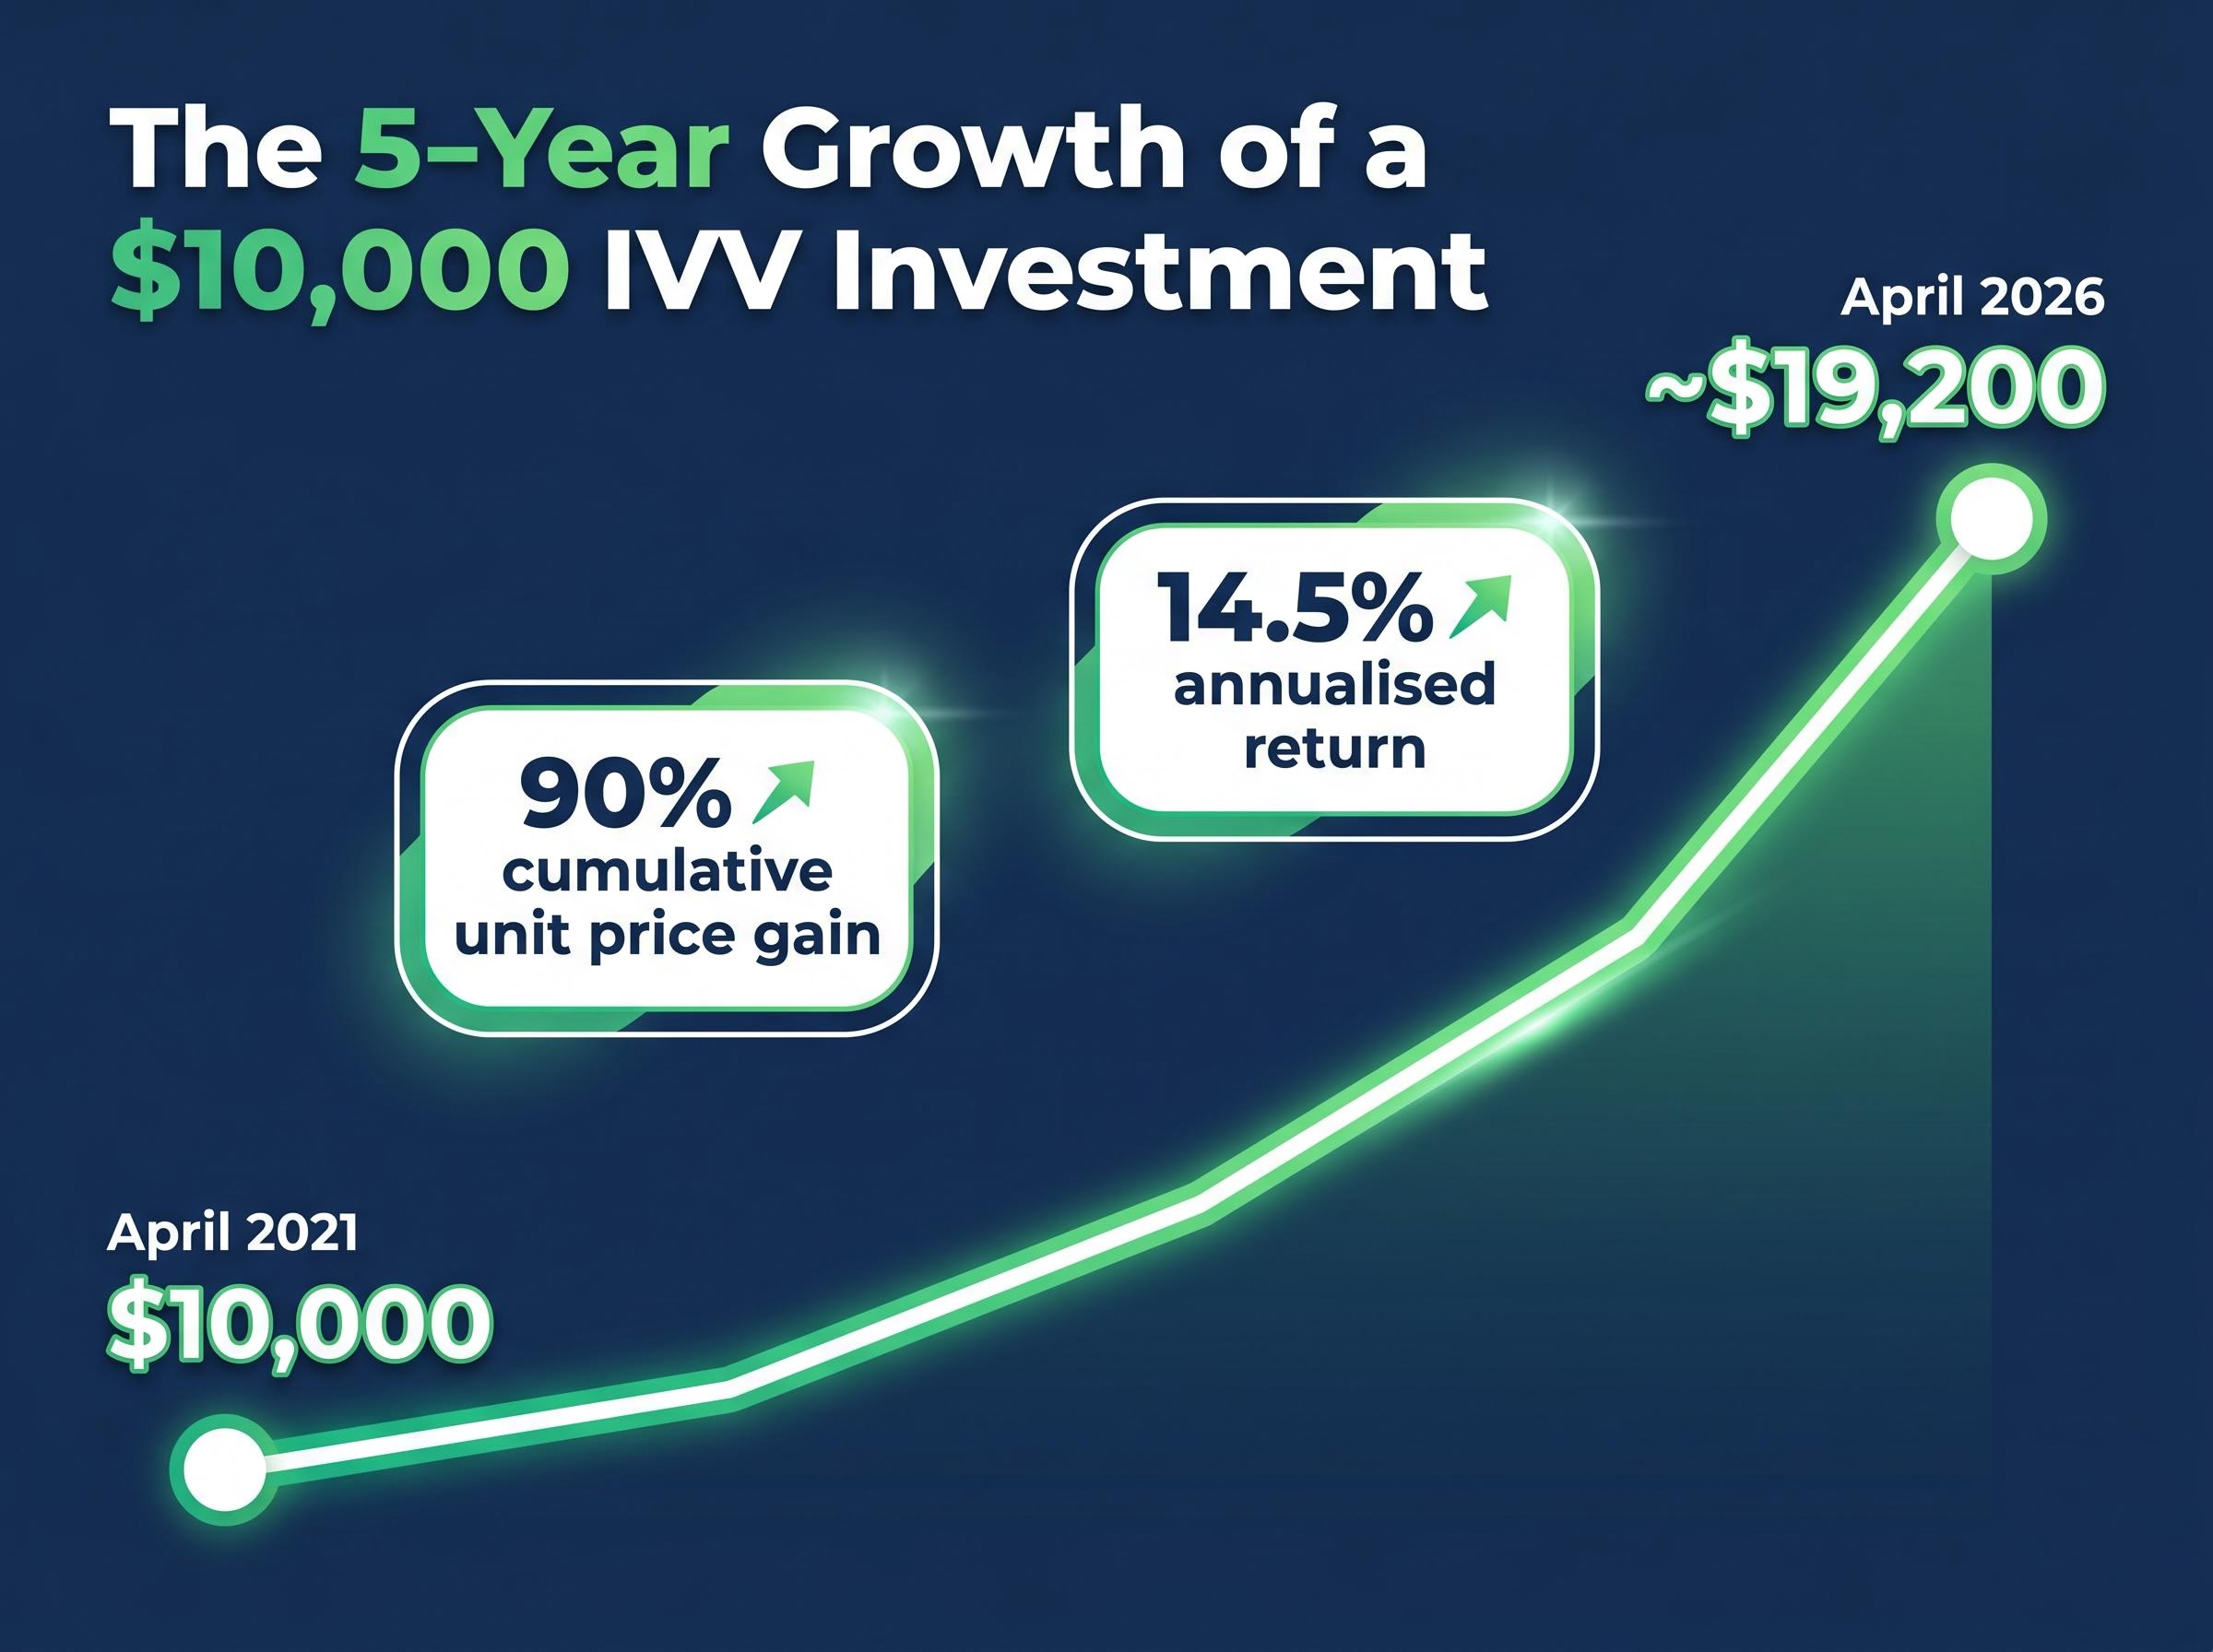
$10,000 invested in IVV in April 2021 grew to approximately $19,200 by April 2026, reflecting annualised returns of roughly 14.5% per year.
Strong US equity gains can be partially absorbed by currency movements. Australian investors holding an unhedged ETF like IVV are always carrying two positions simultaneously: one in the S&P 500, and one in the AUD/USD exchange rate. The fund does not include built-in currency protection, so every movement in the Australian dollar relative to the US dollar flows directly through to the AUD value of each unit.
The mechanics are straightforward. When the AUD rises against the USD, each US dollar of underlying equity value converts back into fewer Australian dollars. When the AUD falls, the opposite applies, and returns are amplified.
| AUD/USD Movement | Impact on IVV’s AUD Return |
|---|---|
| AUD rises against USD | Return compressed (fewer AUD per USD) |
| AUD falls against USD | Return amplified (more AUD per USD) |
Over the 12 months prior to April 2026, the AUD appreciated approximately 10% against the USD. That appreciation directly dampened the AUD-denominated return that Australian IVV holders received during that window. As of late May 2026, RBA data placed the AUD/USD rate at approximately 0.716, with the pair trading in the 0.71 to 0.72 range.
The current AUD/USD pressure points shaping that conversion rate include US inflation at a three-year high of 3.8%, WTI crude near US$102 per barrel, and the outcome of the May 2026 Trump-Xi summit, each of which has contributed to keeping the pair below the 0.7280 resistance level that would need to break for sustained AUD recovery.
RBA exchange rate data for the AUD/USD placed the pair at approximately 0.716 as of late May 2026, providing Australian investors with the reference point needed to assess the current currency position they are taking alongside any unhedged US equity exposure.
This does not negate IVV’s five-year result. It does, however, illustrate that AUD/USD is a live variable that Australian investors in unhedged US equity ETFs should monitor alongside the performance of the underlying index.
IVV tracks the S&P 500 using market-capitalisation weighting. That structure means the fund’s performance is not evenly driven by 500 companies. It is disproportionately shaped by the largest.
As of 2026, the top 10 companies in the S&P 500 accounted for approximately 39 to 41% of total index weight, according to data from S&P Dow Jones Indices and Slickcharts. The names driving that concentration include:
The top 10 holdings represent roughly 40% of the entire S&P 500 index weight, meaning IVV’s returns are heavily influenced by a small cluster of mega-cap companies.
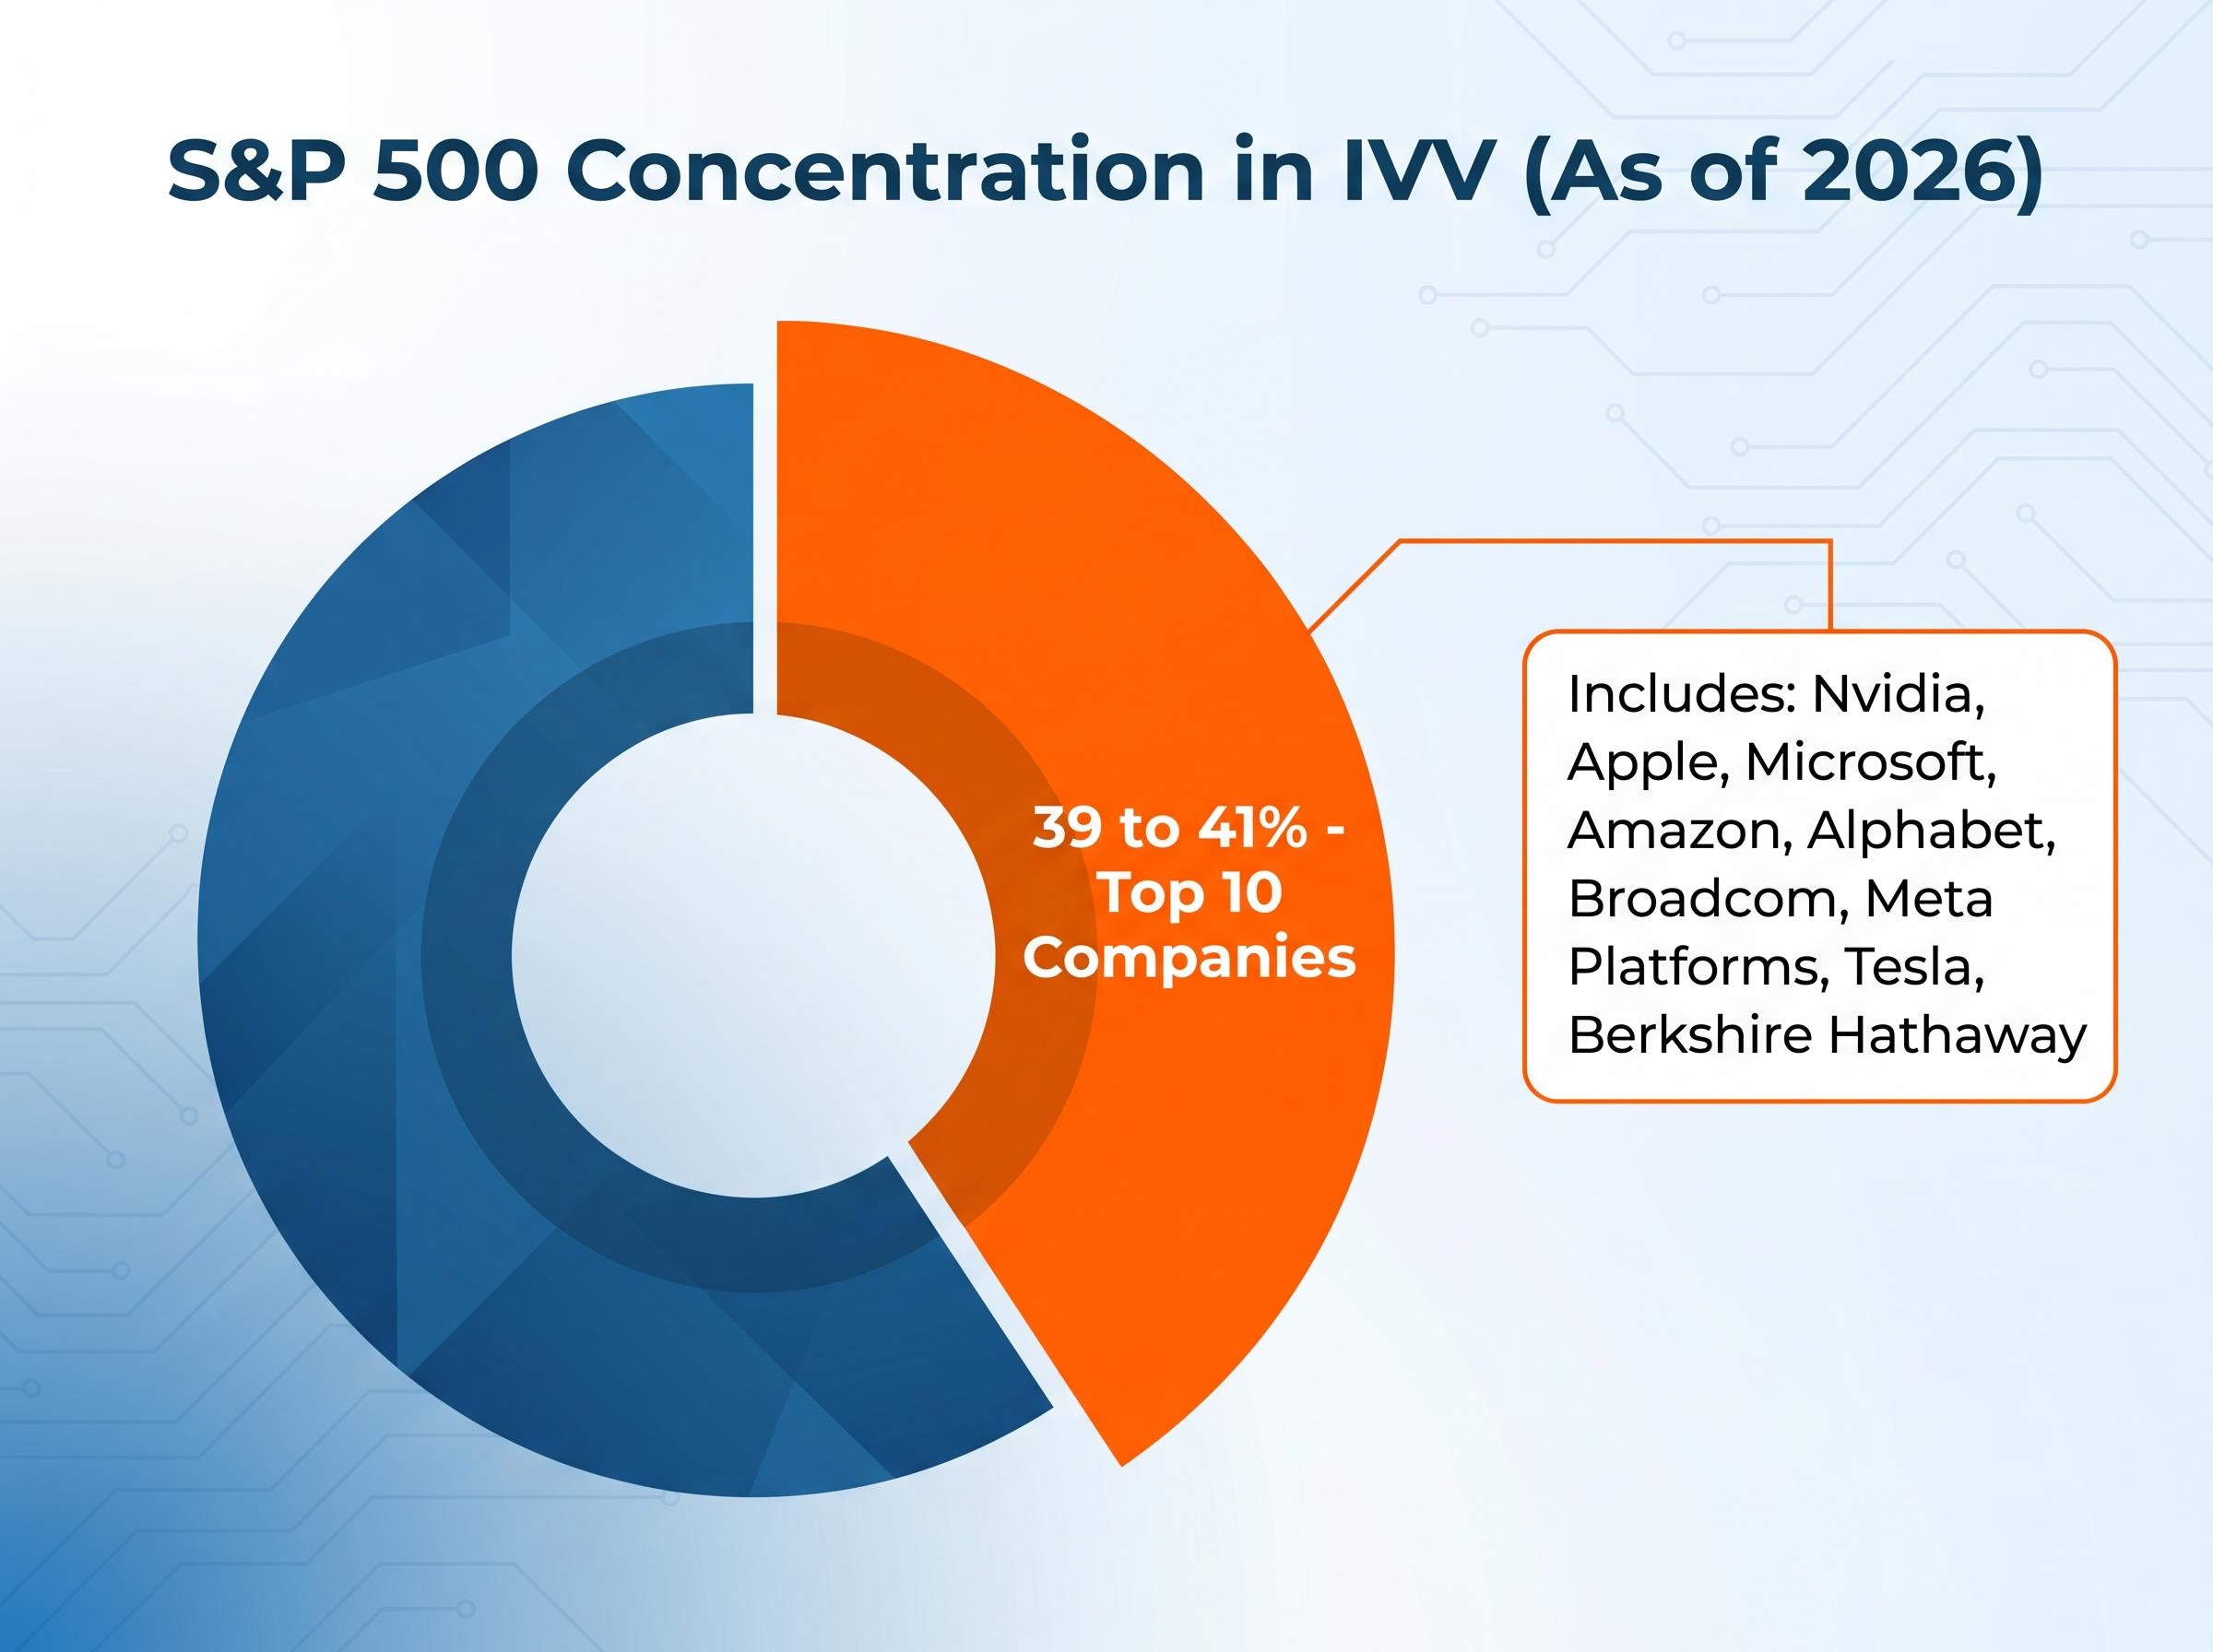
This concentration is neither inherently good nor bad. It is a structural feature of market-cap weighting. When these companies outperform, IVV benefits disproportionately. When they underperform, the drag is equally concentrated. Investors considering IVV for diversification purposes should recognise that “500 companies” does not mean evenly distributed exposure; the tilt toward large-cap technology and AI-related names is substantial.
Investors wanting to stress-test how cap-weighted concentration behaves across full market cycles will find our deep-dive into S&P 500 concentration mechanics, which examines how five mega-cap stocks drove roughly 70% of Q1 2026 losses and then delivered more than half of April’s recovery, quantifying the amplification effect in both directions.
IVV charges a management fee of 0.04% per annum, as confirmed in BlackRock Australia’s Product Disclosure Statement (PDS). That figure has remained unchanged through at least May 2026 and positions IVV among the lowest-cost options available to Australian retail investors for broad US equity exposure.
BlackRock Australia’s IVV product page confirms the 0.04% management fee, details the S&P 500 tracking methodology, and provides the full PDS disclosures that investors should review before committing capital to the fund.
The power of a low fee becomes visible over time through compounding:
A $13.5 billion fund at 0.04% generates approximately $5.4 million in annual management revenue for BlackRock, illustrating that scale enables the fee to remain at this level. For context, many actively managed Australian equity funds charge between 1.0% and 1.5% per annum, a differential that compounds significantly over multi-year holding periods.
IVV’s fee and liquidity advantage over newer entrants like Vanguard’s V500 (launched March 2026 at 0.07%) reflects the compounding benefit of established scale: at AUD 13.5 billion in assets, the fund generates the trading depth and bid-ask tightness that smaller competitors cannot yet match.
Australian investors have access to a small number of ASX-listed S&P 500 ETFs. IVV’s fee positions it at the low end of that peer group. Fee drag is the one variable investors can control with certainty before committing capital, making it a practical starting point for any ETF comparison.
The same growth that rewarded early IVV holders has shifted the entry-point economics for investors considering the fund today. The contrast is direct: $10,000 invested five years ago purchased approximately 274 units (adjusted for the 15-to-1 split in December 2022). At current pricing, $10,000 purchases approximately 142 units.
| Entry Scenario | Investment Amount | Approx. Entry Price (Split-Adjusted) | Units Acquired |
|---|---|---|---|
| April 2021 | $10,000 | ~$36.50 | ~274 |
| May 2026 | $10,000 | ~$70.00 | ~142 |
Fewer units for the same dollar amount is not intrinsically negative. Each unit now represents more underlying value than it did five years ago. The current NAV sits at approximately AUD 69.37 (as of 25 May 2026), with recent traded prices in the AUD 69.70 to AUD 70.01 range. The fund’s net assets total approximately AUD 13.57 billion.
For investors building a position through regular contributions, the higher unit price means smaller amounts buy proportionally less exposure than they once did. Fractional or regular investment strategies can help manage this dynamic over time.
IVV’s track record is genuine. A 14.5% annualised return over five years, delivered through a fund charging 0.04% per annum with a listing history stretching back to October 2007, places it among the most established and cost-effective ASX-listed US equity options available.
IVV’s five-year annualised return of approximately 14.5% provides a concrete performance benchmark, though past performance does not guarantee future results.
The question for investors considering IVV today is not whether the fund delivered in the past, but whether its structural characteristics suit their forward-looking needs. Three considerations warrant assessment:
The fund is not a buy-or-avoid question. It is a fit question, and the answer depends on individual circumstances.
Past performance does not guarantee future results. Financial projections are subject to market conditions and various risk factors.
Investors who have worked through this analysis can move from evaluation to informed decision by consulting the primary data sources directly:
IVV is available through major Australian brokers and investment platforms including CommSec and SelfWealth. The December 2022 unit split (15-to-1) is worth noting when reviewing historical price charts on these platforms.
Before investing, three steps provide a practical framework:
IVV’s 14.5% annualised five-year return is a genuine result, produced by strong US equity performance but partially shaped by currency dynamics that will not always move in the same direction. The fund’s structural strengths, a 0.04% fee, a long ASX listing history since 2007, AUD 13.5 billion in scale, and direct S&P 500 tracking, make it a credible long-term option for Australian investors who understand what they are buying.
Investors entering today are buying future exposure to the S&P 500 at current valuations, current currency levels, and the current concentration profile. All three variables will evolve. The historical record supports the case for IVV; it does not make the case for them.
Investors should consult BlackRock Australia’s PDS and their own financial adviser or research platform before making a final investment decision.
This article is for informational purposes only and should not be considered financial advice. Investors should conduct their own research and consult with financial professionals before making investment decisions.
The iShares S&P 500 ETF (ASX: IVV) is a BlackRock-managed fund that tracks the S&P 500 index using market-capitalisation weighting, giving Australian investors direct exposure to 500 large US companies through a single ASX-listed security at a management fee of just 0.04% per annum.
Between April 2021 and April 2026, IVV delivered an annualised total return of approximately 14.5% per year, turning a $10,000 investment into roughly $19,200, representing more than 90% cumulative unit price appreciation over the five-year period.
Because IVV is an unhedged ETF, Australian investors hold both a US equity position and a currency position simultaneously; when the Australian dollar rises against the USD, the AUD-denominated return is compressed, and when it falls, returns are amplified, as seen over the 12 months to April 2026 when a roughly 10% AUD appreciation dampened returns.
IVV charges a management fee of 0.04% per annum, as confirmed in BlackRock Australia's Product Disclosure Statement, positioning it among the lowest-cost options for broad US equity exposure available to Australian retail investors.
As of 2026, the top 10 companies in the S&P 500, including Nvidia, Apple, Microsoft, Amazon, and Alphabet, account for approximately 39 to 41% of total index weight, meaning IVV's returns are heavily influenced by a small cluster of mega-cap technology and AI-related names.