Vance Pulls Out of Iran Talks, Sending Brent Below $80
1 hr ago
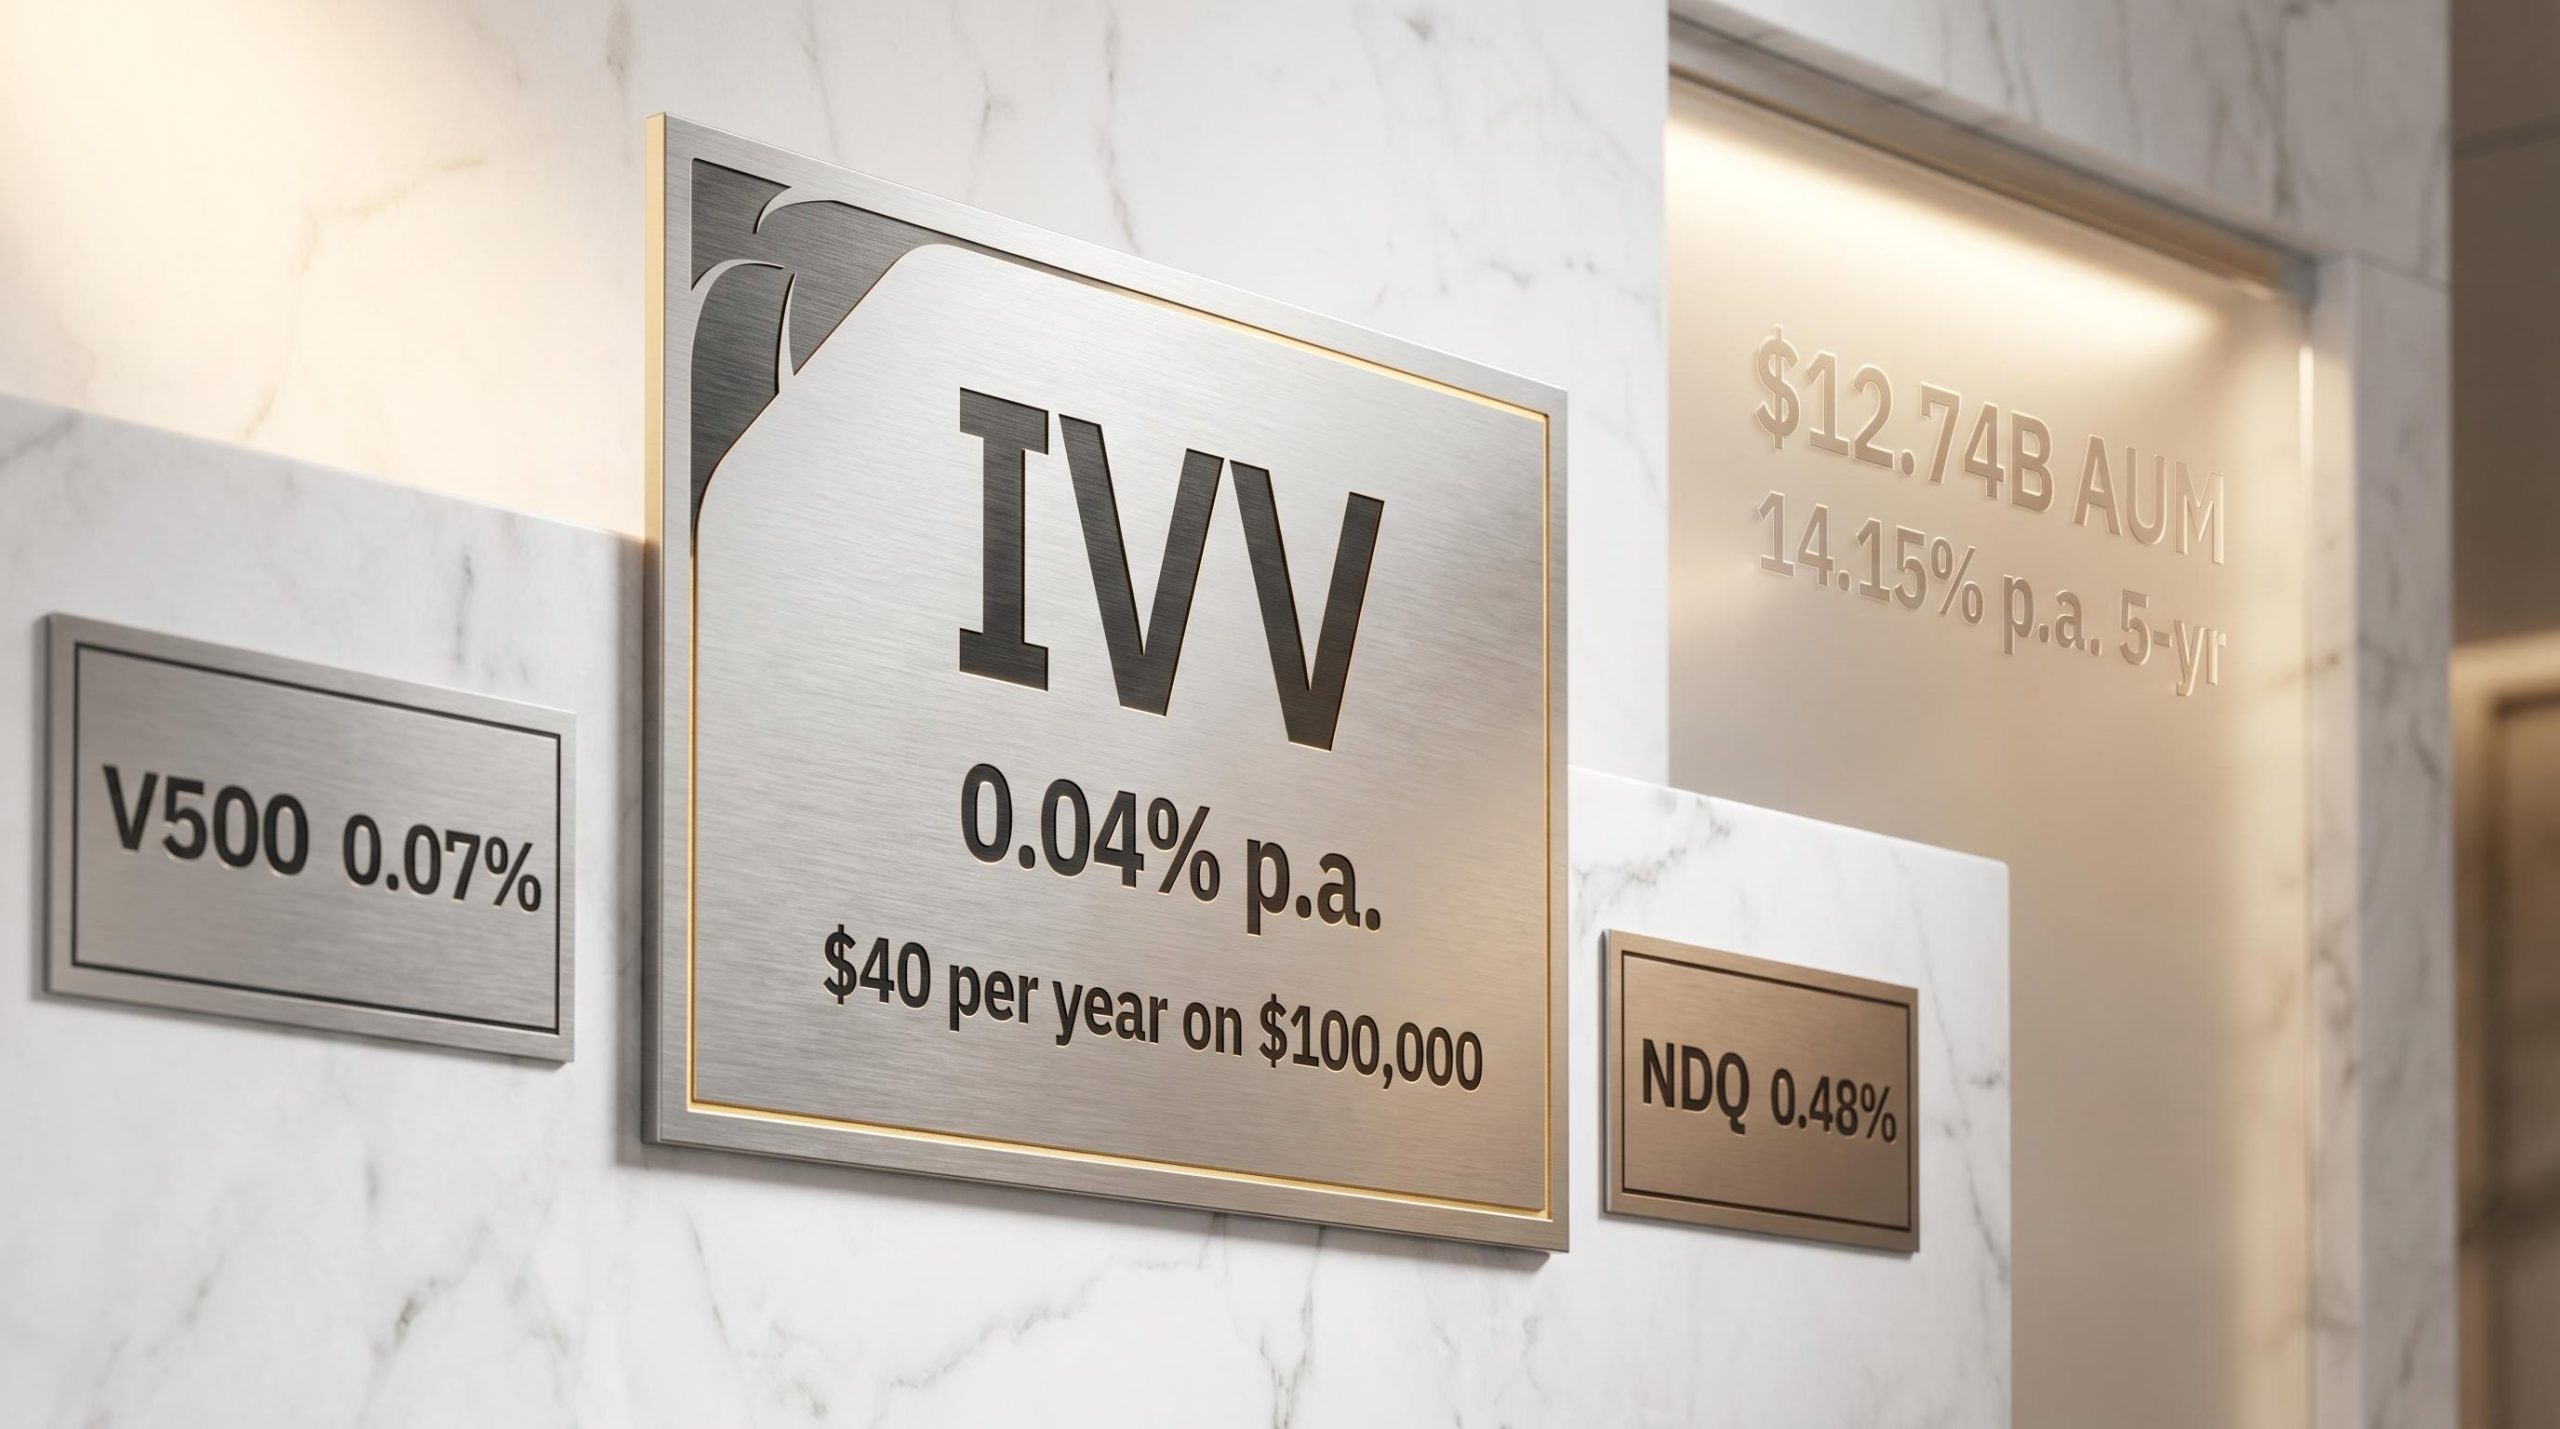
At 0.04% per annum, BlackRock’s iShares S&P 500 ETF costs an investor holding $100,000 precisely $40 a year. That single figure compresses the entire case for low-cost index investing into a number most Australians spend on a weeknight dinner. Yet the IVV ETF is more than a fee story. With Vanguard launching its own S&P 500 vehicle (V500) on the ASX in March 2026 and ongoing volatility reshaping investor sentiment, Australian retail investors are actively reassessing which US equity vehicle deserves a permanent allocation. This analysis examines what IVV delivers across cost efficiency, performance, currency dynamics, and competitor positioning, providing a clear-eyed assessment of whether this fund earns its place as a portfolio foundation.
$12.74 billion in assets under management as of 29 April 2026
That figure is not simply a popularity metric. It represents entrenched investor conviction, accumulated across years of sustained inflows rather than a single capital surge. IVV ranked as the second-highest net inflow ETF on the ASX across 2024, and year-to-November 2025 net inflows reached $1.33 billion, confirming the conviction is ongoing.
The structural decline in home bias among Australian investors has accelerated materially since 2024, with international ETFs overtaking domestic funds as the most purchased category on major retail platforms in Q1 2026, reflecting a generational shift in how Australian portfolios are being constructed rather than a short-term sentiment swing.
For retail investors, scale of this magnitude translates into tangible, everyday advantages:
These are invisible benefits in calm markets. They become material when conditions deteriorate and thinner funds widen spreads or gap in price.
ASIC Regulatory Guide RG 282 establishes the disclosure and market-making obligations that ETF issuers like BlackRock must meet for ASX-listed products, including the product disclosure standards and liquidity requirements that underpin the trading reliability retail investors experience when transacting in IVV.
A management fee of 0.04% sounds trivially small in isolation. Placed alongside the broader ASX ETF landscape, the gap becomes more instructive.
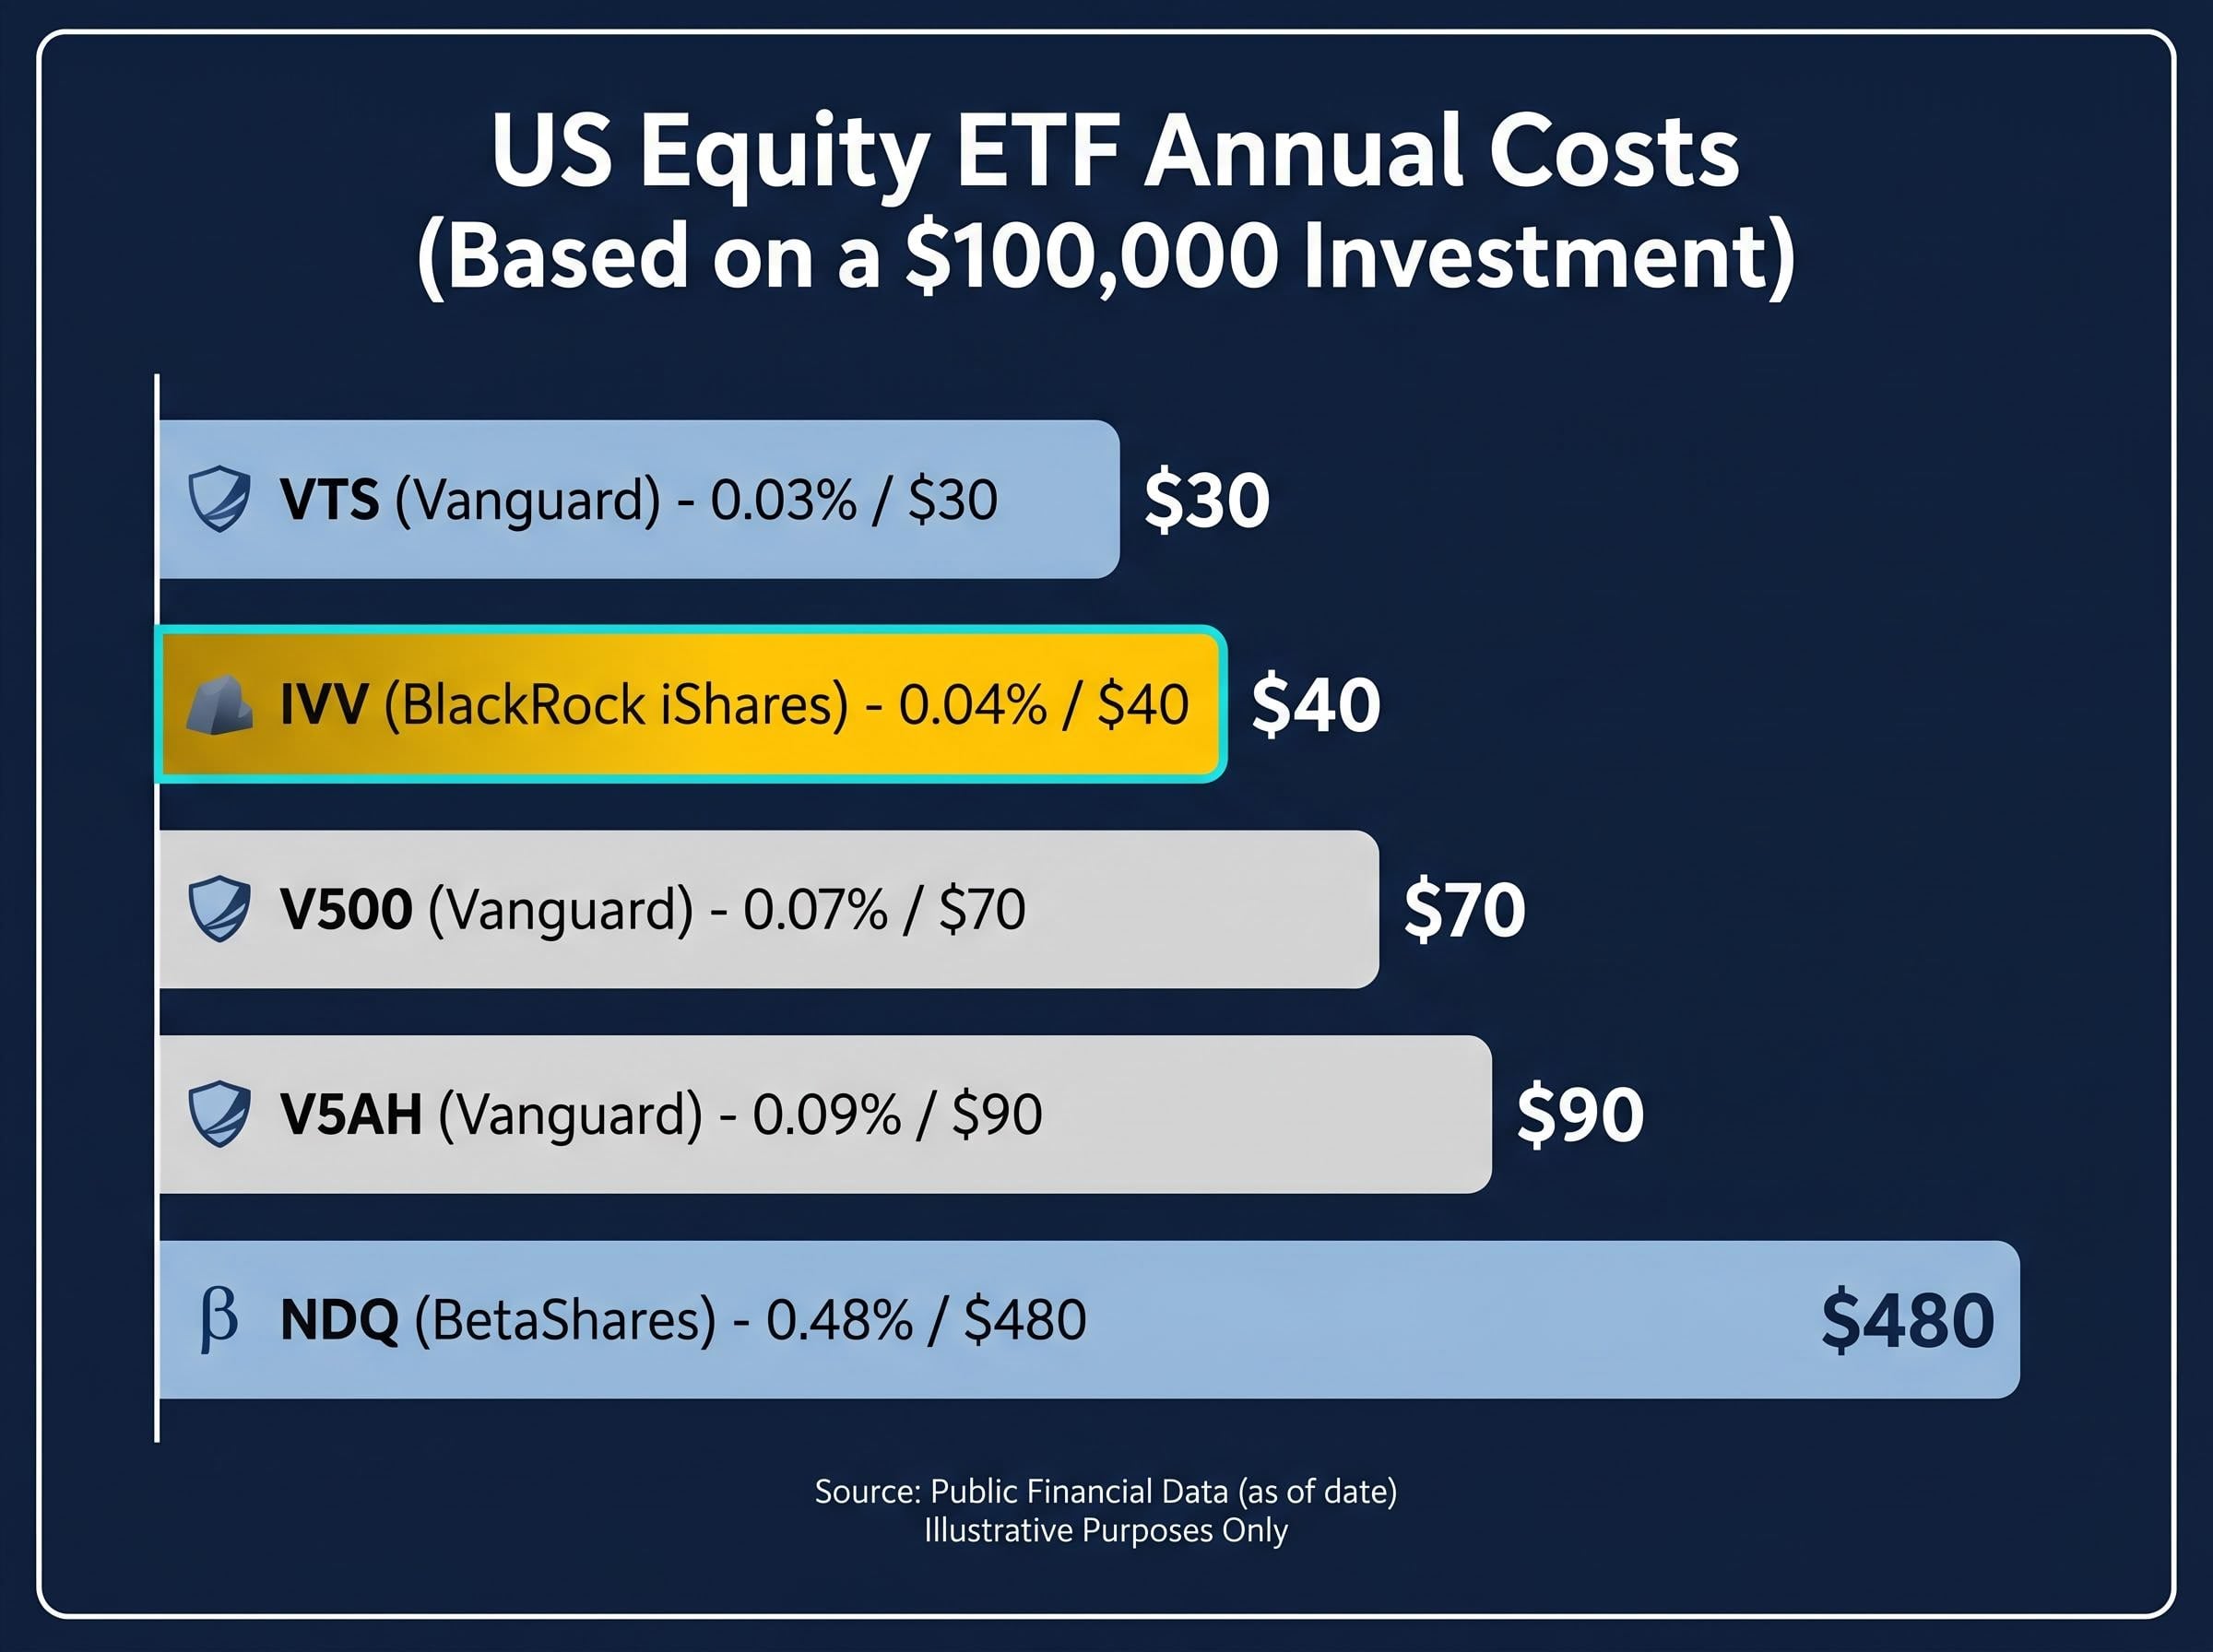
| ETF | Manager | Fee (p.a.) | Coverage | Annual Cost on $100,000 |
|---|---|---|---|---|
| IVV | BlackRock (iShares) | 0.04% | S&P 500 (unhedged) | $40 |
| VTS | Vanguard | 0.03% | US Total Market (unhedged) | $30 |
| V500 | Vanguard | 0.07% | S&P 500 (unhedged) | $70 |
| V5AH | Vanguard | 0.09% | S&P 500 (hedged AUD) | $90 |
| NDQ | BetaShares | 0.48% | NASDAQ 100 (unhedged) | $480 |
Only VTS at 0.03% undercuts IVV, and it tracks a different, broader index. Against V500, which replicates the same S&P 500 index, IVV’s 0.04% fee holds a modest but persistent advantage over V500’s 0.07%, compounded further by IVV’s deeper liquidity and established scale.
The gap between IVV and NDQ illustrates how small fee differences accumulate. On a $100,000 holding, the 0.44% annual fee differential means NDQ costs $440 more per year. Over 10 years, assuming both funds delivered identical gross returns of 10% per annum, the investor in IVV would retain thousands more in compounded savings. Over 20 years, the gap widens further because the fee savings in early years are themselves reinvested, generating returns that the higher-cost investor never captures.
The fee is the one variable fully within an investor’s control. At 0.04%, IVV returns the maximum possible share of underlying market performance to the holder.
The S&P 500 is a market-capitalisation-weighted index. That means each company’s influence on the index’s return is proportional to its total market value: the larger the company, the greater its weight. When Apple, Nvidia, or Microsoft move, IVV moves with them more than when a smaller constituent shifts by the same percentage.
“One ticker provides proportional ownership across 500 companies and 11 sectors of the US economy.”
Those 11 sectors span the breadth of the modern US economy:
Holdings range from Apple and Nvidia to McDonald’s and Tesla, reflecting the index’s design as a cross-section of large-cap American enterprise rather than a bet on any single theme.
S&P 500 concentration has reached levels that merit a structural qualifier on the diversification claim: as of mid-April 2026, five mega-cap stocks controlled approximately 23% of the broad US market index, a share that surpassed the 1930s historical peak and means IVV’s 500-company exposure is more top-heavy than the constituent count implies.
One structural detail matters for what follows: IVV is unhedged. Its net asset value is calculated in AUD, but the underlying 500 companies are priced in USD. That distinction is the bridge to the currency dynamics that shape what Australian holders actually receive.
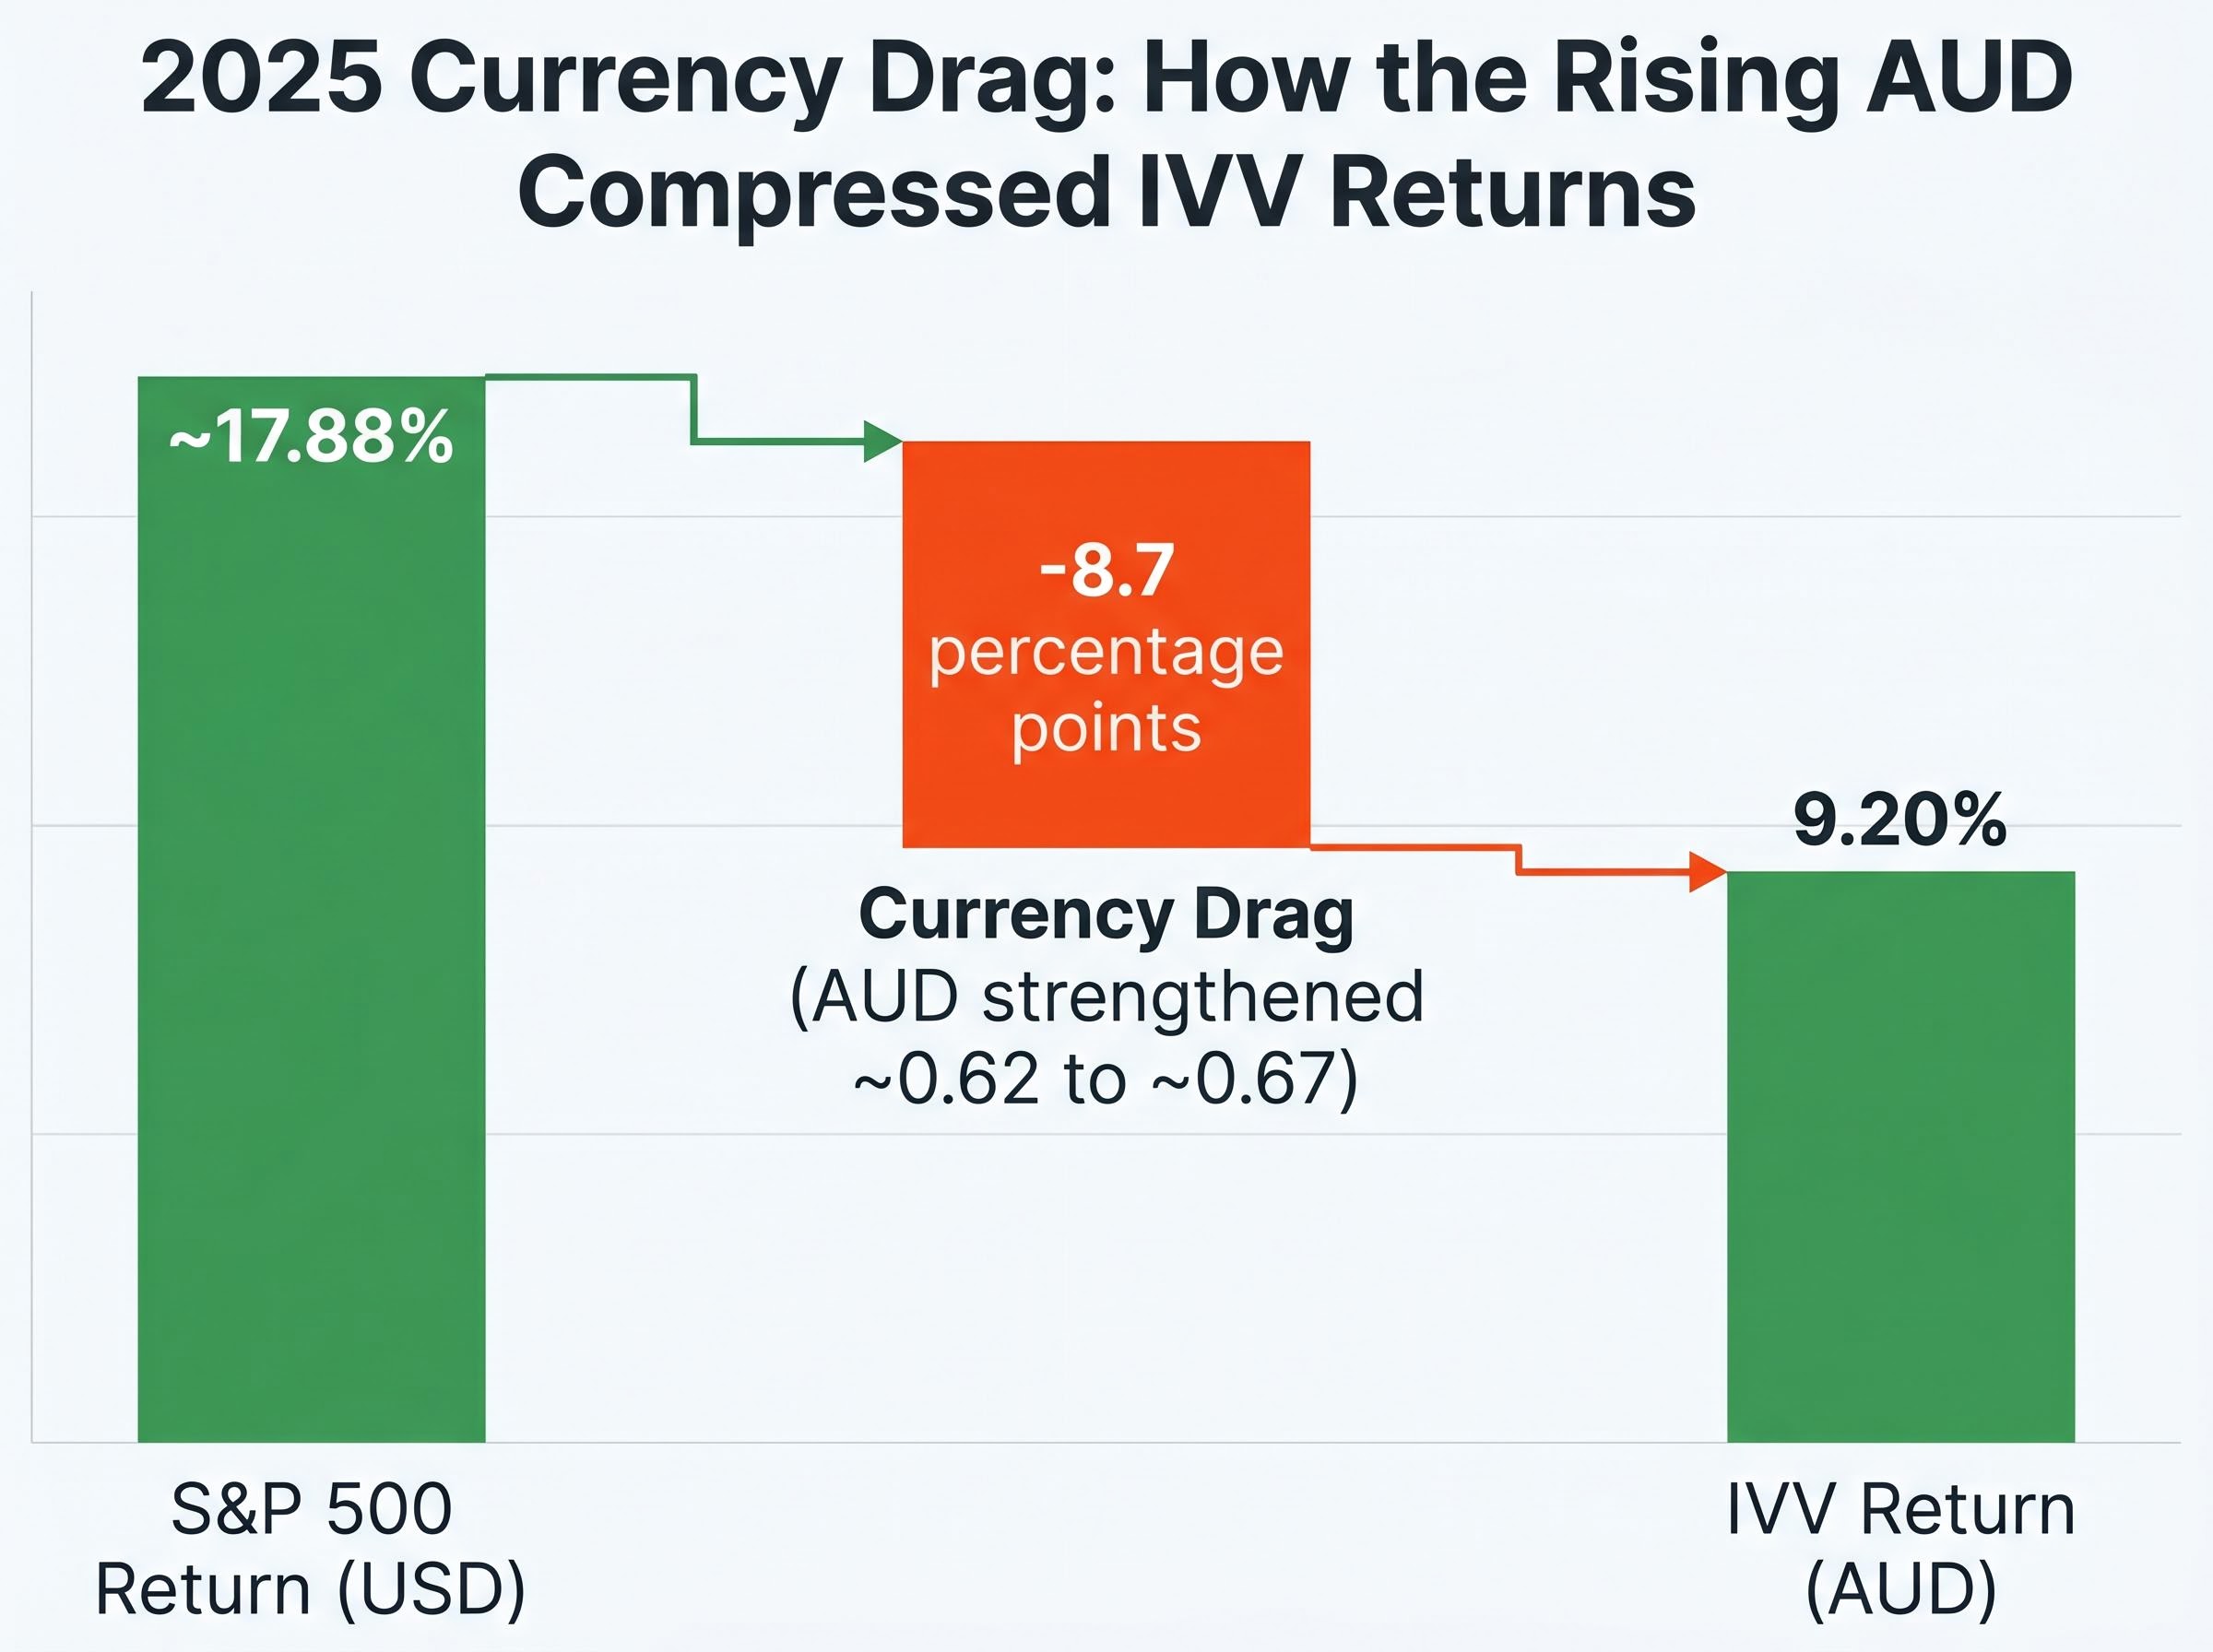
The 2025 calendar year provided a live case study in currency drag. The S&P 500 returned approximately 17.88% total in USD terms. IVV delivered 9.20% in AUD. The gap, nearly 8.7 percentage points, was explained almost entirely by the Australian dollar strengthening from approximately 0.62 to 0.67 against the USD across the year.
The mechanics are straightforward. When the AUD appreciates against the USD, each US dollar of underlying asset value converts back into fewer Australian dollars. For an unhedged holder, a rising AUD compresses returns even when the underlying index performs well.
| Period | S&P 500 USD Return | IVV AUD Return | AUD/USD Movement |
|---|---|---|---|
| 2024 full year | Strong USD year | 37.38% | AUD weakness amplified returns |
| 2025 full year | ~17.88% | 9.20% | ~0.62 → ~0.67 (AUD strength) |
| YTD 2026 (to 29 April) | Negative | -6.93% | ~0.66-0.70 range |
The contrast between 2024 and 2025 is instructive. In 2024, AUD weakness worked in favour of unhedged holders, amplifying the S&P 500’s strong USD performance into a 37.38% AUD return. The following year, the currency effect reversed.
V5AH, Vanguard’s hedged S&P 500 ETF, eliminates AUD/USD return volatility at a cost of 0.09% per annum versus IVV’s 0.04%. The 0.05% differential is modest, but hedging carries its own complexities. In years when the AUD weakens (as in 2024), hedged holders forgo the currency tailwind that benefits unhedged investors.
Over multi-decade periods, currency movements tend to be mean-reverting, which underpins the standard case for maintaining unhedged exposure. For investors with a 10-plus year horizon, unhedged has historically been the preferred default. For those with shorter timeframes or lower tolerance for AUD/USD volatility, V5AH provides a structured alternative.
The multi-period return profile tells a more nuanced story than any single year can convey.
| Period | IVV Return (AUD) | Market Context |
|---|---|---|
| YTD 2026 (to 29 April) | -6.93% | Tariff uncertainty, S&P 500 weakness |
| 1-year (to 29 April 2026) | 6.88% | Mixed conditions, currency headwind |
| 3-year p.a. (to 29 April 2026) | 17.16% | Recovery, AI/tech surge, correction |
| 5-year p.a. (to 29 April 2026) | 14.15% | Full cycle including drawdowns |
| 2025 calendar year | 9.20% | Currency drag on strong USD return |
| 2024 calendar year | 37.38% | AI/tech surge, weak AUD tailwind |
14.15% per annum over five years to 29 April 2026 (AUD, total return including dividends)
The 2024 calendar year return of 37.38% was exceptional, driven by large-cap technology leadership and a favourable AUD/USD environment. The 2025 return of 9.20% was more subdued, with currency drag compressing what was a stronger underlying USD return. The 2026 YTD figure of -6.93% reflects both S&P 500 weakness amid tariff uncertainty and ongoing currency effects.
S&P 500 market conditions in the first quarter of 2026 were shaped by intersecting pressures, including oil price spikes driven by geopolitical supply disruption and recession probability estimates of 30-35% from Goldman Sachs and JPMorgan, which contributed to the tariff-related weakness reflected in IVV’s -6.93% YTD return.
Against local benchmarks, IVV’s 2025 return of 9.20% sat modestly below the ASX 200’s approximately 11.17% total return and NDQ’s 11.35%. Over longer periods, however, IVV’s annualised figures remain competitive. On a 10-year growth comparison (to 31 August 2025), $10,000 invested in IVV grew to $41,884 versus $40,455 in VTS, giving IVV a marginal long-term performance edge over its closest peer.
The 3-year and 5-year annualised figures, 17.16% and 14.15% respectively, are the numbers that carry the most weight for long-term allocation decisions. They capture what IVV compounded across a correction year, a recovery, and a growth surge.
IVV’s combination of the lowest S&P 500-specific fee on the ASX (0.04%), $12.74 billion in assets, established liquidity, and a five-year annualised return of 14.15% positions it as the most practical single vehicle for US large-cap equity exposure available to Australian investors.
IVV suits investors who:
Consider alternatives if:
Against Vanguard’s new V500 (same index, 0.07% fee, launched 3 March 2026), IVV holds advantages in fee, liquidity depth, and years of established price discovery. The competitive gap may narrow over time as V500 builds scale, but today the comparison favours IVV for most retail investors.
Investors exploring how IVV fits alongside other portfolio positions, particularly in a 4.6% CPI environment, will find our dedicated guide to ASX ETFs for the current inflation environment covers six specific funds across income, diversification, and liquidity categories, with explicit yield and return data for each, providing a concrete starting point for portfolio construction decisions beyond the US large-cap allocation.
IVV is a long-duration, unhedged, large-cap US equity holding. It rewards patient capital rather than tactical positioning. For most Australian retail investors building a portfolio for the long term, that is precisely the job it is designed to do.
This article is for informational purposes only and should not be considered financial advice. Investors should conduct their own research and consult with financial professionals before making investment decisions. Past performance does not guarantee future results.
IVV is BlackRock's iShares S&P 500 ETF listed on the ASX, providing exposure to 500 large-cap US companies across 11 sectors of the American economy, including technology, healthcare, financials, and consumer discretionary.
IVV charges a management fee of 0.04% per annum, which works out to $40 per year on a $100,000 holding, making it the lowest-cost S&P 500-specific ETF available on the ASX.
Because IVV is unhedged, AUD/USD movements directly affect returns; in 2025, the S&P 500 returned approximately 17.88% in USD terms but IVV delivered only 9.20% in AUD as the Australian dollar strengthened from around 0.62 to 0.67 against the USD.
Both IVV and V500 track the S&P 500, but IVV has a lower fee (0.04% versus V500's 0.07%), significantly deeper liquidity with $12.74 billion in assets, and years of established price discovery that V500, launched in March 2026, has yet to build.
IVV is best suited to investors with a horizon of 10 years or more who are comfortable with unhedged AUD/USD currency exposure, as currency fluctuations can significantly affect short-term returns but tend to mean-revert over longer periods.