Brent crude near $98 per barrel, the Dollar Index up 1.3% over three months, gold sliding despite active military conflict, and Wall Street futures climbing anyway: the market picture three months into the U.S.-Iran conflict is genuinely contradictory. The Strait of Hormuz has been largely closed to oil tanker traffic since the U.S.-Israeli military operation began in late February 2026. One-fifth of the world’s oil supply flows through that 21-mile passage. Secretary of State Marco Rubio has said the strait will reopen “one way or another,” but additional U.S. strikes near Bandar Abbas on 26 May pushed back optimism for a near-term deal. Markets returned from the Memorial Day weekend parsing all of this in real time. What follows maps the logic behind each major asset class move, explains why some reactions are counterintuitive, and gives retail investors a framework for understanding what de-escalation or further escalation would mean for their portfolios from here.
Three months of conflict have repriced the energy market’s floor
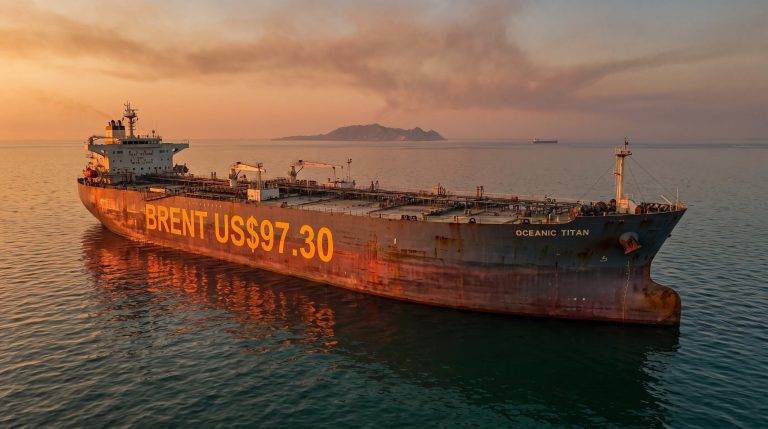
Before the first strikes, Brent crude traded near $70 per barrel. On 26 May 2026, it stood at $98.39. That is not a spike. It is a 40% re-rating of the market’s structural view on energy supply risk.
| Measure | Pre-Conflict (Late Feb 2026) | 26 May 2026 |
|---|---|---|
| Brent Crude | Approx. $70/bbl | $98.39/bbl |
| Implied Risk Premium | Minimal supply disruption priced in | Approx. $28/bbl Hormuz closure premium |
Earlier in the week, Brent dipped below $100 as ceasefire optimism built over the weekend. Then U.S. forces struck Iranian targets near Bandar Abbas, and crude rebounded approximately 2.4% in a single session. That intraday swing captures the market’s condition precisely: every diplomatic signal pulls the price down; every military fact pushes it back up.
Secretary of State Marco Rubio stated the Strait of Hormuz will reopen “one way or another,” though he offered no date-bound timeline.
The floor has shifted because the strait carries roughly one-fifth of global oil supply and remains physically closed. Until that changes, the supply math holds the price above anything resembling the pre-conflict baseline.
When big ASX news breaks, our subscribers know first
What the Strait of Hormuz actually is, and why its closure is unlike other supply shocks
The Strait of Hormuz is a 21-mile-wide passage off Iran’s southern coastline. It is the only sea route out of the Persian Gulf for the region’s oil exporters. Every barrel produced in Saudi Arabia, Iraq, Kuwait, Qatar, and the UAE that moves by tanker passes through this corridor.
EIA data on Hormuz oil transit places the volume at approximately 14 million barrels per day exported from Persian Gulf producers through the strait, a figure that quantifies why no alternative routing arrangement can replicate full throughput within any near-term diplomatic window.
Key facts for context:
- Approximately one-fifth of global oil supply transits the strait daily
- The passage has been effectively closed since late February 2026
- U.S. strikes on 26 May targeted Iranian naval vessels attempting to deploy mines near Bandar Abbas and Qeshm ports
- Renewed military action followed weekend optimism about a ceasefire framework
The mechanism of closure matters. This is not a diplomatic embargo that tankers can test at their own risk. U.S. forces targeted mine-laying vessels and missile sites, meaning the physical threat to commercial shipping is active and military in nature. That distinction separates the Hormuz closure from pipeline outages or Red Sea diversions, where longer alternative voyages still complete.
The closure is not a single mechanism but a reinforcing set of three: the Hormuz triple lock of U.S. naval blockade operations, Iranian toll enforcement on non-U.S. and non-Israeli vessels, and the near-total withdrawal of commercial war-risk insurance means that even a diplomatic signal would not immediately restore commercial traffic, because insurers require a sustained period of incident-free passages before reinstating coverage.
Why alternative routes cannot absorb the shortfall quickly
Saudi Arabia’s East-West pipeline and limited overland alternatives exist, but they cannot replace full Hormuz throughput at current volumes. The infrastructure was built for supplementary capacity, not full substitution; rerouting the region’s entire seaborne oil export through these channels would take years of investment, not weeks of diplomatic progress.
The dollar’s counterintuitive strength is rewriting the safe-haven playbook
The conventional expectation during a geopolitical crisis is that investors flee to gold and that the dollar weakens under the weight of military spending and global uncertainty. Three months into this conflict, the opposite has happened.
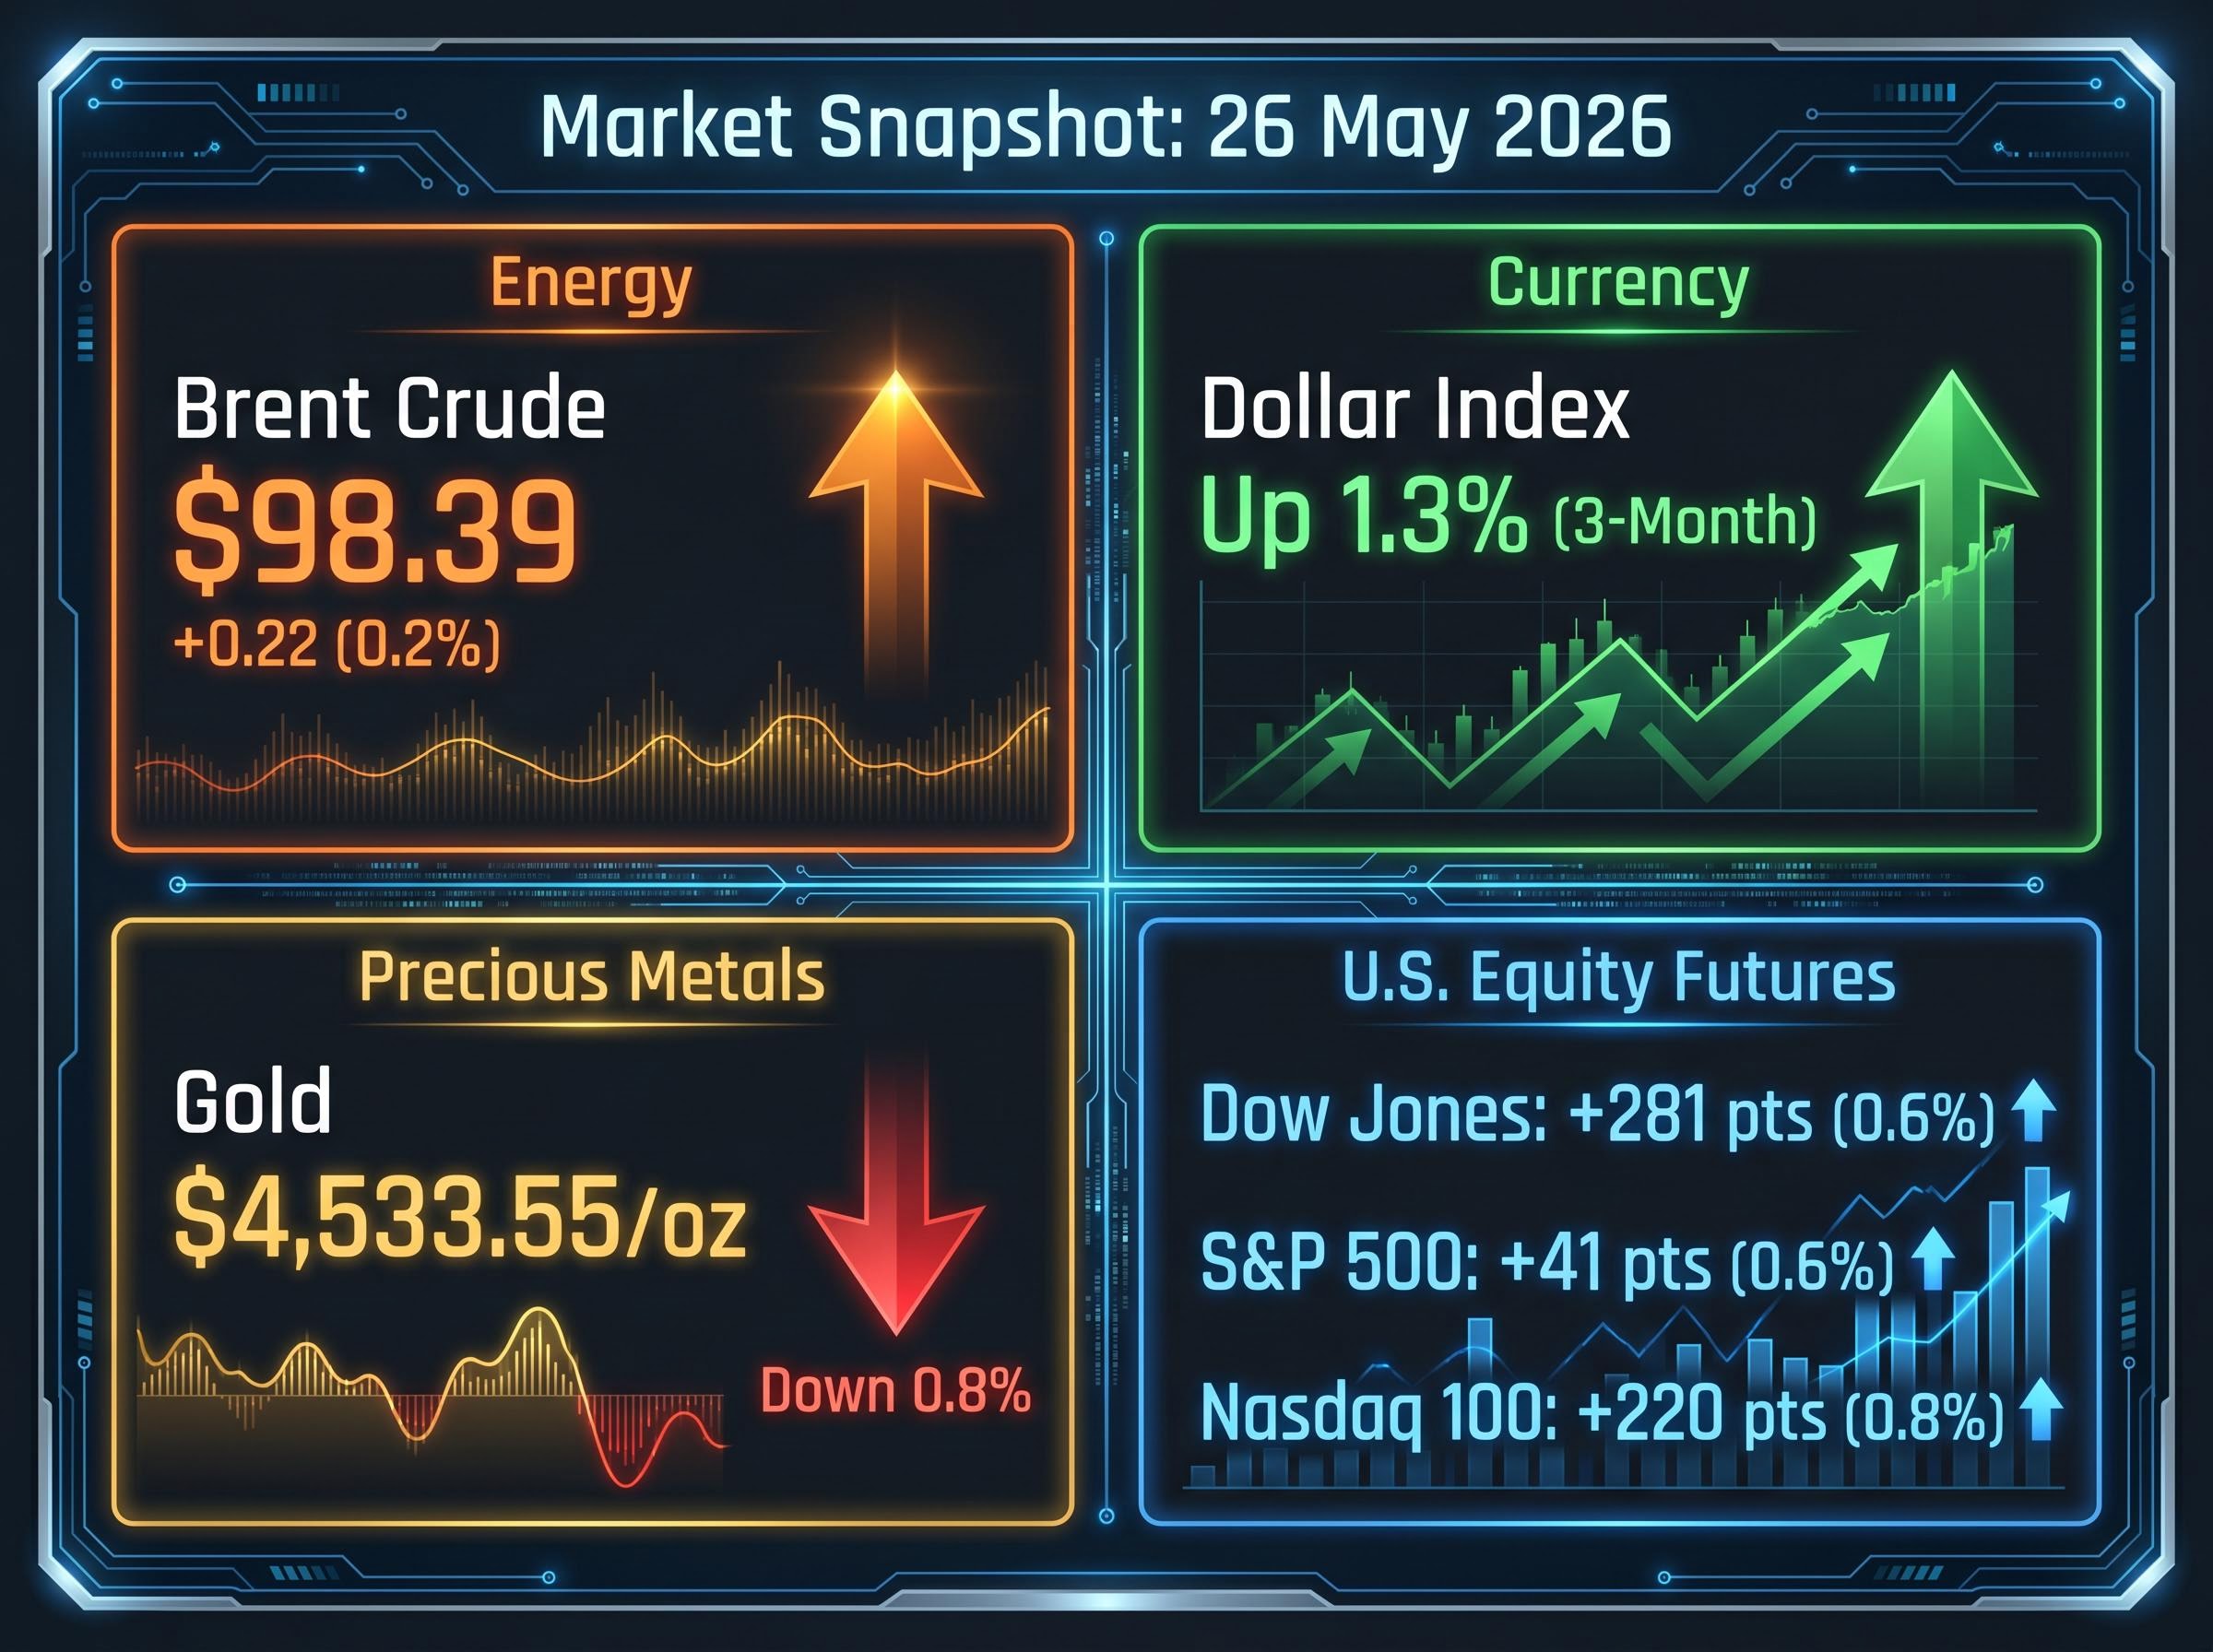
The Dollar Index gained 1.3% over the three months preceding 26 May 2026, a period of active military conflict in which most traditional safe-haven assumptions would have predicted dollar weakness.
Three mechanisms are driving the move:
- Energy-exporter advantage: The U.S. is a net energy exporter. Higher oil prices improve American terms of trade relative to energy-importing economies across Europe and Asia, strengthening the dollar on a relative basis.
- Safe-haven demand: Capital flows toward dollar-denominated assets during periods of global instability, reinforcing the currency.
- Relative rate expectations: If energy-driven inflation keeps the Federal Reserve from cutting rates, the yield advantage on dollar assets persists, drawing further inflows.
The Dollar Index did pull back 0.2% on 26 May, likely reflecting intraday profit-taking ahead of potential ceasefire developments rather than a trend reversal.
Goldman Sachs formalised the structural dollar strength case on 22 May 2026, reversing a prior weakness call by citing U.S. AI capital expenditure reaching 4.9% of GDP and the energy cost asymmetry between domestic producers and energy-importing economies in Europe and Asia as durable rather than cyclical supports.
For U.S. investors holding international equity funds, foreign bonds, or emerging-market positions, a strengthening dollar directly reduces the translated returns on those assets, an effect that compounds over a three-month period.
Gold is falling in a war because the dollar and rates matter more than fear
Gold dropped 0.8% to $4,533.55 per ounce as of 04:09 ET on 26 May 2026. In an active military conflict involving a major oil chokepoint, that decline is the kind of data point that forces investors to re-examine assumptions.
The logic, once unpacked, is mechanical rather than mysterious.
| Headwind | Mechanism | Reader Implication |
|---|---|---|
| Stronger dollar | Gold is priced in U.S. dollars; a 1.3% Dollar Index gain raises the effective cost for non-U.S. buyers, compressing global demand | Dollar strength acts as a ceiling on gold even when geopolitical fear would otherwise support it |
| Higher-for-longer rate expectations | Energy-driven inflation may keep central banks from cutting rates, making zero-yield assets like gold less attractive relative to rate-bearing alternatives | The inflation the conflict generates paradoxically creates the conditions that weaken gold’s relative position |
This is not a verdict on gold’s long-term role in a portfolio. It is a specific context in which the two forces that most directly influence gold’s price, the dollar and interest-rate expectations, are both working against it simultaneously. For investors who bought gold as geopolitical insurance, recovery would likely require either a dollar reversal or a shift in rate expectations, neither of which the current conflict trajectory supports in the near term.
Equity futures are climbing because markets are pricing the ending, not the current chapter
U.S. equity futures opened higher after the Memorial Day weekend, with specific moves as of 03:42 ET on 26 May 2026:
- Dow Jones futures: up 281 points (0.6%)
- S&P 500 futures: up 41 points (0.6%)
- Nasdaq 100 futures: up 220 points (approximately 0.8%)
The Dow Jones Industrial Average had already set a fresh record closing high in the prior Friday session.
ING analysts noted that markets appear inclined to continue pricing in de-escalation despite periodic military actions, according to reporting from Investing.com.
That framing deserves scrutiny. If markets are pricing de-escalation, they are effectively discounting a resolution rather than the continuation of the current state. The bet embedded in rising futures is that the Strait reopens on a workable timetable, that energy-driven inflation proves temporary, and that corporate earnings guidance does not need to absorb a prolonged input-cost shock.
The de-escalation bet embedded in equity futures has a ceiling even if it pays off: the 14 April ceasefire rally saw the Nasdaq gain approximately 2% against the Dow’s 0.63%, suggesting that AI-linked growth stocks led even inside what looked like a broadening move, and Wolfe Research projects sustained sector rotation would require bond yields to compress below 4.25% and hold there for multiple quarters, not just the announcement of a deal.
What would break the de-escalation thesis
Two scenarios would challenge the current equity positioning most directly. The first is a material escalation beyond targeted strikes, any action that signals the conflict is widening rather than narrowing. The second is a Strait closure that extends long enough to feed measurably into next-quarter earnings guidance from energy-intensive sectors. If companies begin revising margin forecasts downward citing sustained input costs above $95 per barrel, the gap between the market’s optimism and corporate reality would narrow quickly.
The asymmetric scorecard: what de-escalation and re-escalation each mean from here
The diplomatic signal available on 26 May is mixed. President Donald Trump expressed weekend optimism about an “imminent deal.” Secretary Rubio maintained the strait would reopen “one way or another.” Then fresh strikes near Bandar Abbas pushed back the timeline. Markets have absorbed three months of exactly this pattern: hope followed by military reality.
| Scenario | Oil Price Direction | Dollar Direction | Gold Direction | Equity Implication |
|---|---|---|---|---|
| De-escalation: Strait reopens on credible timetable | Brent retreats toward $80-$85 range | Dollar strength moderates as energy advantage narrows | Gold recovers as dollar and rate headwinds ease | Equity gains consolidate with reduced inflation overhang |
| Re-escalation: Failed diplomacy, Strait remains closed | Brent tests $100+ | Dollar strengthens further on safe-haven and energy flows | Gold remains pressured by dollar and rate dynamics | De-escalation bet faces the correction it has avoided |
Brent at $98.39 sits at the inflection point between these two paths. Retail investors who understand this two-scenario map can make deliberate choices about hedging, rebalancing, or holding rather than reacting to each day’s headline as if it represents a new story.
The conflict will end, but the market habits it has built may not
Three months is long enough for structural repricing, not just a volatility event. The 40% move in Brent and the dollar’s sustained 1.3% gain are not noise; they are new baselines that reflect a supply architecture disruption already embedded in how capital is allocated across energy, currency, and fixed income.
The contradictory picture from the introduction, rising oil, strong dollar, falling gold, climbing equities, resolves once the specific mechanism behind each move is understood. Each is internally consistent. Oil prices reflect a physical chokepoint. The dollar reflects America’s energy-exporter advantage. Gold reflects the dollar and rate environment that the conflict itself created. Equities reflect a forward bet on resolution.
The most useful takeaway is not a directional call on any single asset. It is knowing which asset carries which assumption, so that when the diplomatic situation shifts, investors can identify which positions will move first and why. Secretary Rubio’s statements and the physical status of the Strait remain the most reliable leading indicators. Energy, currency, and inflation exposure deserve review in the context of both paths outlined above.
For investors wanting to convert the two-scenario map into specific portfolio actions, our comprehensive guide to geopolitical investing strategy covers gold allocation sizing, bond duration adjustments for energy-driven inflation, sector exposure review across energy and defence, and the rebalancing cadence that BlackRock and Vanguard both recommend for navigating sustained geopolitical volatility.
This article is for informational purposes only and should not be considered financial advice. Investors should conduct their own research and consult with financial professionals before making investment decisions. Forward-looking statements regarding asset price directions under de-escalation or re-escalation scenarios are speculative and subject to change based on market developments and geopolitical conditions.