Nvidia’s market capitalisation sits near $5 trillion. SpaceX is filing for a public debut. South Korean retail investors are piling into memory chipmakers even as foreign institutions quietly trim. In financial markets, the moment a narrative feels inevitable is often the moment its power to generate returns begins to fade.
US Technology equities have led global markets for the better part of fifteen years. That leadership has produced extraordinary returns, but it has also produced extraordinary expectations. As of May 2026, the gap between what investors expect from Tech and what they expect from everything else is near the widest on record, on almost every valuation measure that matters.
What follows examines the investment logic behind market leadership rotation, the specific evidence that expectations for US Tech have reached an elevation where positive surprise becomes structurally difficult, and why non-US, non-Tech developed market equities may now carry the more asymmetric risk-reward profile. The argument is not that Tech will collapse. It is that the maths of expectations now favours looking elsewhere.
The investment principle that makes high expectations dangerous
Markets advance most when outcomes exceed prevailing expectations. This is not a directional forecast about Tech’s business quality; it is a statement about price and probability. When a sector or market must deliver perfection to justify its current valuation, any deviation, even a strong but not-perfect result, registers as disappointment.
The logic runs consistently through the institutional frameworks of BlackRock, Vanguard, Research Affiliates, and GMO: a stock priced for 30% earnings growth that delivers 25% earnings growth has, by most measures, failed. Not because the business deteriorated, but because the price already assumed more.
When expectations are priced for perfection, even excellent outcomes can disappoint. The probability of positive surprise falls as the consensus rises.
This is the mechanism that makes high valuations dangerous irrespective of underlying fundamentals. It is also the mechanism that makes low valuations forgiving. A market priced for stagnation that delivers modest growth registers as a positive surprise and re-rates upward. The same modest growth in a market priced for excellence barely moves the needle.
Every data point that follows in this analysis, the sentiment signals, the valuation spreads, the historical precedents, rests on this single principle. Without it, the numbers are just numbers. With it, they become evidence in a probability argument about where the next decade’s returns are most likely to compound.
Late-cycle equity positioning across major institutional managers reflects this tension directly: BlackRock, Fidelity, and JPMorgan maintained constructive stances through mid-May 2026 while simultaneously flagging that AI valuation risk and index concentration had narrowed the margin for error compared to earlier in the bull run.
When big ASX news breaks, our subscribers know first
What elevated sentiment looks like in practice right now
The expectations principle is abstract until it meets live evidence. Right now, the evidence is accumulating in several distinct but converging signals:
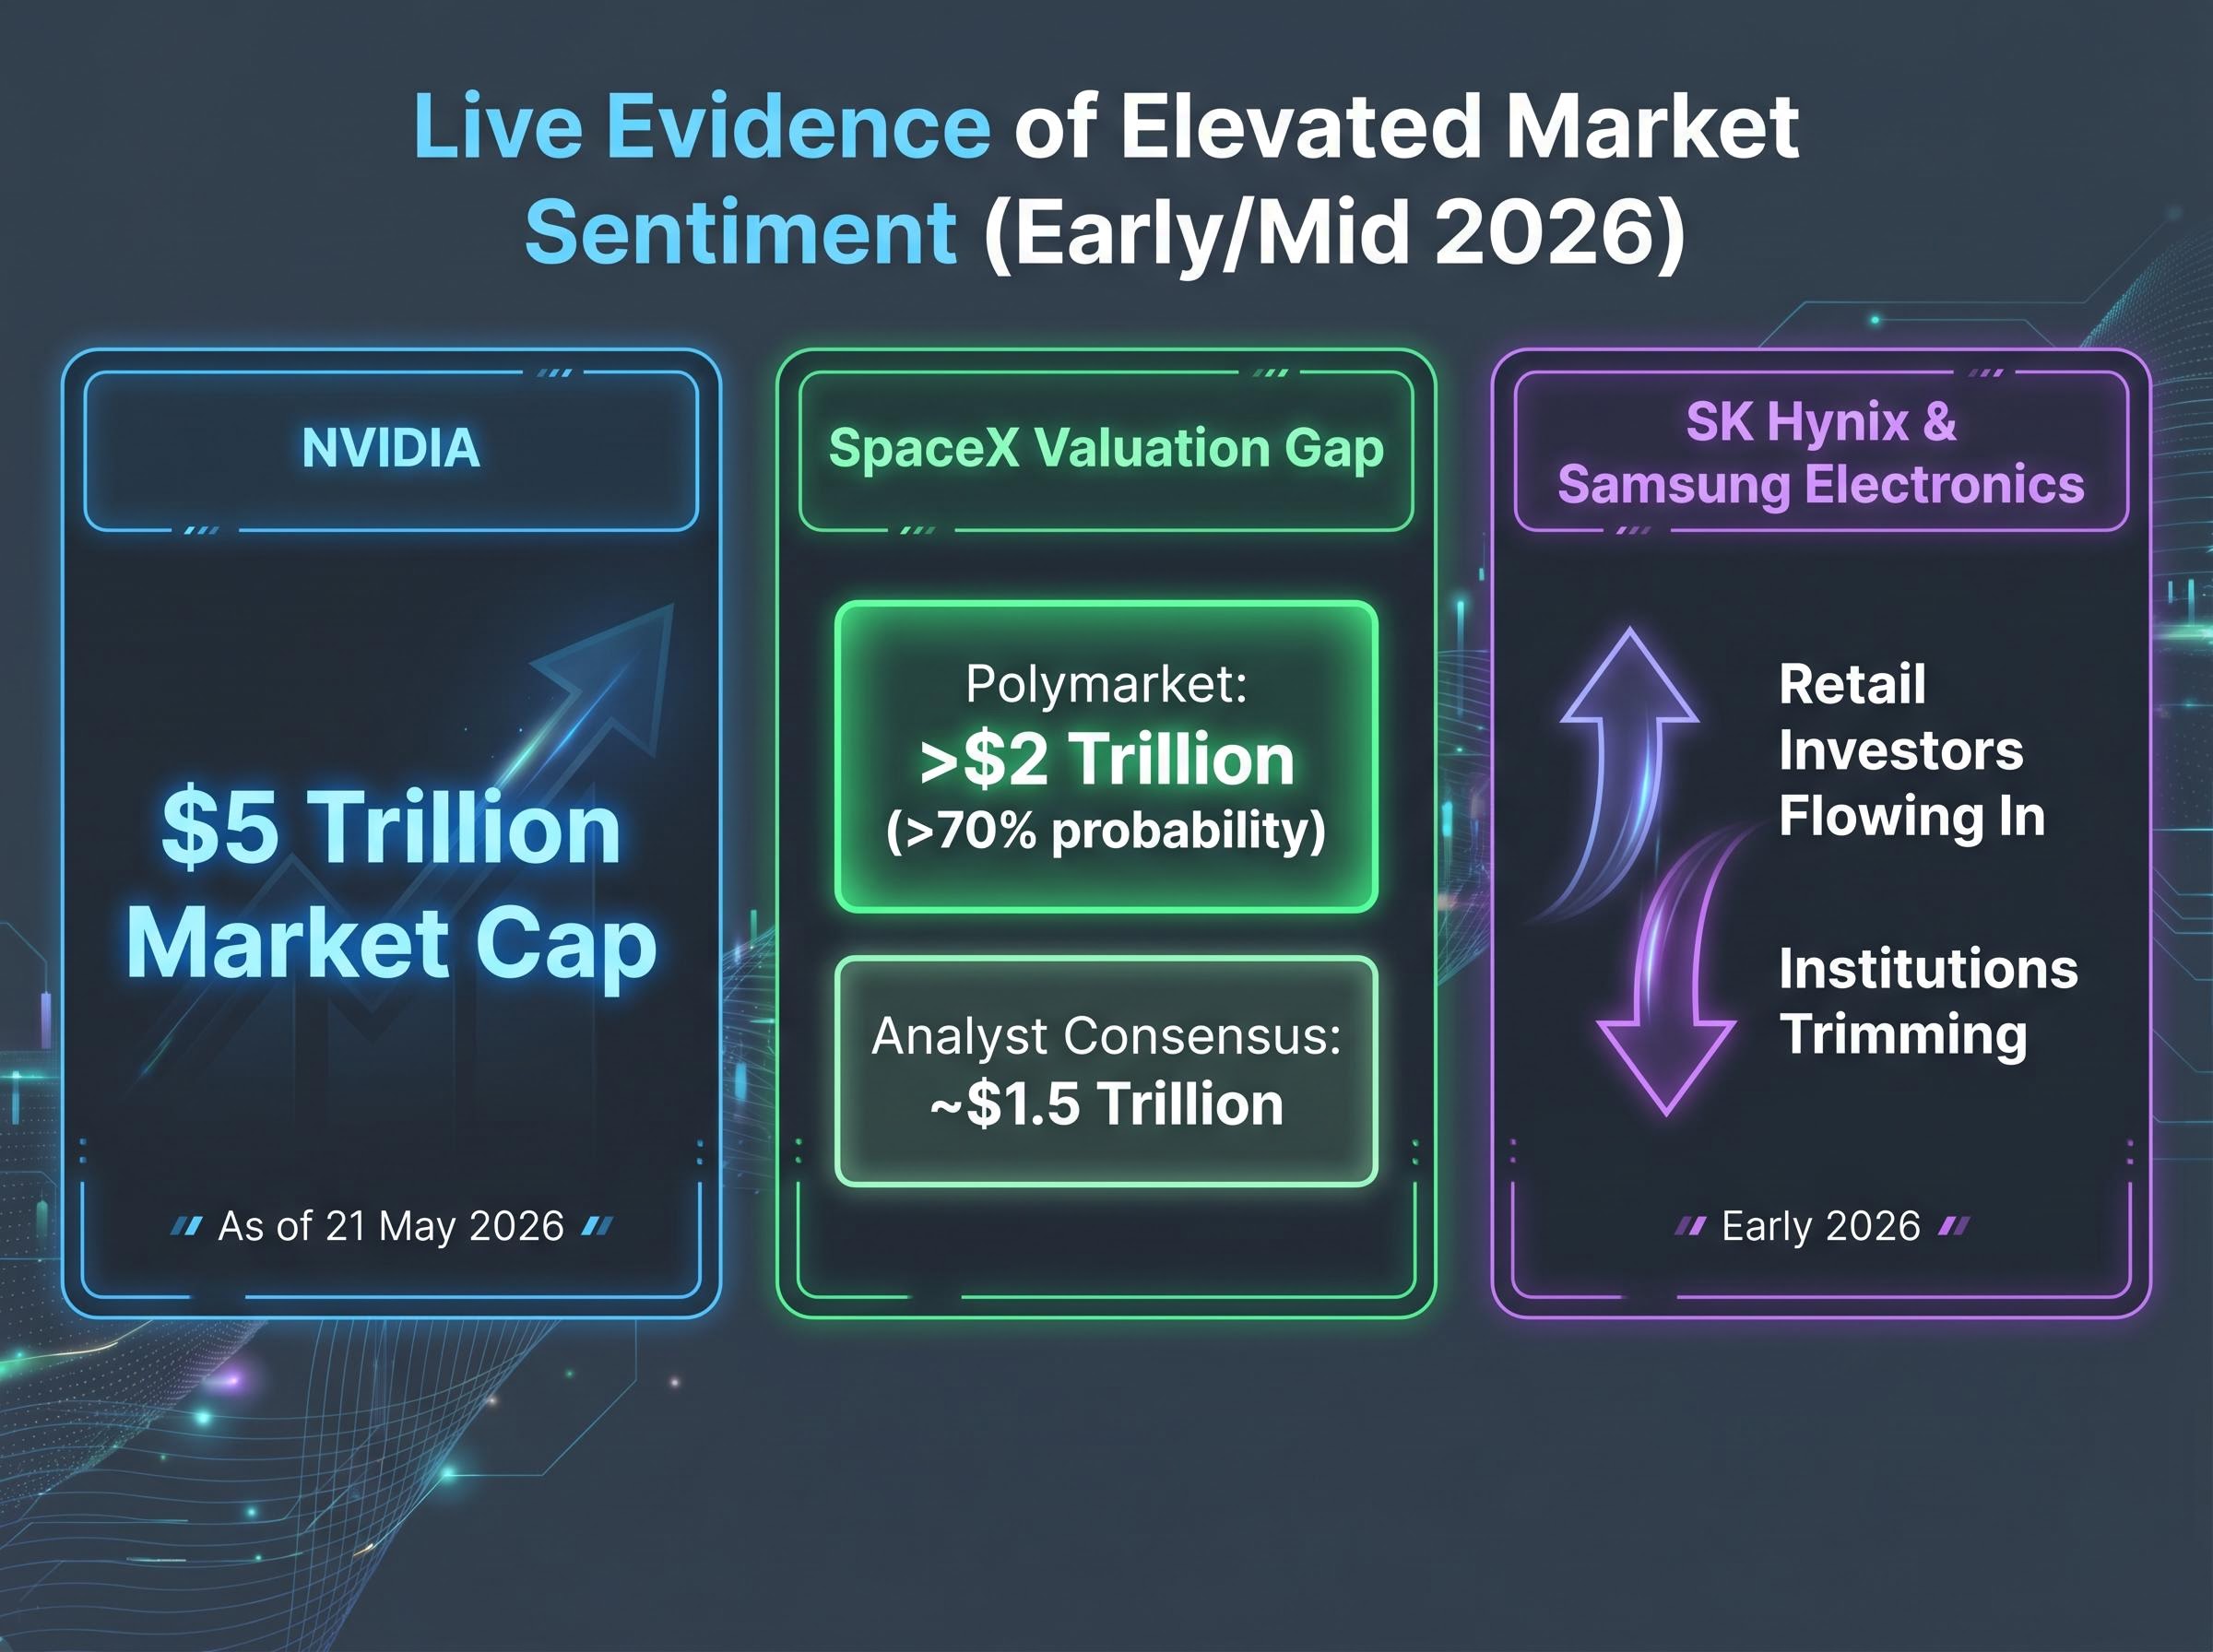
- Nvidia’s market capitalisation reached approximately $5 trillion as of 21 May 2026, according to the Wall Street Journal, placing it among the most valuable companies in history.
- Media narrative has shifted: where earlier coverage flagged narrow market breadth as a risk, current coverage reframes Nvidia’s relative underperformance as a buying opportunity and treats Tech sector leadership as a structural given.
- Polymarket participants placed over 70% probability on a SpaceX public debut valuation above $2 trillion, while analyst consensus clusters closer to $1.5 trillion, a gap that captures the premium retail enthusiasm is willing to pay for narrative momentum.
- South Korean retail investors continued flowing into memory chipmakers such as SK Hynix and Samsung Electronics in early 2026, even as domestic pension funds and foreign institutions reduced exposure to manage concentration risk, according to Bloomberg’s Shuli Ren.
Each signal, taken alone, is just a data point. Taken together, they describe a market where enthusiasm is not merely present but already embedded in prices. The Netherlands, for instance, stands as one of the few European markets to have recovered above pre-conflict levels, and the explanation offered is its Tech-heavy index composition.
When retail investors buy what institutions are trimming, and when prediction markets price outcomes above professional consensus, the expectations gap principle is no longer theoretical. It is operating in real time.
The BofA Bull and Bear Indicator reaching 8.0 in May 2026 captured the same dynamic in quantified form: approximately $9 billion in weekly technology inflows, fund manager cash compressing to 3.9%, and equity overweights at record levels, converging into a signal that has historically preceded global equity declines of 2-3% within three months.
How stretched are the numbers? Valuations across geographies
The sentiment signals describe the mood. The valuations describe what that mood has already done to prices.
Across multiple independent sources and methodologies, the directional picture converges: forward price-to-earnings ratios and cyclically adjusted price-to-earnings (CAPE) ratios between US Tech and international developed markets sit near multi-decade extremes. The table below draws on directionally consistent figures cited across JPMorgan, MSCI, Schroders, Robeco, and GMO as of Q1-Q2 2026.
| Index / Region | Forward P/E (approx.) | CAPE (approx.) | vs. US Tech Premium | Directional Institutional View |
|---|---|---|---|---|
| US Tech (S&P 500 IT) | 29-30x | N/A (sector-level) | Baseline | Priced for perfection |
| Broad US (S&P 500) | ~21x | ~31x | ~30% discount | Elevated relative to history |
| Europe (MSCI Europe) | ~14x | ~19x | ~50-55% discount | Multi-decade discount to US |
| Japan (MSCI Japan) | ~15x | ~18x | ~50% discount | Corporate reform tailwind |
| MSCI EAFE | ~14x | ~18-19x | ~50-55% discount | Favoured by majority of strategists |
Figures are directionally indicative, drawn from multiple institutional sources as of Q1-Q2 2026, and should be verified against primary MSCI, FactSet, and S&P Dow Jones data before acting on them.
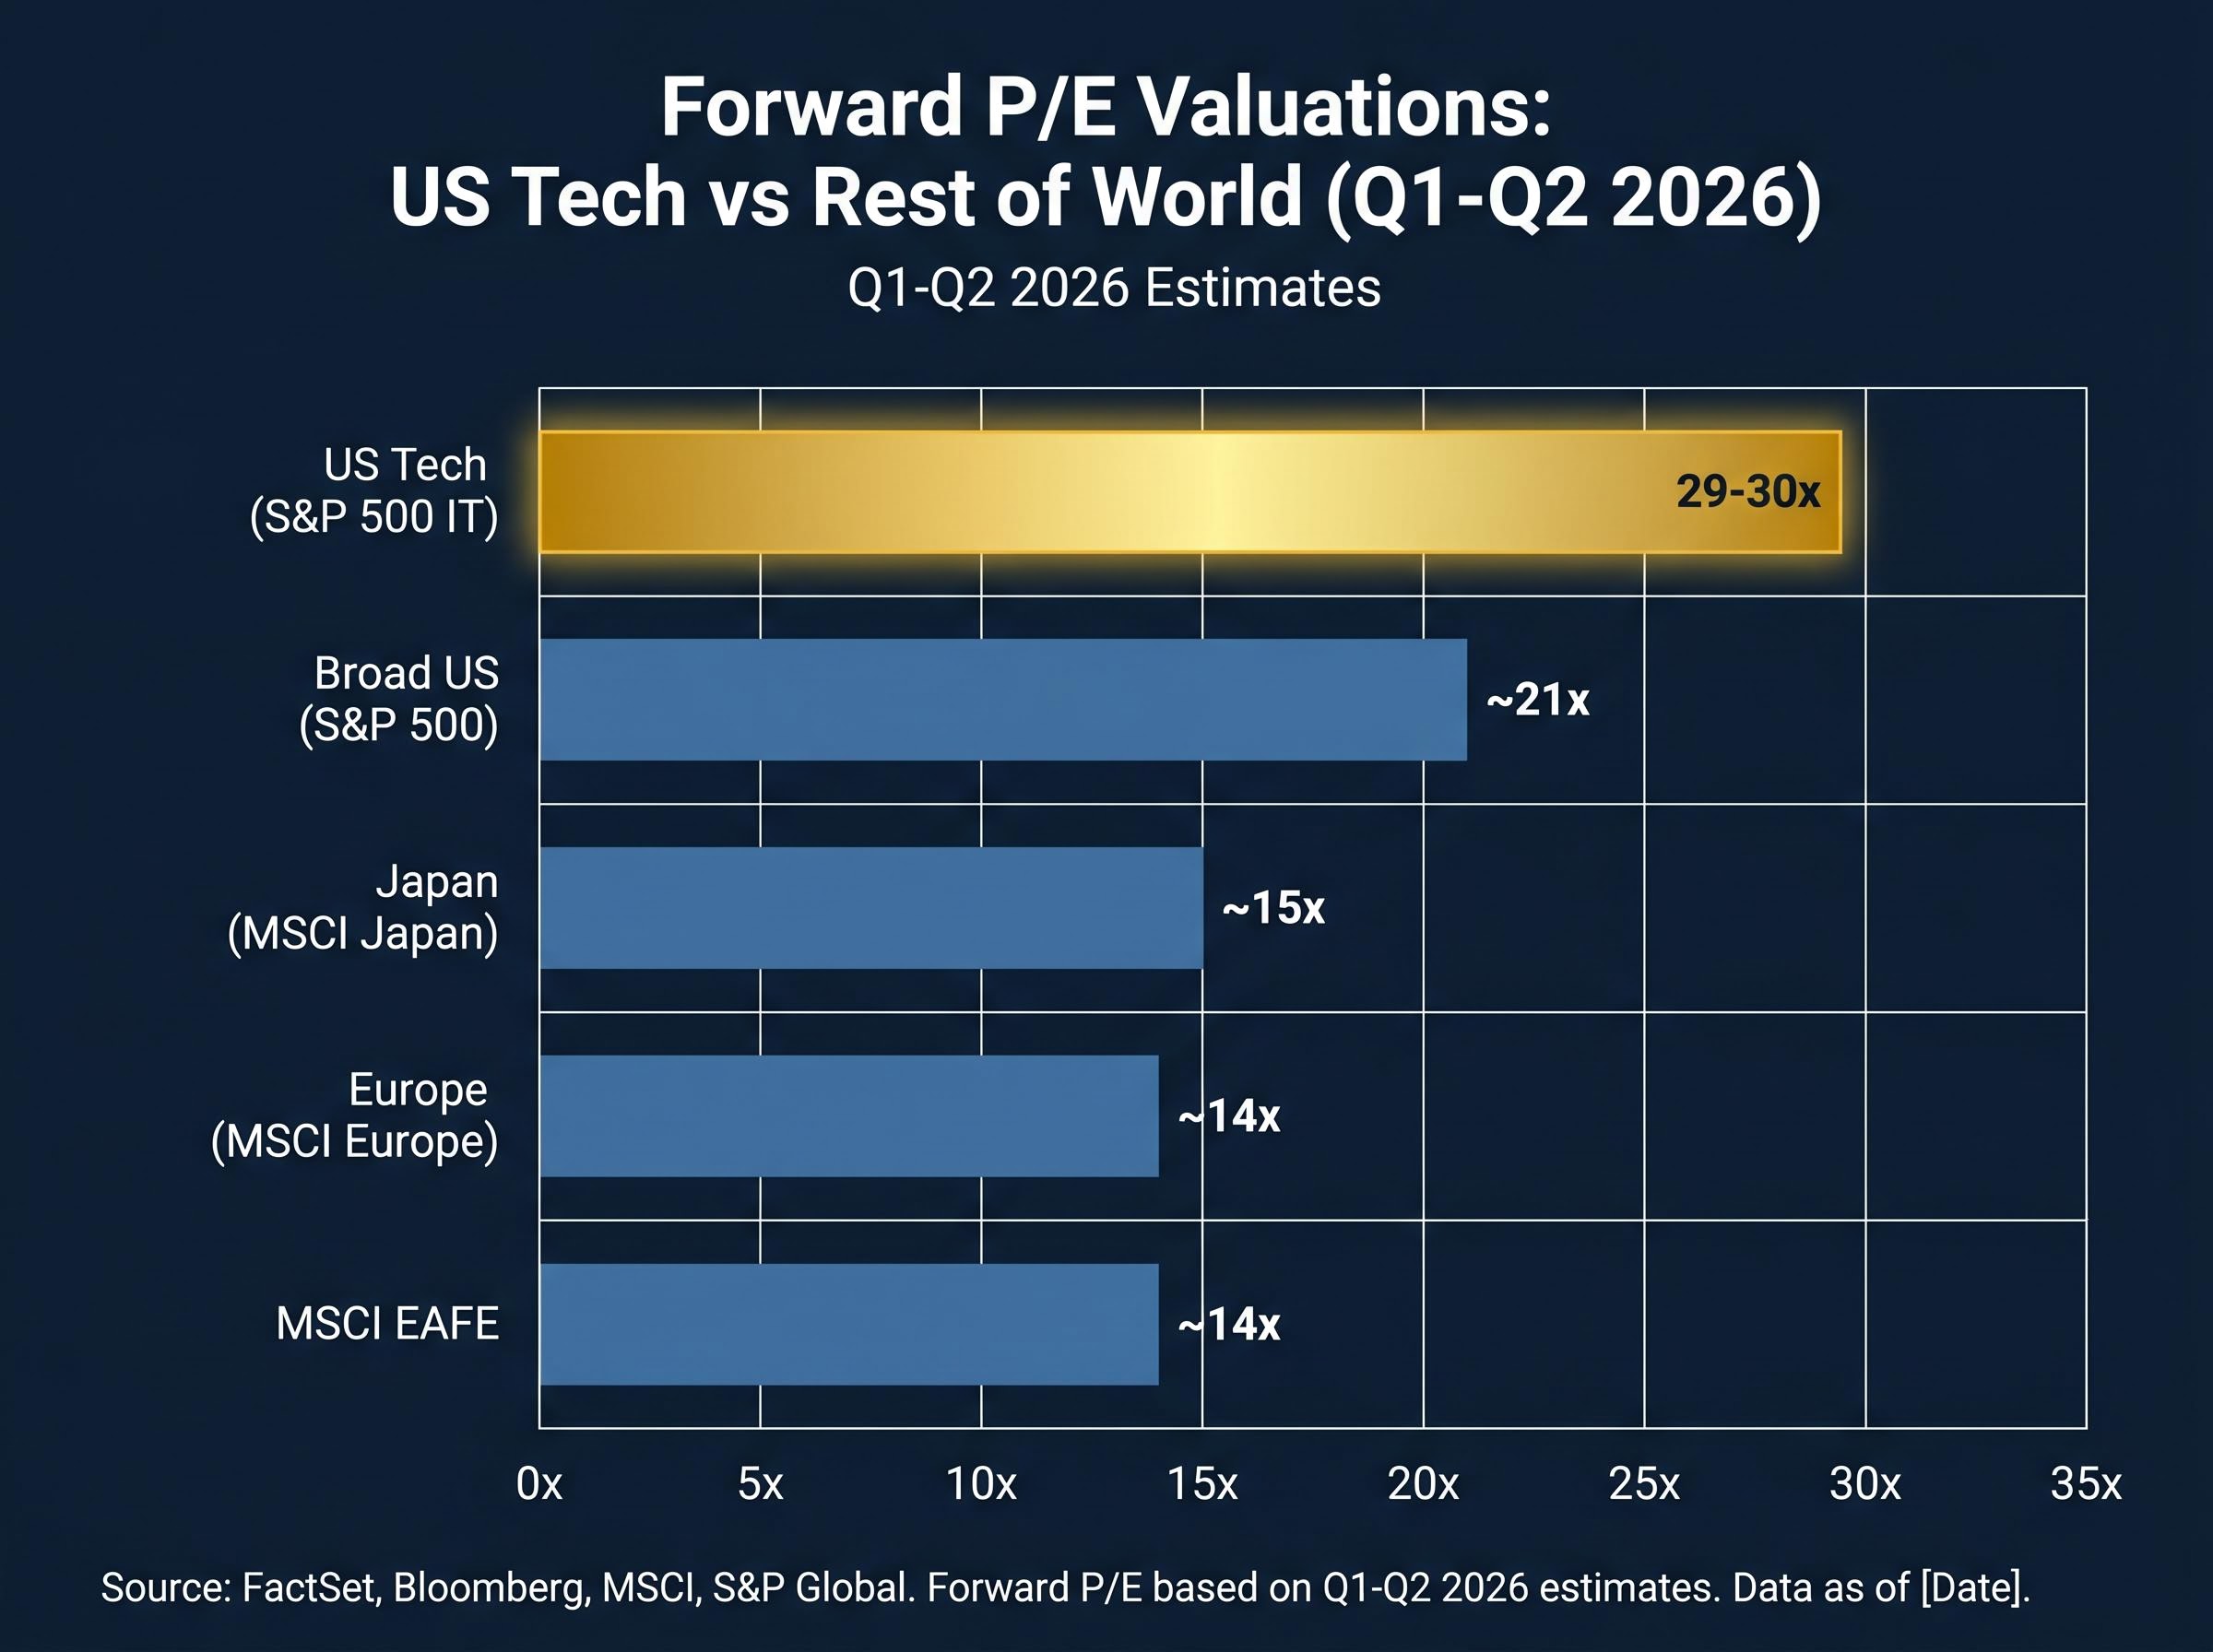
According to Schroders’ Duncan Lamont, the US versus developed ex-US CAPE spread of approximately 12 points is near the widest 10% of observations over the last 50 years. Robeco’s normalised P/E analysis estimates the US trades at approximately a 60% premium to Europe and a 45% premium to Japan.
What makes these spreads significant is not any single metric but their convergence. Forward P/E, Shiller CAPE, normalised P/E, and standard-deviation-from-mean analyses all point in the same direction. Valuation is not a timing tool, but over 10-year horizons it remains the most reliable predictor of forward returns available to investors.
The S&P 500 CAPE ratio analysis places current valuations among only three episodes in 155 years of market data where readings exceeded 40, a threshold that in prior cycles reliably preceded a decade of compressed returns rather than continued outperformance.
History’s verdict on extreme concentration: the decades that followed
Four episodes in the past half-century offer the closest structural parallels to where US mega-cap Tech sits today.
The Nifty Fifty era of the early 1970s saw a handful of US blue chips, Polaroid, Xerox, Avon, trade at extraordinary premiums on the thesis that quality companies deserved any price. The Nifty Fifty cohort underperformed the broad market over the subsequent decade as valuations mean-reverted while the neglected small-cap and international segments outperformed.
Japan Inc. in the late 1980s commanded a similar narrative of structural superiority. Japanese equities peaked at roughly 45% of global market capitalisation. The Nikkei then spent more than two decades recovering its 1989 high.
The TMT bubble of the late 1990s is the closest analogue in sector terms. According to the Wall Street Journal’s Jon Sindreu, the top 10 US stocks today exceed 35% of S&P 500 market capitalisation, surpassing levels seen in 2000. After the dot-com peak, leadership rotated decisively toward emerging markets, commodities, and value equities for the better part of a decade.
Index concentration risk compounds the valuation problem in ways that passive investors may be systematically underestimating: with the top five US companies controlling roughly 30% of total market capitalisation, a portfolio that feels diversified at the fund level can behave like a leveraged single-theme position when that theme corrects.
The 2006-2007 financials and commodities concentration preceded the global financial crisis, after which the dominant cohort, banks and resource companies, underperformed while US growth equities began their fifteen-year run.
According to BlackRock Investment Institute’s “Concentration Risk: Echoes of the Past” (September 2025), in each of the Nifty Fifty, Japan Inc., and TMT episodes, the dominant cohort’s forward 10-year annualised returns were approximately 3-5 percentage points lower than the broad global market. Unloved regions and sectors at the time often delivered superior returns.
Goldman Sachs Global Investment Research reached a complementary conclusion in its October 2025 report: each of the past four decades saw a different dominant sector or region, and after each period of extreme concentration, the leading group reverted to or below market returns over the following decade.
Historical precedent does not predict timing. But it does establish base rates. No prior episode of extreme concentration has sustained dominance over a subsequent decade. The question is not whether the pattern applies. It is whether the starting conditions, stretched valuations, crowded positioning, and narrative inevitability, are present. By the evidence assembled above, they are.
Where asymmetric upside may now sit: international and non-Tech developed markets
If high expectations structurally reduce the probability of positive surprise, low expectations do the opposite. And expectations for international developed markets are, by institutional consensus, low enough that even unremarkable outcomes could register as beats.
The specific opportunity areas where this asymmetry appears most visible include:
- European industrial and financial cyclicals, where valuations sit near multi-decade discounts and earnings revisions have begun improving
- Japanese large-caps, benefiting from corporate governance reform and foreign institutional inflows estimated at approximately 6.5 trillion yen in 2025, described by the Financial Times’ Leo Lewis as the highest since 2013
- Broad MSCI EAFE exposure, offering diversified access to the valuation discount without requiring single-country concentration
- Non-Tech US value equities, where the valuation spread against US growth is itself near historical extremes
JPMorgan Asset Management’s John Bilton, through the firm’s 2025 Long-Term Capital Market Assumptions, projects expected 10-15 year returns for the US as significantly lower than for Eurozone, UK, and Japanese equities, driven entirely by starting valuations.
The JPMorgan Long-Term Capital Market Assumptions, updated through the 2026 edition, project materially lower 10-15 year expected returns for US equities relative to Eurozone, UK, and Japanese markets, with starting valuations identified as the primary driver of the divergence.
BlackRock’s Wei Li has tilted the firm’s 2025 midyear outlook toward selected ex-US developed markets, preferring Japan and European industrial and financial cyclicals over US mega-cap Tech on a three-year horizon. Vanguard’s Investment Strategy Group has encouraged rebalancing toward global diversification, particularly developed ex-US equities.
The argument here does not require a bearish view on Tech. It does not require predicting a catalyst. It only requires accepting that the incremental dollar of capital may now earn more in markets where expectations are modest and valuations are forgiving, than in a market where perfection is already the baseline assumption.
This article is for informational purposes only and should not be considered financial advice. Investors should conduct their own research and consult with financial professionals before making investment decisions.
Sizing the rotation: what a portfolio reorientation looks like in practice
The breadth of institutional agreement on the rotation thesis is itself worth noting. BlackRock, Vanguard, JPMorgan, Goldman Sachs, Morgan Stanley, GMO, Research Affiliates, Bank of America, Schroders, and Robeco have all published directionally aligned views favouring a shift away from US Tech concentration and toward international developed and value equities. That degree of consensus across value-oriented, growth-oriented, and multi-asset managers is uncommon.
Yet aggregate fund flows tell a different story. According to Bank of America’s EPFR data, flows through 2025 remained heavily skewed toward US large-cap growth and Tech. Periodic rotation into European and Japanese equity funds occurred, but was described as modest relative to the scale of US-directed capital. Bank of America’s Michael Hartnett has characterised “long US Tech, short rest of the world” as the most crowded trade in the Global Fund Manager Survey.
The gap between what institutions are recommending and where capital is actually positioned implies the rotation trade is not crowded. For investors who became overweight US large-cap growth during the AI rally, the rebalancing question is not theoretical. It is structural.
Thinking about pace and proportion
Leadership rotation, across every historical episode, has been gradual and uneven. Investors who waited for a clear signal that the old leaders had definitively broken down typically missed the early compounding available from cheaper starting valuations.
Perfect timing is neither possible nor necessary. Starting valuations are the most reliable lever available. Investors do not need to identify the catalyst; they need to recognise when the risk-reward has shifted and position accordingly.
Even modest rebalancing, reducing US Tech overweights incrementally rather than wholesale, can significantly alter the expected return distribution over a 5-10 year horizon given current valuation spreads. The discipline is not dramatic reallocation. It is deliberate, measured adjustment toward the part of the global equity market where the maths favours patience.
Past performance does not guarantee future results. Financial projections are subject to market conditions and various risk factors.
Tech’s throne is not empty, but the seat next to it looks undervalued
The case for market leadership rotation is built on probability and valuation, not on a prediction that Tech will fail. The evidence chain runs in one direction: elevated sentiment has already been priced in, valuation spreads between US Tech and international developed markets are near multi-decade extremes, historical precedent shows no prior episode of extreme concentration sustaining dominance over the subsequent decade, and low expectations in Europe and Japan create a risk-reward profile where even mediocre outcomes can register as positive surprises.
Leadership transitions are gradual. They do not announce themselves with a single quarter’s results or a single macro event. The question for investors is not whether rotation will happen but whether their current allocation reflects a deliberate forward-looking view, or simply the passive accumulation of years of US Tech outperformance.
Reviewing geographic and sector concentration relative to global market weights is a starting point. For many portfolios, the answer to “why am I this overweight?” may simply be “because it kept working.” That is not a thesis. It is inertia. And in a market where expectations are this stretched, inertia carries a cost that valuation history suggests compounds quietly over the decade ahead.
—