
In February 2026, Morgan Stanley raised its earnings forecasts for the major Australian banks by 4%. Three months later, the broker reversed the call with a comparable reduction. That speed of reversal captures the problem facing Australian bank shares in May 2026: the macro environment shifted faster than the models could keep up.
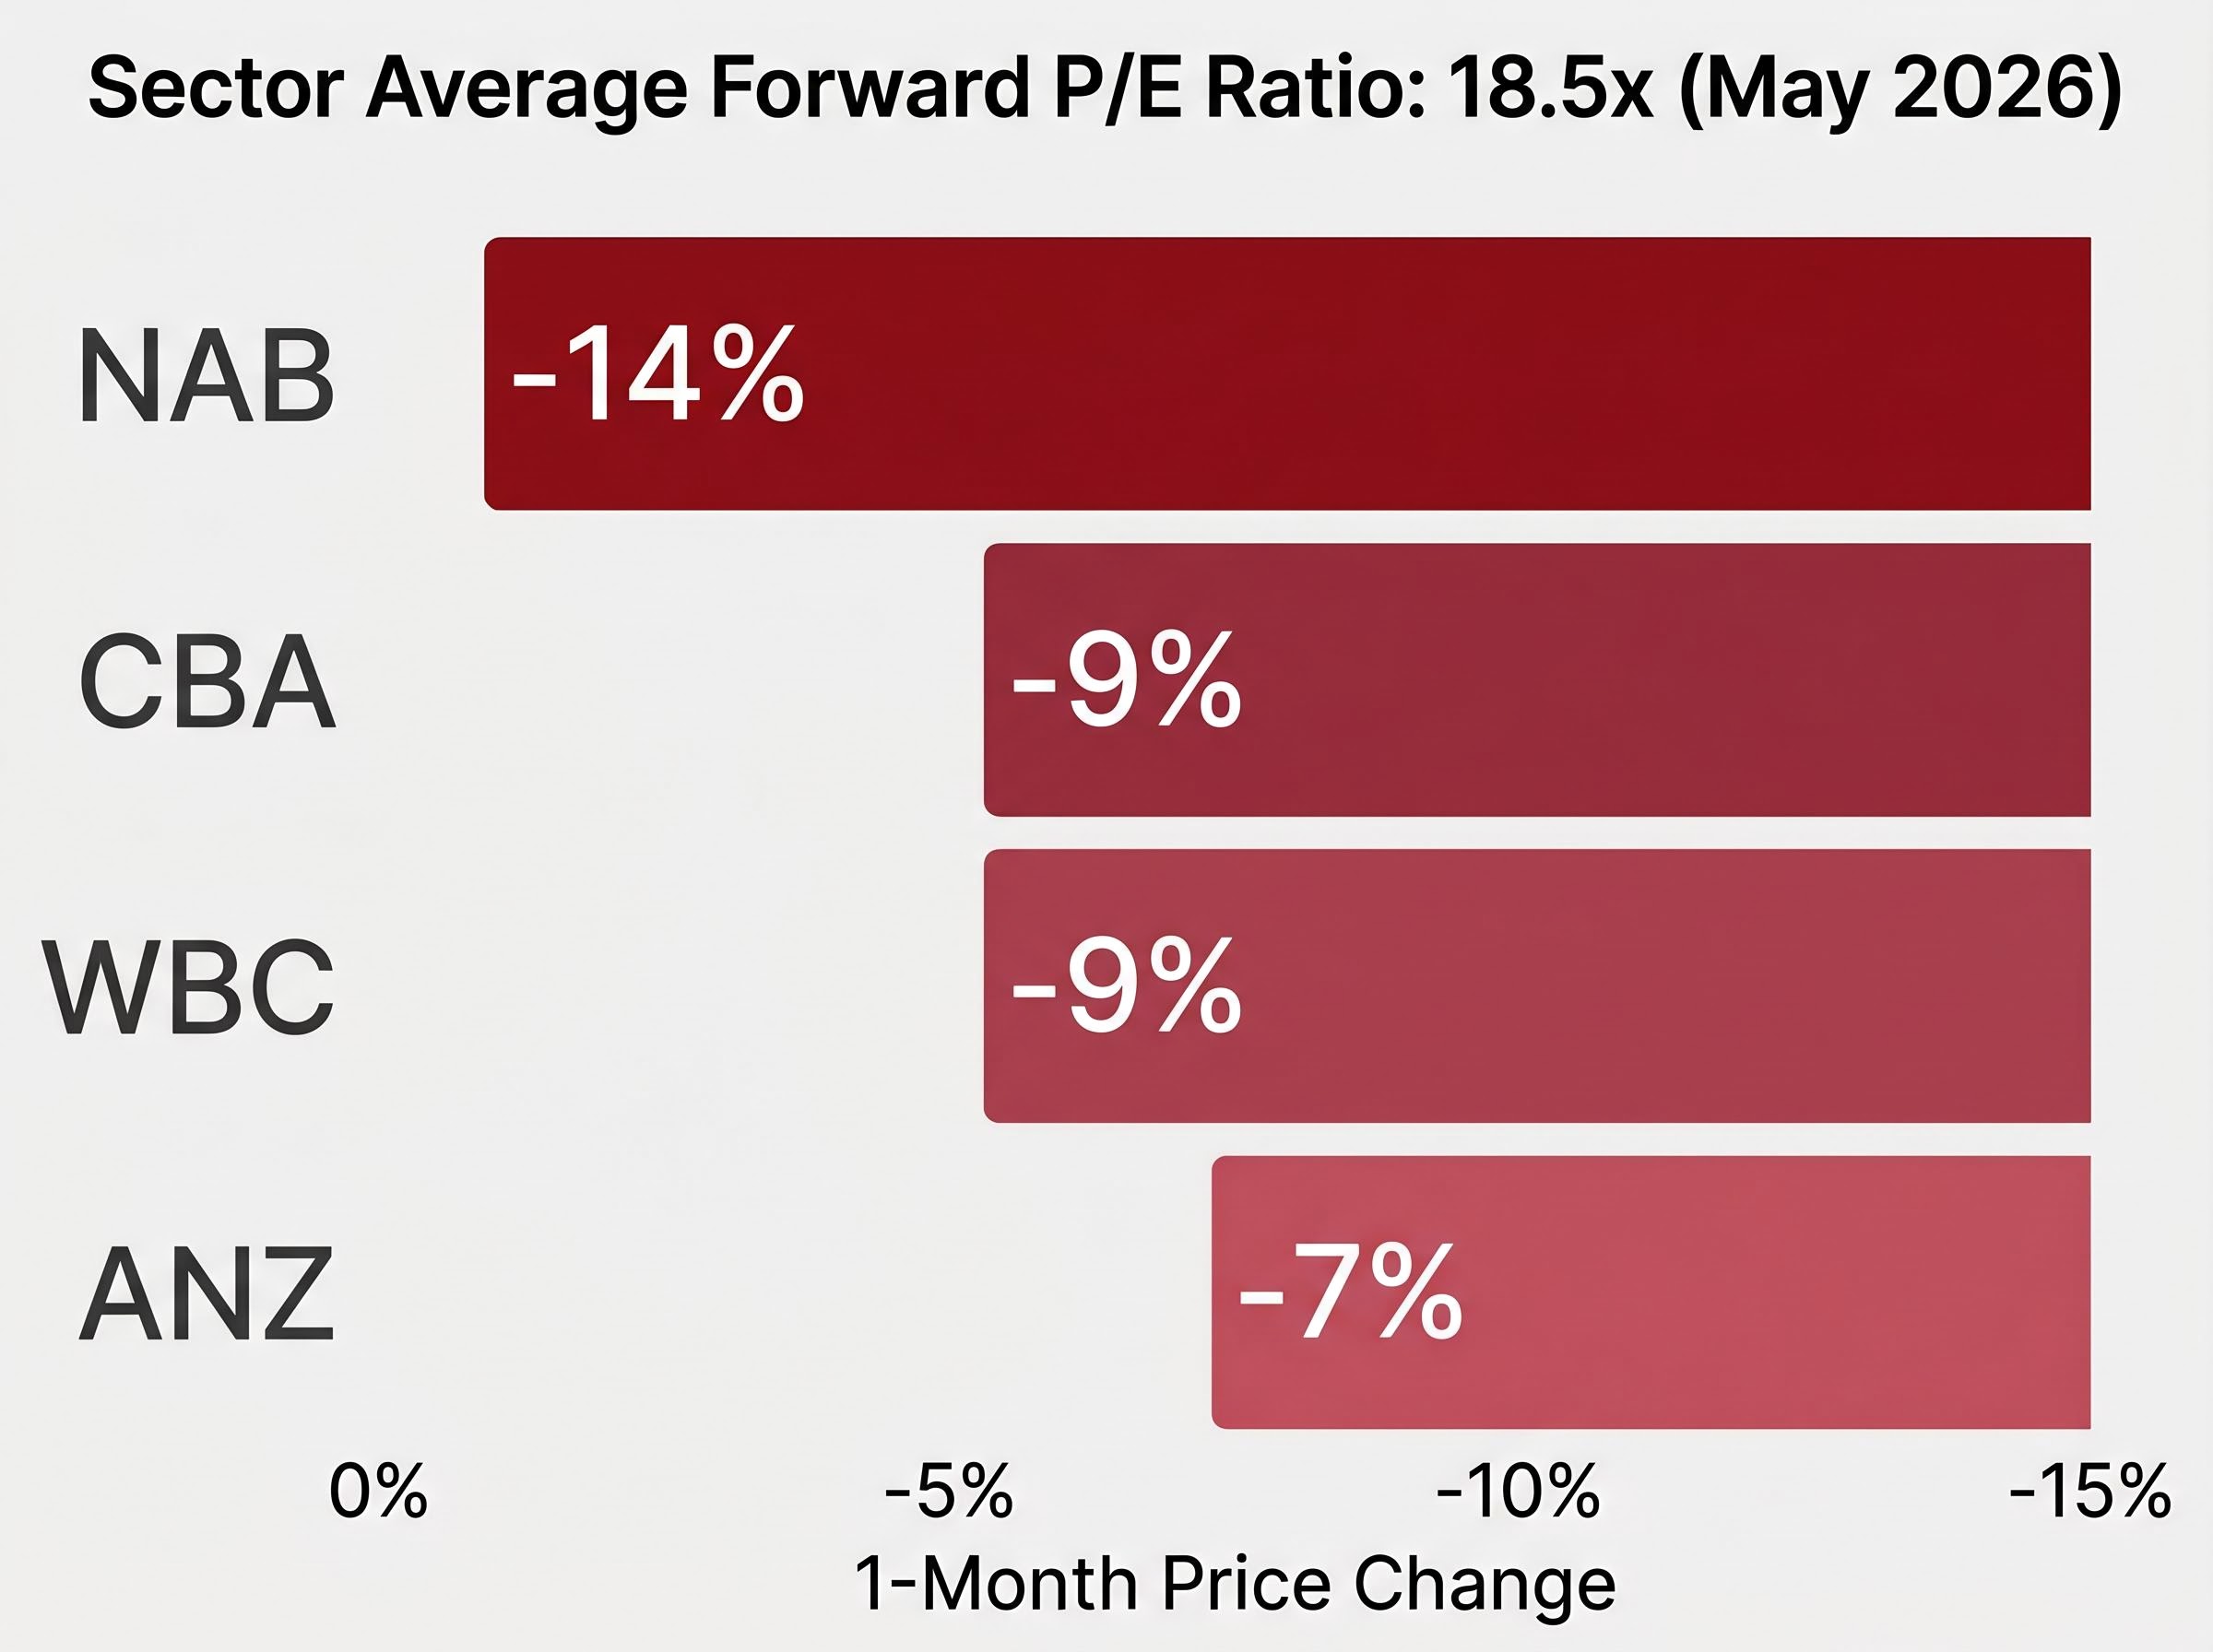
The sell-off across the sector has been broad and steep. Commonwealth Bank shares fell approximately 9% over the prior month, NAB dropped 14%, Westpac lost 9%, and ANZ declined 7%. The cause is not a single event but three concurrent macro pressures arriving together: an RBA rate-hiking sequence that returned the cash rate to 4.35%, proposed federal budget property measures, and a global energy price shock compressing household cash flows.
This analysis explains the mechanism behind the movement. Each macro force transmits into bank earnings through a specific channel, and understanding those channels equips investors to interpret future sector developments rather than react to headlines after the damage is priced.
Three rate hikes in four months: what the RBA’s 2026 pivot means for bank earnings
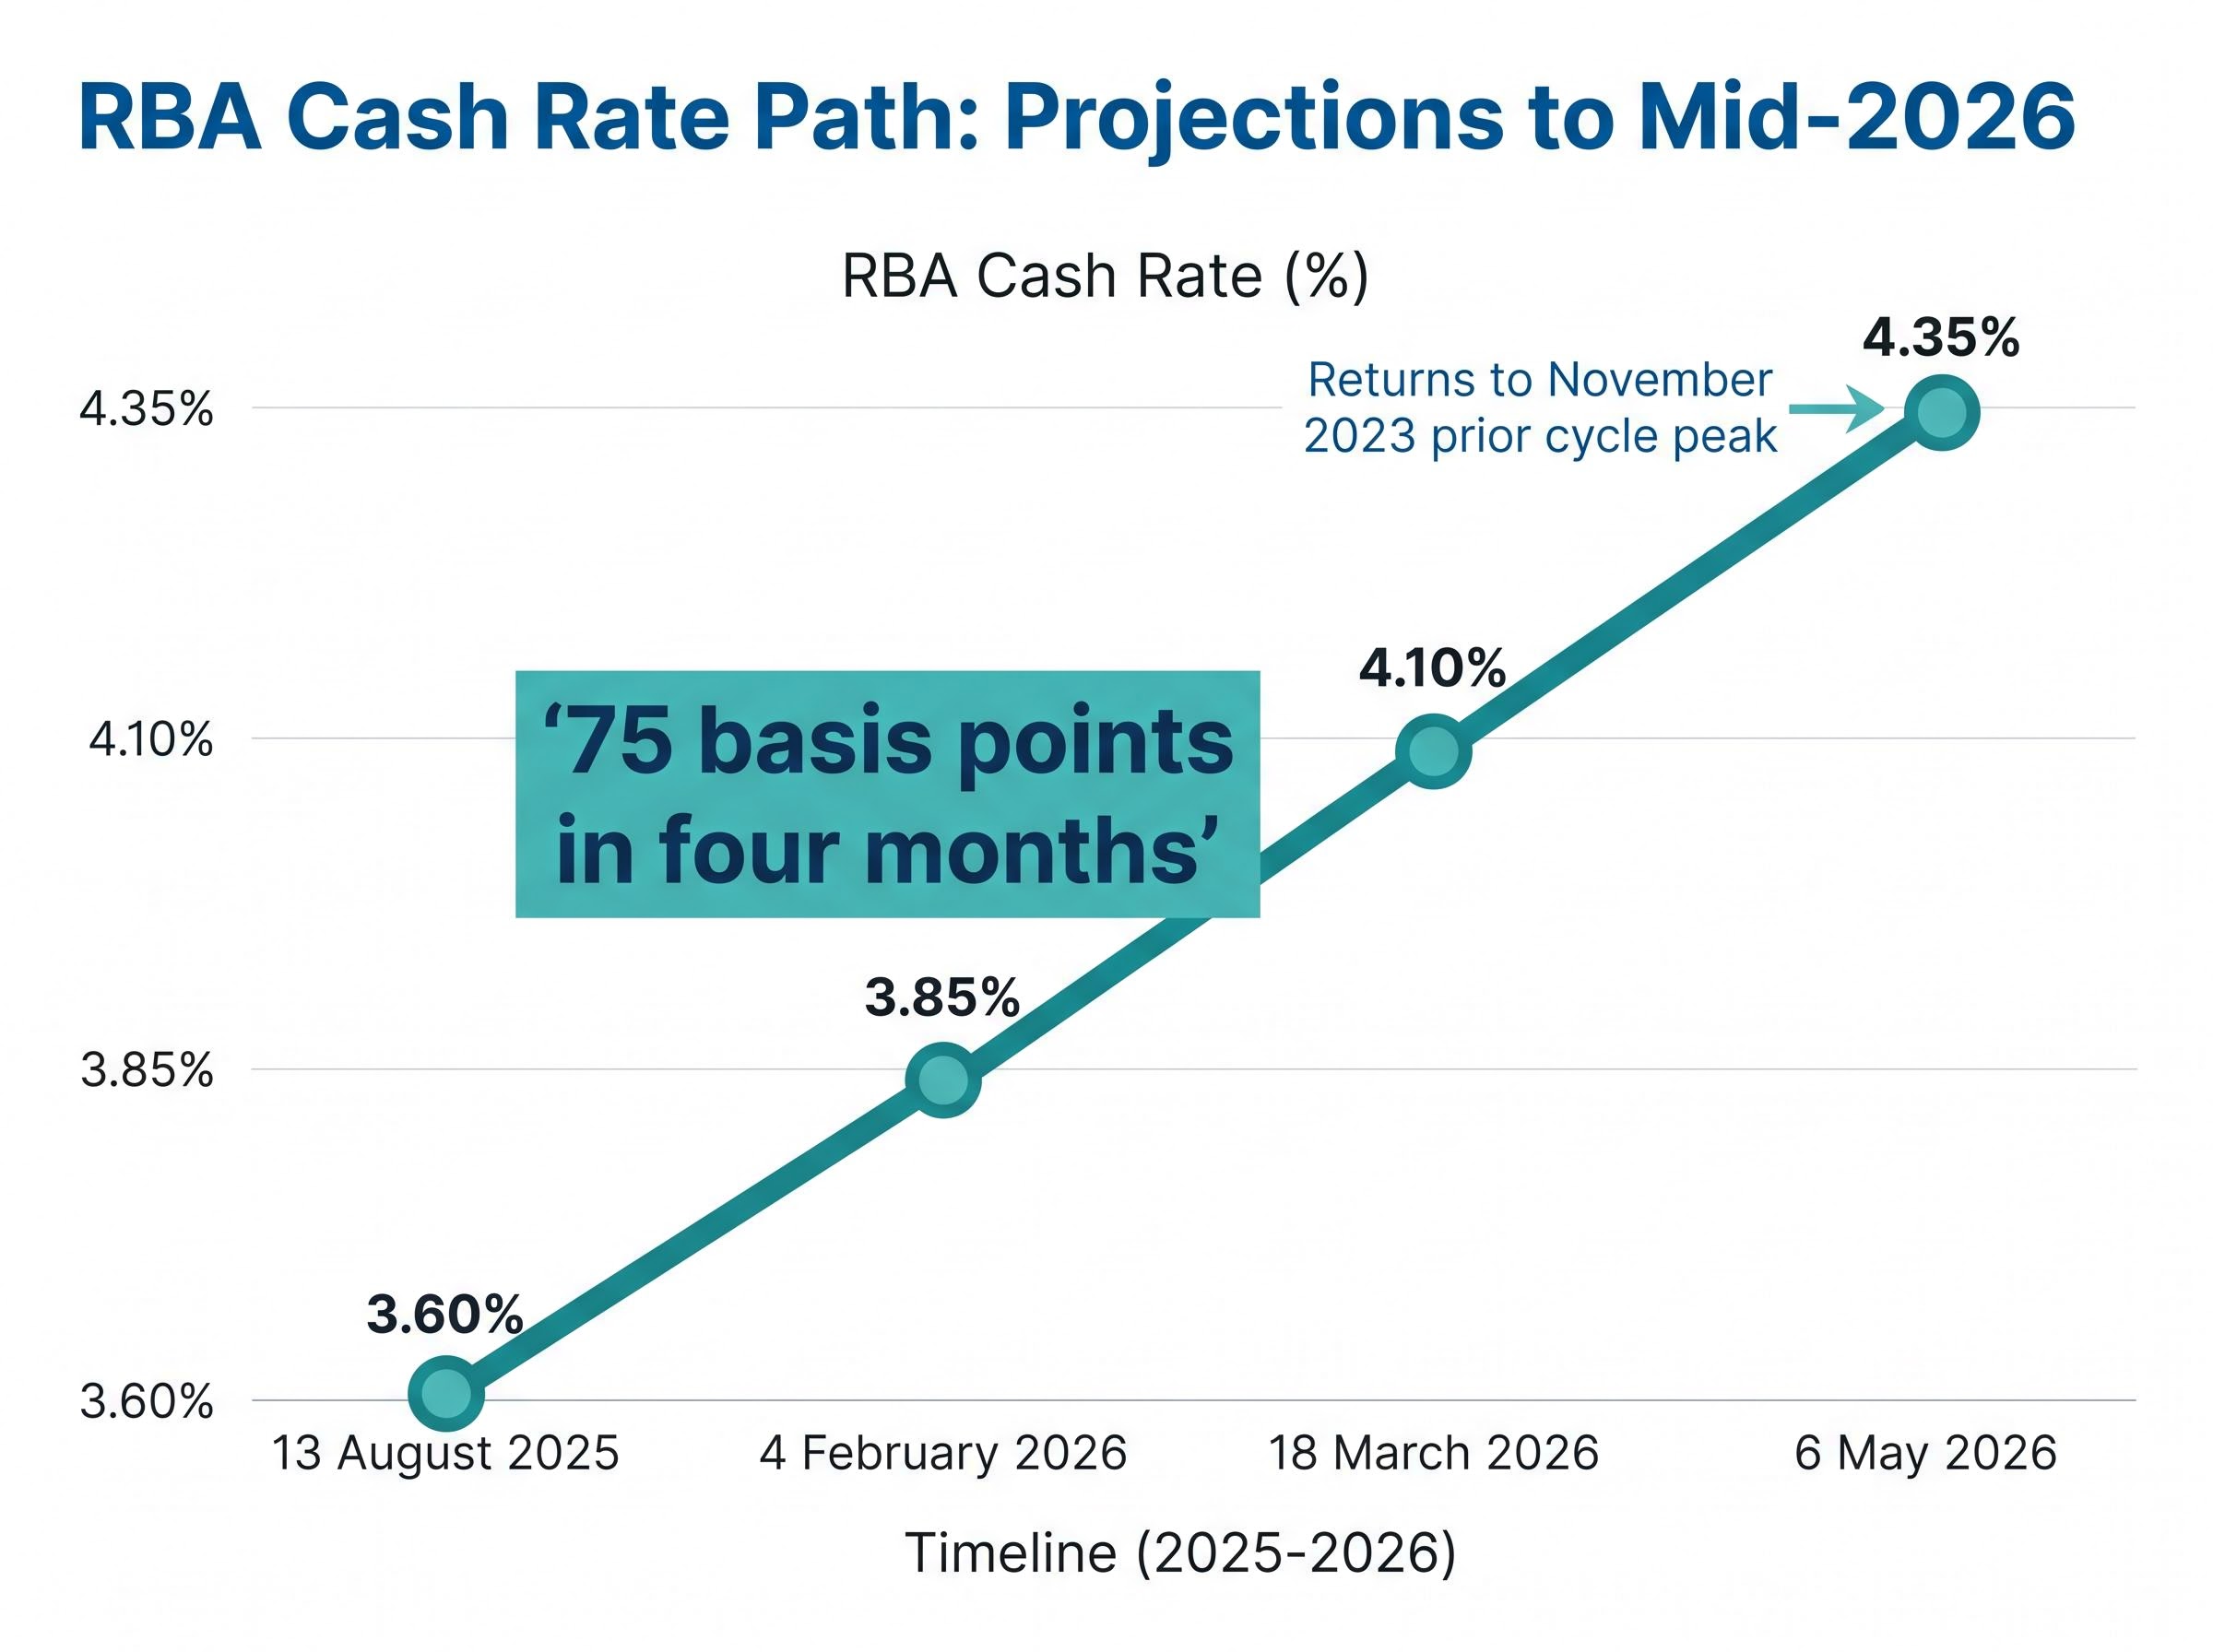
The RBA had been cutting. The cash rate reached 3.60% on 13 August 2025, and the consensus view was that monetary policy was easing toward a cycle trough. Then inflation data forced a reversal that few had modelled:
- 4 February 2026: +25 basis points to 3.85%
- 18 March 2026: +25 basis points to 4.10%
- 6 May 2026: +25 basis points to 4.35%
Three hikes across four months, returning the cash rate to its prior cycle peak from November 2023.
The RBA rate divergence from peers adds a currency and capital flow dimension that purely domestic analysis misses: while the Fed, ECB, and Bank of England all held rates steady in the same week as the 6 May hike, Australia’s cash rate sat up to 235 basis points above comparable developed-market benchmarks, an asymmetry that shapes foreign investor appetite for Australian bank equity and debt.
The instinct among many investors is that higher rates help banks. In the early stages of a tightening cycle, they can: the gap between what banks charge borrowers and what they pay depositors widens, lifting net interest margins. But speed matters. When rates rise this quickly, deposit competition intensifies as savers demand higher returns, and wholesale funding costs climb in parallel. Net interest margins in the most recent reporting season came in below market expectations, confirming that the compression arrived faster than the expansion.
BIS analysis of monetary tightening and bank margins confirms that the speed of a hiking cycle, not just its magnitude, is the key determinant of whether net interest margin expansion materialises, with rapid sequences generating deposit repricing pressure that erodes the margin benefit before it can flow through to profit.
Morgan Stanley’s about-face on bank earnings: A 4% upgrade to earnings forecasts in February 2026 was reversed by a comparable 4% reduction by May 2026, illustrating how rapidly the re-hiking sequence turned from a tailwind to a headwind.
The speed of the sequence, 75 basis points across four months, gave bank treasuries insufficient time to reprice their deposit and funding books. The margin benefit of higher rates was consumed before it could flow through to profit.
When big ASX news breaks, our subscribers know first
How macro shocks move through the economy and into bank balance sheets
Understanding why bank stocks react so sharply to macro shifts requires tracing the chain of cause and effect from the initial shock to the earnings line.
The transmission works in five steps:
- An external macro shock (rate rise, energy cost increase, tax change) raises household costs
- Higher costs squeeze household cash flow, particularly for borrowers with high debt and limited buffers
- Cash-flow pressure raises the probability of missed loan repayments
- Banks must increase loan loss provisions to account for that rising probability
- Higher provisions compress net profit, even if arrears have not yet materialised in the data
That final point is worth pausing on. Accounting standards require banks to provision for expected losses, not just realised ones. Deteriorating macro conditions show up in earnings before the arrears data confirms the stress. The four major banks collectively allocated approximately $800 million in additional loan loss provisions during the most recent reporting season; that figure reflects management judgment about future losses, not a backward-looking tally.
Household stress indicators tracked across the broader economy, including a 70-year low in consumer confidence, approximately 12,000 corporate insolvencies in 2025, and real wage declines of around 0.3%, provide the macroeconomic context within which bank provisioning decisions are made; those figures explain why management teams are building loss reserves forward of hard arrears data rather than waiting for the numbers to confirm the pressure.
Two earnings levers under simultaneous pressure
Two distinct components of a bank’s profit and loss statement absorb macro stress. Net interest margin (the difference between lending income and funding costs) sits on the revenue side. Loan impairment charges sit on the cost side. The current environment is unusual because both are under pressure at the same time: margins compressed by the speed of re-hiking, and provisions rising as household cash-flow conditions deteriorate.
RBA analysis from the Financial Stability Review (October 2023) found that a material minority of variable-rate owner-occupiers face negative cash flow under higher-rate scenarios. At that time, approximately 70% of borrowers held prepayment buffers of at least three months of scheduled repayments. A re-hiking sequence that returns rates to 4.35% after only a brief period of relief at 3.60% tests how much of that buffer remains intact.
The budget and energy shock: two additional forces pressing on household borrowers
The rate hikes alone would constitute a material headwind. The problem for the banks is that two additional macro forces arrived in the same window, amplifying the same cash-flow channel that rate increases were already compressing.
Proposed federal budget property measures introduce an unusual variable for lenders to model. Housing taxation in Australia has historically remained a state-level domain: stamp duty and state land tax have dominated, and federal intervention in property taxation has been structurally limited. Any federal move into this space represents an additional drag on mortgage credit demand if property-related costs rise for investors or owner-occupiers. Lower credit demand and downward pressure on property prices affect the volume and quality of the banks’ mortgage books, their largest asset class.
The energy price shock operates through a different but parallel channel. Higher energy bills are non-discretionary: households cannot defer them in the way they might cut dining or travel spending. RBA analysis has consistently shown that energy and fuel price increases contribute to non-discretionary inflation, which limits households’ ability to adjust spending and raises the sensitivity of mortgage holders to concurrent rate increases. In the September quarter 2022, retail electricity prices rose approximately 15% as wholesale costs fed through. A repeat of that transmission scale in the current environment compounds the pressure the rate hikes are already producing.
According to Morgan Stanley’s May 2026 commentary, all three pressures (rate hikes, budget measures, and the energy shock) were cited as simultaneous headwinds for the banking sector.
| Macro Force | Channel of Impact | Bank Earnings Effect |
|---|---|---|
| RBA rate hikes (75 bp in four months) | Deposit competition and funding costs rise faster than lending repricing | Net interest margin compression |
| Federal budget property measures | Potential drag on mortgage credit demand and property values | Lower loan growth; collateral quality risk |
| Energy price shock | Non-discretionary cost increase squeezes borrower cash flow | Higher provisioning as arrears risk rises |
What the reporting season revealed: margins, provisions, and dividends under pressure
The theoretical framework built across the preceding sections finds direct confirmation in the most recent bank results. Three specific earnings quality signals emerged:
- Net interest margins underperformed market expectations across the sector, consistent with the funding cost compression the re-hiking sequence was expected to produce
- Capital adequacy results at CBA and NAB came in below market forecasts, signalling less balance-sheet headroom than investors had assumed
- Dividend guidance shifted toward midpoint rather than upper-end payout ratios at three of the four major banks, a signal that management teams expect earnings headroom to narrow
That third point carries particular weight for valuation. Much of the premium multiple that Australian bank shares have commanded in recent years rests on the expectation of stable and growing dividends. When management teams signal payout reversion, the dividend-growth premium that supports high price-to-earnings ratios erodes.
NAB’s actions went further than guidance. The bank raised approximately $1.8 billion in equity capital via its dividend reinvestment plan, a move that is dilutive to existing shareholders and typically precedes periods of elevated provisioning or capital uncertainty.
Morgan Stanley’s sector ranking as of May 2026: ANZ first, followed by Westpac, NAB, and CBA last. NAB and Westpac received the steepest earnings forecast reductions in the broker’s revision.
The ranking reflects a clear differentiation: the banks with the least capital pressure and the most resilient margin profiles are preferred, while those trading at the highest multiples with the weakest earnings momentum sit at the bottom.
Valuation at 18.5 times forward earnings: is the price of safety still justified?
The four major banks traded at an average forward price-to-earnings ratio of approximately 18.5 times as of May 2026. That multiple was built during a period of earnings stability, reliable dividends, and investor preference for defensive yield. The question is whether the earnings base underneath that multiple still justifies the price.
If earnings per share forecasts are being cut (and Morgan Stanley assessed that further consensus reductions are likely following the subdued reporting season), a flat or rising price-to-earnings ratio implies investors are paying more per dollar of increasingly uncertain earnings. This is how price-to-earnings compression works in practice: as earnings risk rises, investors typically demand a lower multiple to compensate, and the multiple contraction itself becomes an additional source of share price downside beyond any earnings decline.
The macro assumptions beneath bank valuations are more sensitive to input changes than most investors appreciate: modest shifts in unemployment or property price trajectories can move a NAB fair value estimate from $19.00 to $85.50 across a plausible range of inputs, which is precisely why the current environment, with unemployment at 4.3% and rising and Sydney and Melbourne prices declining, produces such wide uncertainty around the 18.5x sector multiple.
CBA sits at the most exposed end of this dynamic. Its market capitalisation of approximately $270.65 billion makes it the most expensive bank by the widest margin, with shares down approximately 6% over the prior 12 months and approximately 9% over the prior month.
| Bank | 1-Month Price Change | 12-Month Price Change | YTD 2026 Change |
|---|---|---|---|
| CBA | -9% | -6% | Negative |
| WBC | -9% | Moderate decline | Negative |
| NAB | -14% | Moderate decline | Negative |
| ANZ | -7% | +22% | -3% |
For the 18.5x multiple to be sustained, three conditions would need to hold:
- Earnings per share forecasts stabilise at or near current levels
- Loan loss provisioning peaks and begins to decline
- Credit quality does not deteriorate further from current arrears trends
Each of those conditions is currently uncertain.
The next major ASX story will hit our subscribers first
What comes next for Australian bank stocks as the macro storm continues
The analysis above is retrospective. Converting it into an ongoing monitoring framework requires identifying the three leading indicators that will determine whether macro pressure on the sector is intensifying or stabilising:
- RBA forward guidance on the rate path: The RBA’s own prior language, “not ruling anything in or out” with dependency on inflation and labour market data, means the cash rate at 4.35% could represent a new terminal rate or an interim level. Clarity on direction will directly affect margin expectations.
- APRA arrears data: The next quarterly ADI performance release will provide the first hard evidence of whether the re-hiking sequence has pushed arrears above the mild upward drift observed through 2023-24. A step-change in arrears would accelerate provisioning timelines.
- Budget measure clarifications from Treasury: The specific design and implementation timeline of federal property measures will determine whether the credit demand impact is marginal or material.
APRA quarterly ADI performance statistics covering December 2025 provide the most recent official data on loan arrears, capital adequacy, and net interest margins across the major banks, forming the regulatory baseline against which the current reporting season deterioration is measured.
The banks remain profitable and systemically important. Their dominance of Australian mortgage and business lending is not in question. What is in question is the pace of earnings normalisation: whether the current price-to-earnings compression marks the beginning or the middle of a re-rating depends on the data arriving across the three channels identified above.
Morgan Stanley’s view that consensus earnings per share forecasts will decline further adds weight to the case that this adjustment has not fully played out.
For readers wanting to understand whether the macro storm facing the banks reflects a temporary tightening cycle or a more structural deterioration in Australian economic conditions, our full explainer on Australia’s recession risk and stagflation signals examines the consumer confidence collapse to 1973 lows, record corporate insolvencies, and the capacity utilisation data pointing to unemployment above 5%, alongside the specific conditions under which a formal recession classification becomes likely.
The storm is real, but the permanence is not settled
The May 2026 pressure on Australian bank shares is the product of three simultaneous macro forces compressing earnings from multiple directions: a rapid rate-hiking sequence, proposed federal budget property measures, and an energy price shock. This is not a single reversible event.
The sector’s structural strengths, dominant market positions, systemic importance, and historically strong profitability, remain intact. Those strengths do not, however, negate the specific valuation and earnings risk that a 18.5x forward multiple on deteriorating earnings represents. Premium valuations require premium earnings visibility, and 2026 has so far delivered the opposite.
Investors should watch two proximate data points closely: the RBA’s June 2026 rate decision and the next APRA quarterly ADI performance release. Together, they will provide the clearest early signal of whether the macro storm is intensifying or beginning to abate.
This article is for informational purposes only and should not be considered financial advice. Investors should conduct their own research and consult with financial professionals before making investment decisions. Past performance does not guarantee future results. Financial projections are subject to market conditions and various risk factors.