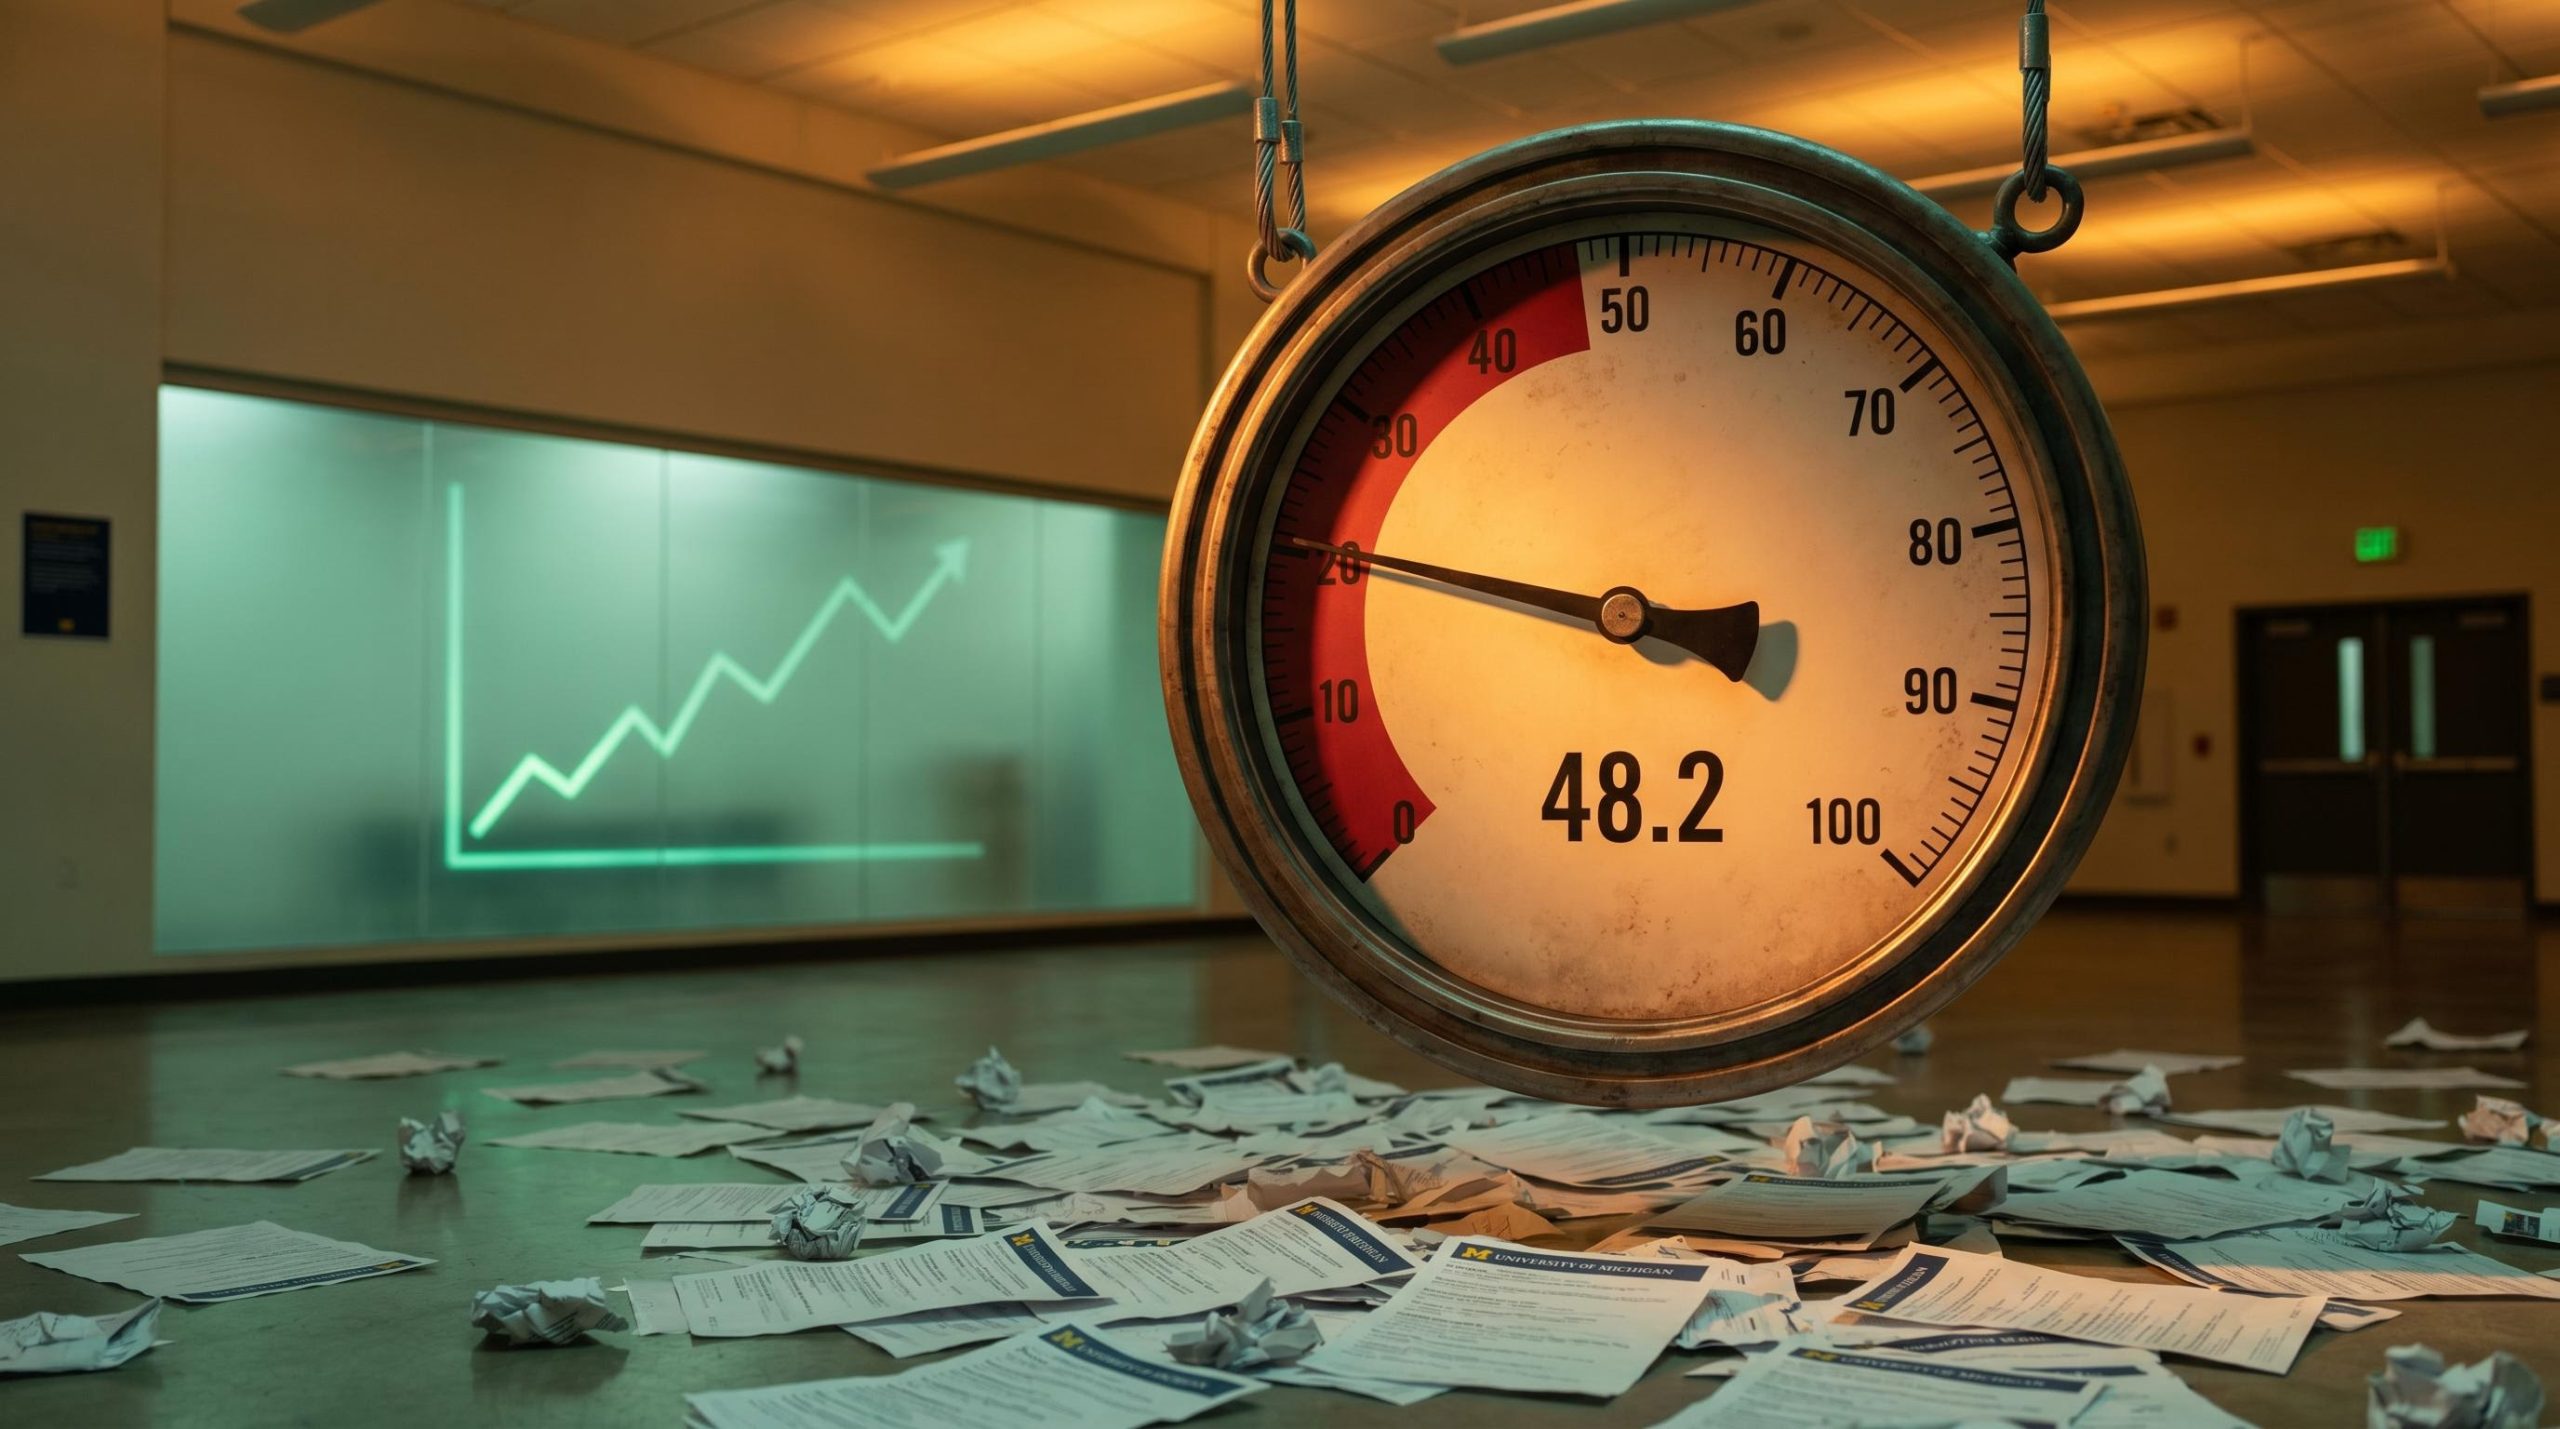
The University of Michigan Consumer Sentiment Index hit 48.2 in its preliminary May 2026 reading, released on 8 May 2026. That figure represents the lowest level since the survey began in 1952, breaking a record that had stood for less than a month. Financial media treated the number as a recession warning. The question worth asking is whether the historical record supports that interpretation, or whether the headline is telling investors something quite different from what it appears to say. What follows is an examination of what the hard data actually show right now, what the sentiment index actually measures, how it has behaved at previous extremes, what structural distortions are inflating the current reading, and which concrete indicators carry more weight for assessing economic risk.
A record low that looks alarming on the surface
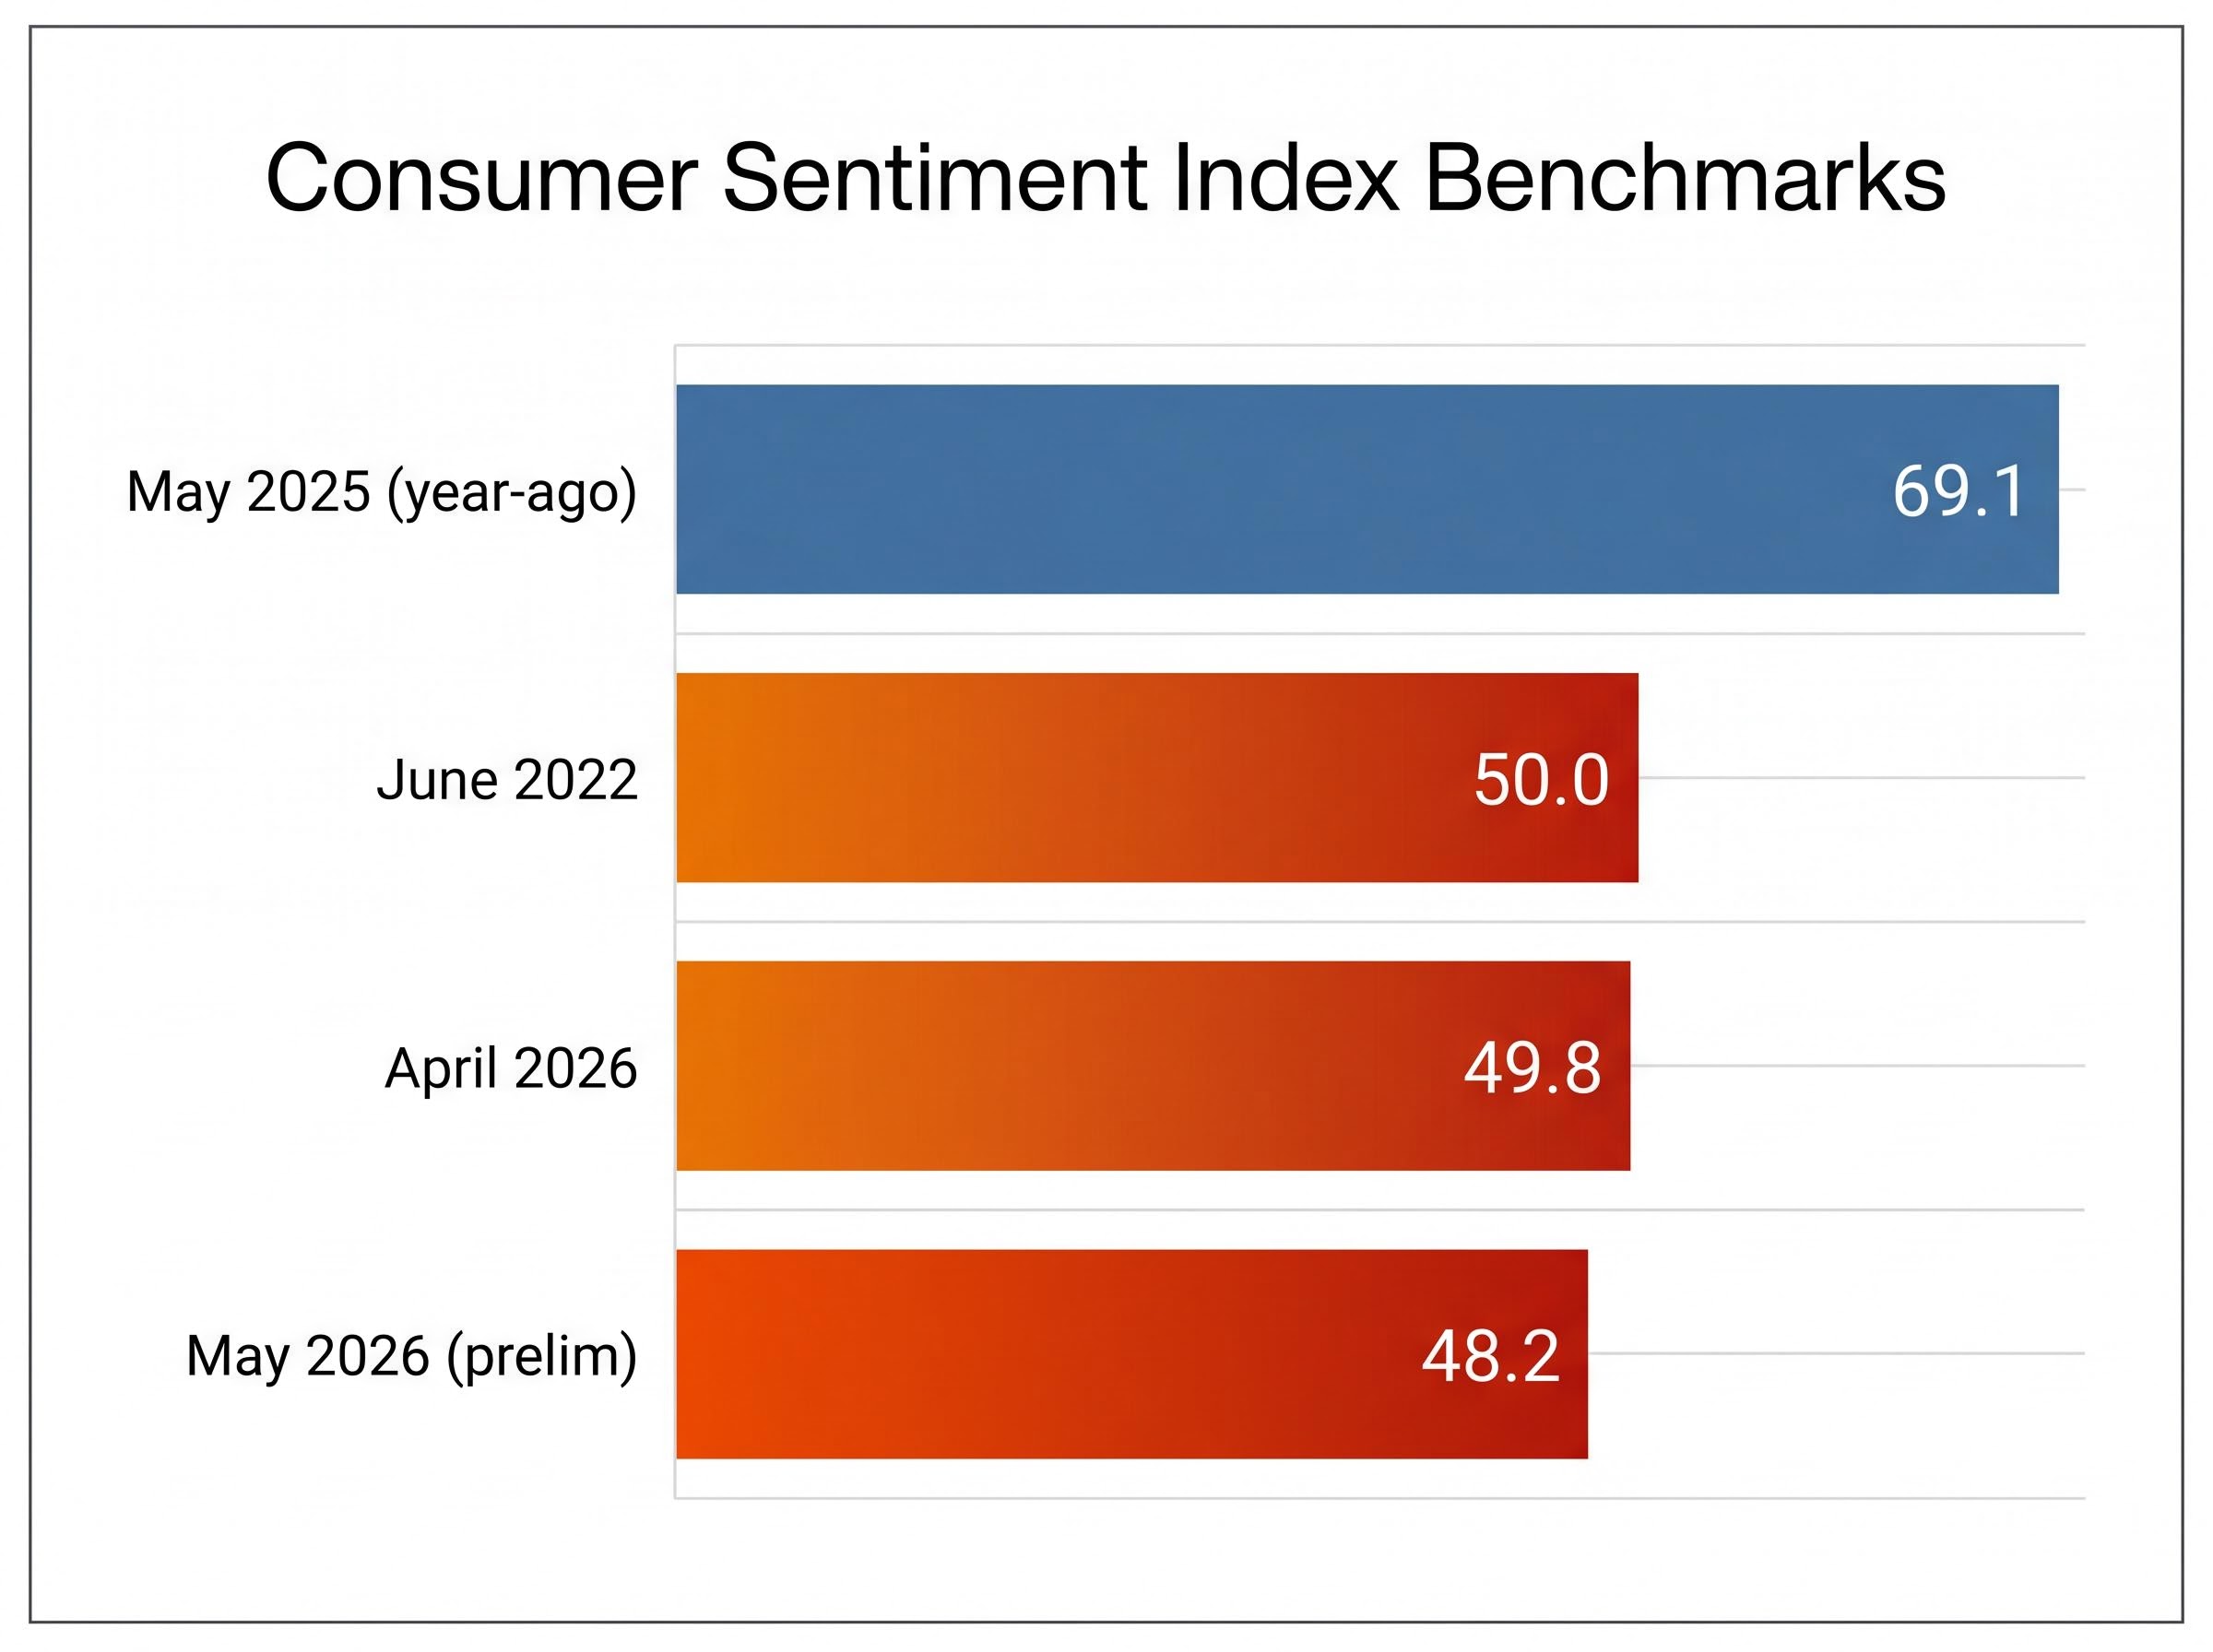
The scale of the decline is real. The May 2026 preliminary reading of 48.2 broke April 2026’s then-record of 49.8, which itself had only just eclipsed the June 2022 mark of 50.0. Three records in three months.
Both components of the index are deep in negative territory. The Current Economic Conditions sub-index registered 47.8; the Expectations sub-index came in at 48.5. University of Michigan director commentary cited surging gasoline prices and tariff concerns as the primary drivers.
| Benchmark | Reading |
|---|---|
| June 2022 (previous record) | 50.0 |
| April 2026 (prior record) | 49.8 |
| May 2025 (year-ago level) | 69.1 |
| May 2026 preliminary | 48.2 |
The year-on-year deterioration is stark: from 69.1 in May 2025 to 48.2 in May 2026, a decline of nearly 21 points in twelve months.
The University of Michigan’s final May 2026 reading is scheduled for release on 22 May 2026. Until then, the preliminary figure is the data point markets are pricing.
When big ASX news breaks, our subscribers know first
What the hard data actually show right now
The most recent comprehensive picture of household financial conditions comes from the New York Fed’s Q4 2024 Household Debt and Credit Report, published on 18 February 2025. The key figures:
- Total household debt: $17.5 trillion
- Overall delinquency rate (30+ days): 3.7%
- Credit card serious delinquency transition rate (90+ days): 9.7%
- Auto loan serious delinquency transition rate: 3.4%
Credit card and auto delinquencies have been rising, particularly among younger borrowers. That is genuine stress in a specific segment. But aggregate household balance sheets remain supported by low unemployment and rising incomes. The stress is concentrated, not distributed evenly across the population.
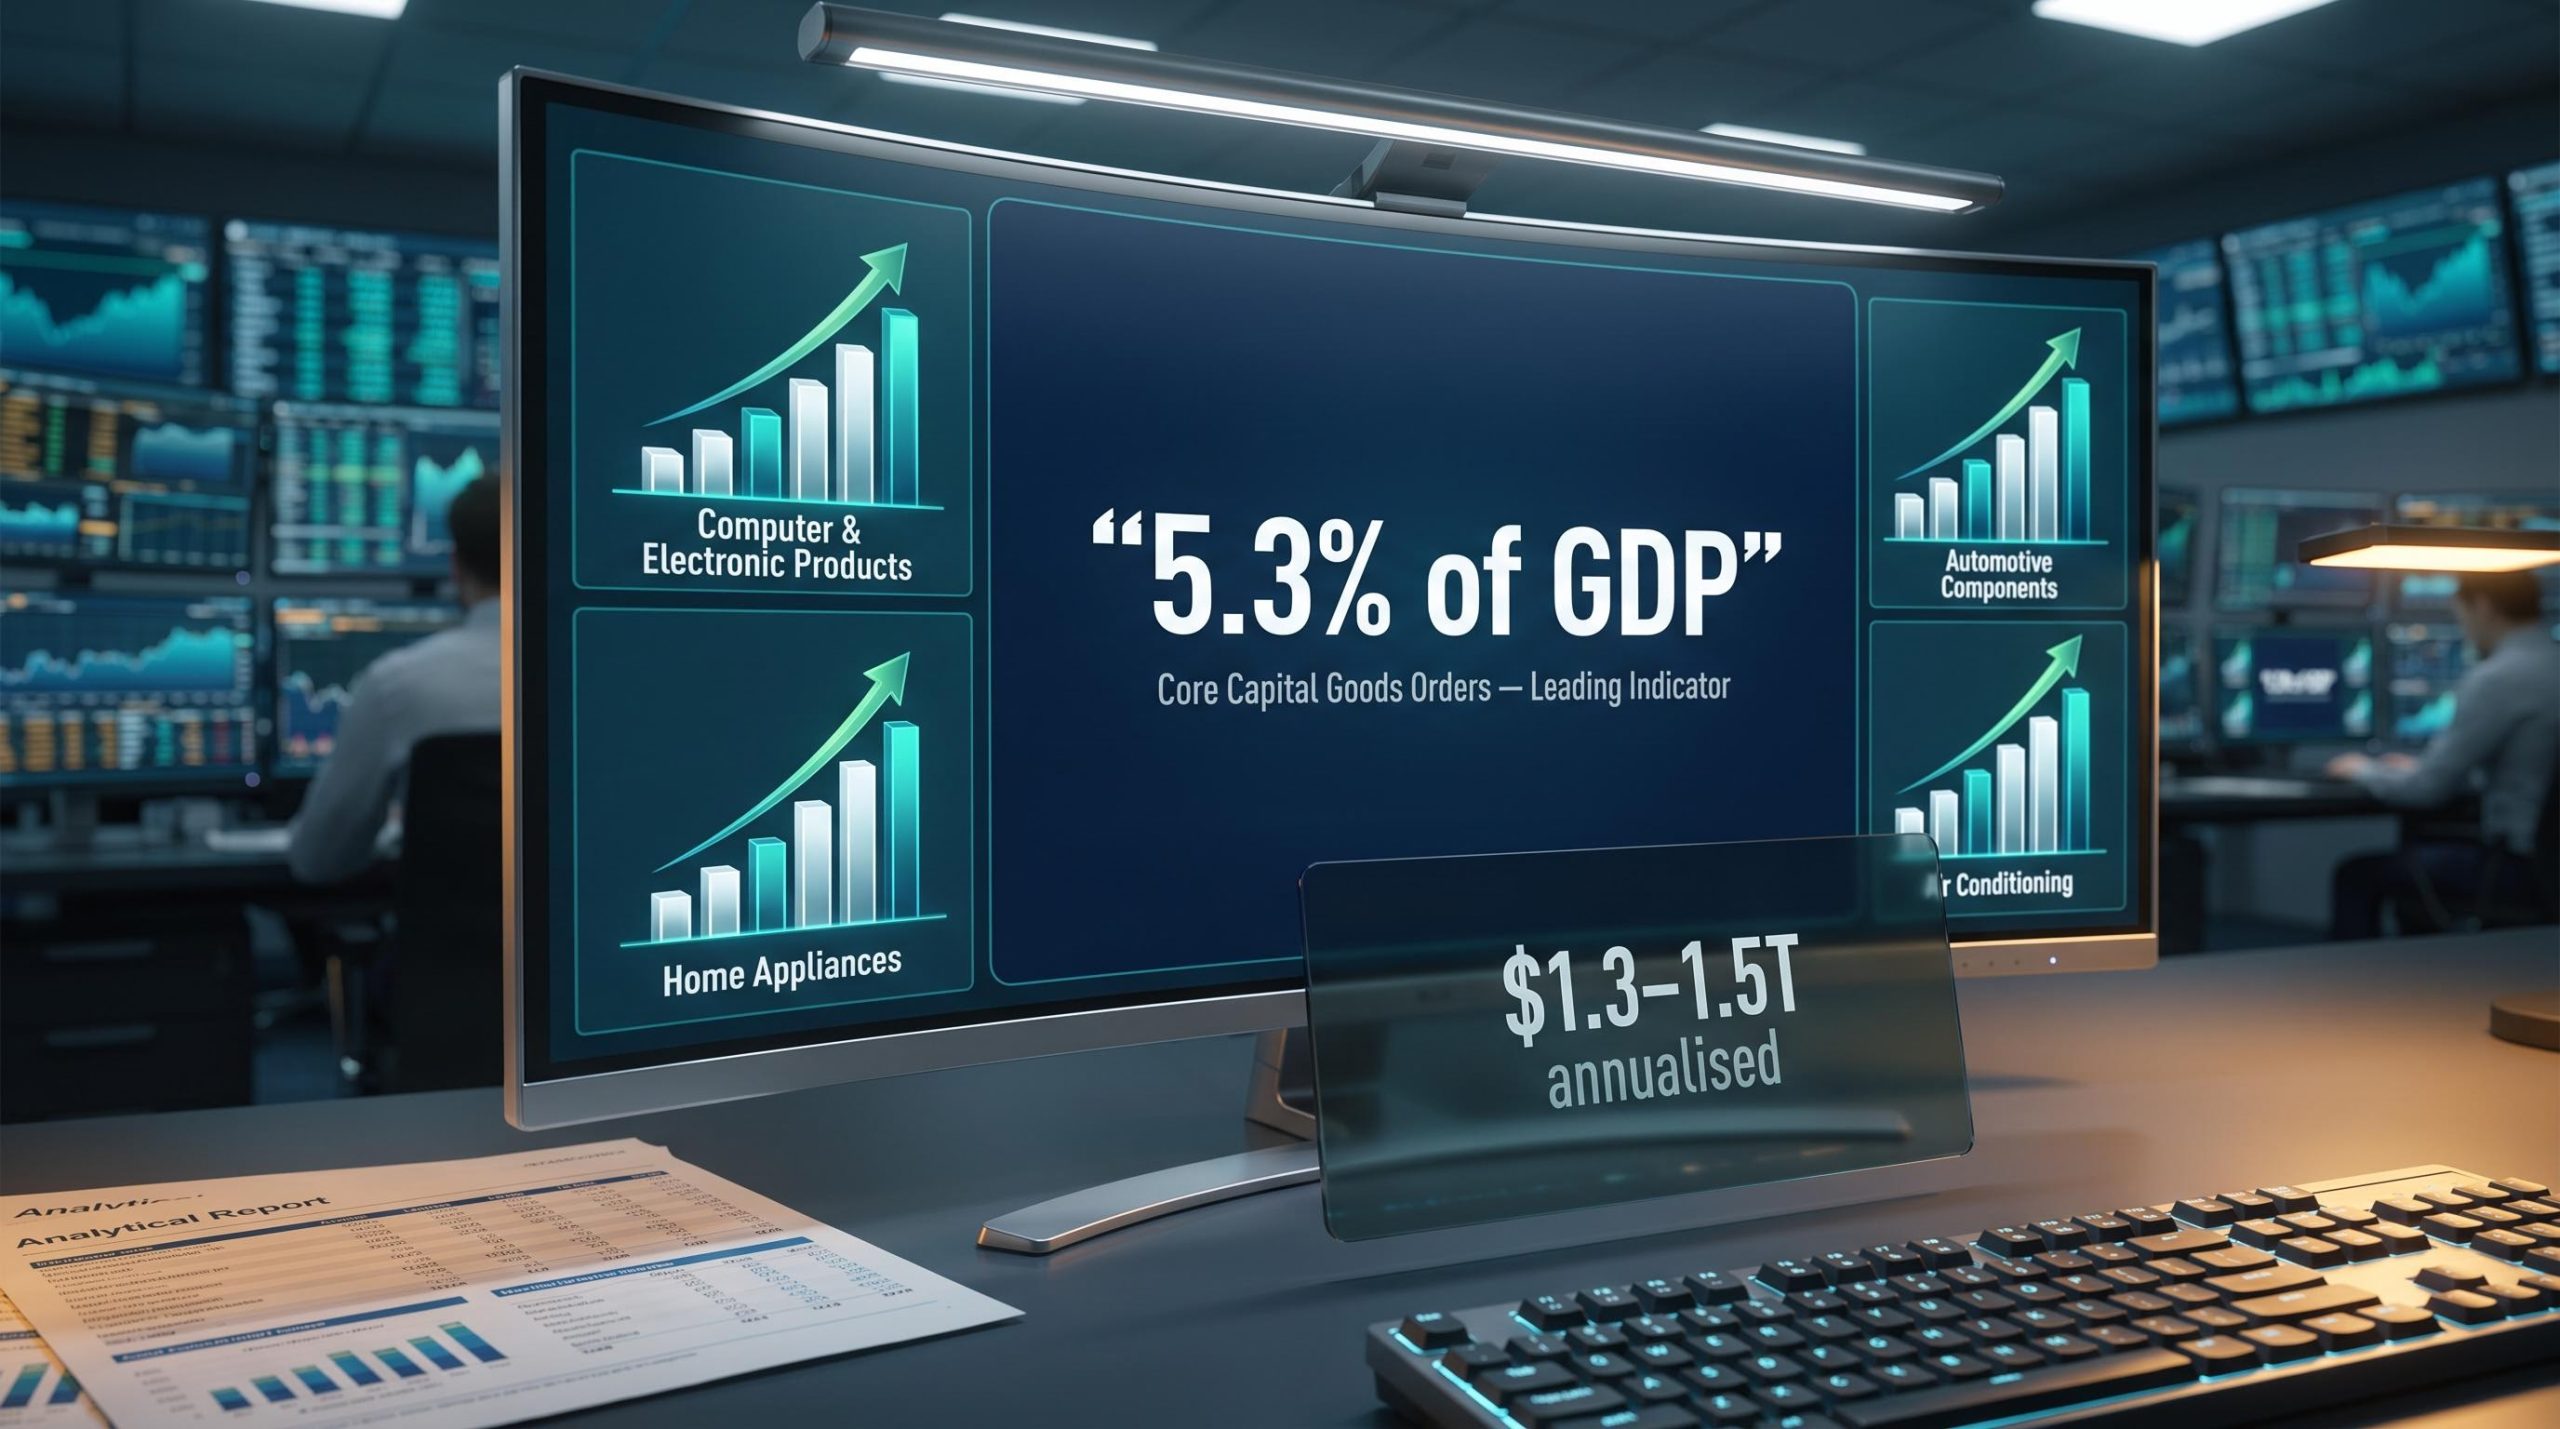
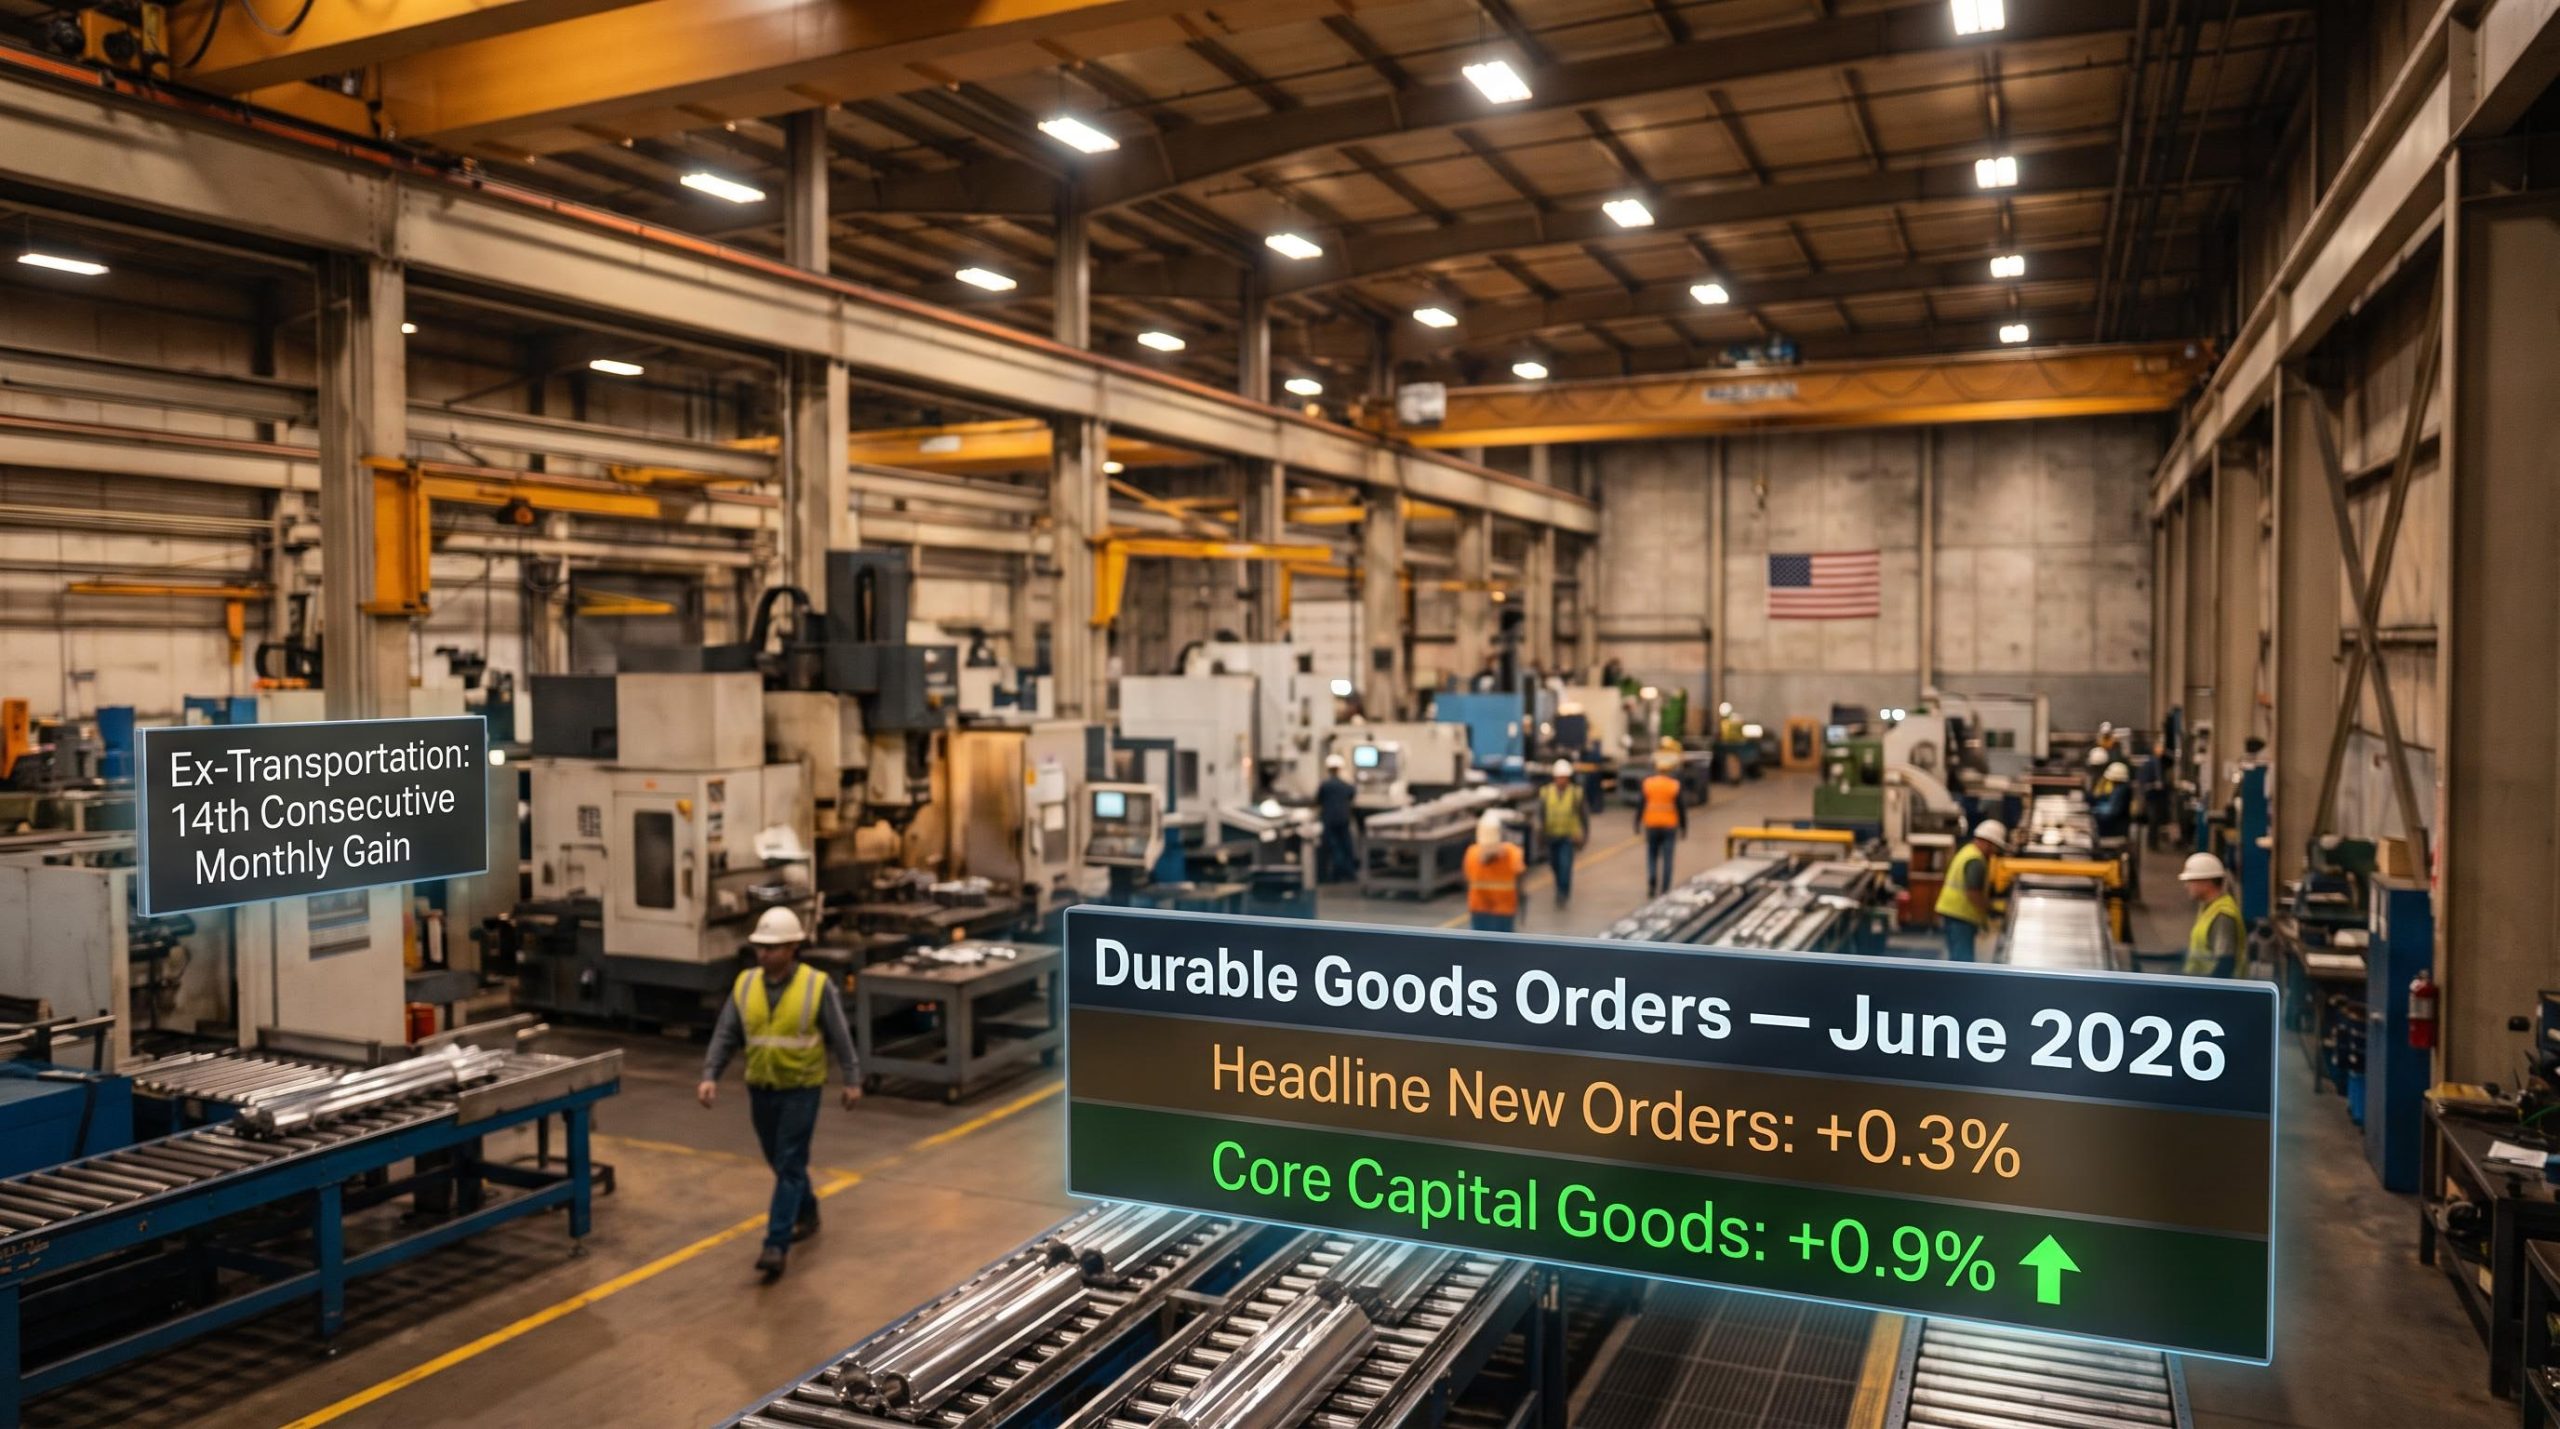
Business investment, the primary swing variable in economic growth, was expanding at a healthy rate as of May 2026. Equity markets, functioning as forward-looking indicators, were signalling improved conditions ahead rather than confirming the sentiment collapse.
Why familiar fears don’t move markets
The concerns driving the 48.2 reading, tariffs, gasoline prices, geopolitical uncertainty, are already known to every market participant. They are already incorporated into forward pricing. Jason Furman and Wilson Powell III of the Peterson Institute for International Economics noted in January 2025 that “the historical relationship between sentiment and spending has broken down somewhat in recent years.”
The question for investors is not whether these risks exist. It is whether economic and earnings outcomes will surprise to the upside or downside relative to expectations that already account for those risks. Fisher Investments analysis published via FactSet on 15 May 2026 reinforced this framing: economic reality exceeding expectations, not the level of sentiment, is the fundamental driver of market performance.
What the index actually measures (and what it doesn’t)
The University of Michigan Surveys of Consumers has tracked sentiment continuously since 1952, using monthly telephone surveys of American households. The questions fall into three broad categories:
The University of Michigan Surveys of Consumers has tracked sentiment continuously since 1952, using monthly telephone surveys of American households that capture current financial conditions, buying intentions, and forward expectations across one-year and five-year horizons.
- Current financial conditions: How respondents assess their own personal finances relative to a year ago
- Buying conditions: Whether respondents believe now is a good or bad time to make major purchases
- Future expectations: Where respondents expect the economy and their finances to be in one and five years
The index aggregates these responses into a single headline number. That number reflects how people feel. It does not directly measure what they are doing, earning, or spending.
Granger-causality testing on decades of University of Michigan data consistently shows that sentiment follows markets rather than leading them, meaning the 48.2 reading is more accurately read as a lagging reflection of recent equity and inflation conditions than as a forward signal about where the economy is heading.
What institutional researchers say about its predictive power
Three independent bodies of research, published between February and April 2025, converge on the same conclusion.
The Federal Reserve Bank of New York found in a March 2025 Liberty Street Economics paper that sentiment “regularly deteriorates after macro conditions have already turned” and that its incremental forecasting value for output is “modest.” Joanne W. Hsu of the University of Michigan wrote in February 2025 that recent sentiment swings have lagged turning points in inflation and spending, which “limits the use of sentiment as a stand-alone leading indicator of recession risk.” Goldman Sachs US Economics reached a parallel finding in February 2025: once income, wealth, and employment data are included, sentiment adds limited incremental forecasting power.
The convergence is notable because it spans a central bank research team, the survey’s own director, and a major sell-side economics desk. All three treat sentiment as a behavioural gauge, not an economic forecasting instrument.
The historical pattern: sentiment lows and what followed
The contrarian case does not start with an assertion. It starts with the record.
Among 12 bear markets since 1952, only one, the 1980-1982 downturn, saw consumer sentiment deteriorate sharply before the equity decline. That instance was driven by severe inflation conditions that had already been visible for months. In the other 11 cases, sentiment either deteriorated alongside the downturn or after it had already begun.
The June 2022 episode is the most instructive recent case. Sentiment hit its then-record low of 50.0. Recession forecasts were nearly unanimous across Wall Street and in financial media. A recession did not materialise. A bull market began in October 2022, with sentiment still deeply depressed.
Chris Senyek of Wolfe Research, writing in a January 2025 client note summarised by Bloomberg, framed the pattern directly:
Extreme lows in consumer sentiment have historically aligned with or slightly lagged equity market bottoms, making sentiment a contrarian rather than a leading indicator for U.S. equities.
The specific historical episodes he cited tell the same story:
The sentiment-market divergence reached its starkest recorded level in late April and early May 2026, with the S&P 500 closing above 7,200 while the Michigan index set consecutive record lows, a pairing that has historically been associated with market troughs rather than the onset of sustained declines.
- 1990: Sentiment troughed as the market bottomed, not before the recession hit
- 2008-2009: The deepest sentiment readings arrived alongside and after the equity market low of March 2009
- June 2022: Record-low sentiment coincided with the bear market bottom; a sustained rally followed
Liz Ann Sonders of Charles Schwab reinforced this in March 2025, noting that sentiment “tends to lag both the market and the economy.” The base rate is clear: investors who have historically repositioned defensively in response to extreme sentiment lows have, more often than not, acted at precisely the wrong moment.
Two distortions inflating the fear signal
The 48.2 reading is real. The question is whether the full magnitude of the number reflects genuine economic distress or whether structural distortions are amplifying the signal.
The partisan polarisation problem
Research from three independent sources documents a pattern that predates the current reading. The University of Michigan’s own March 2025 analysis of its survey data shows that out-party respondents, those whose preferred political party does not hold the White House, report substantially lower sentiment scores than in-party respondents, even after controlling for income and demographics. These partisan gaps have widened compared with pre-2000 norms.
The Federal Reserve Bank of New York’s May 2025 analysis of its Survey of Consumer Expectations found the same asymmetry: expected inflation, unemployment, and income growth differ significantly by party affiliation, with out-party respondents far more pessimistic.
The Brookings Institution formalised the implication in an April 2025 report. Consumer sentiment indexes, the authors concluded, have become “partisan-weighted measures of political approval as much as economic assessments.” When one party’s pessimism dominates the aggregate reading, the headline number can misrepresent actual economic conditions.
What consumers say about their own finances
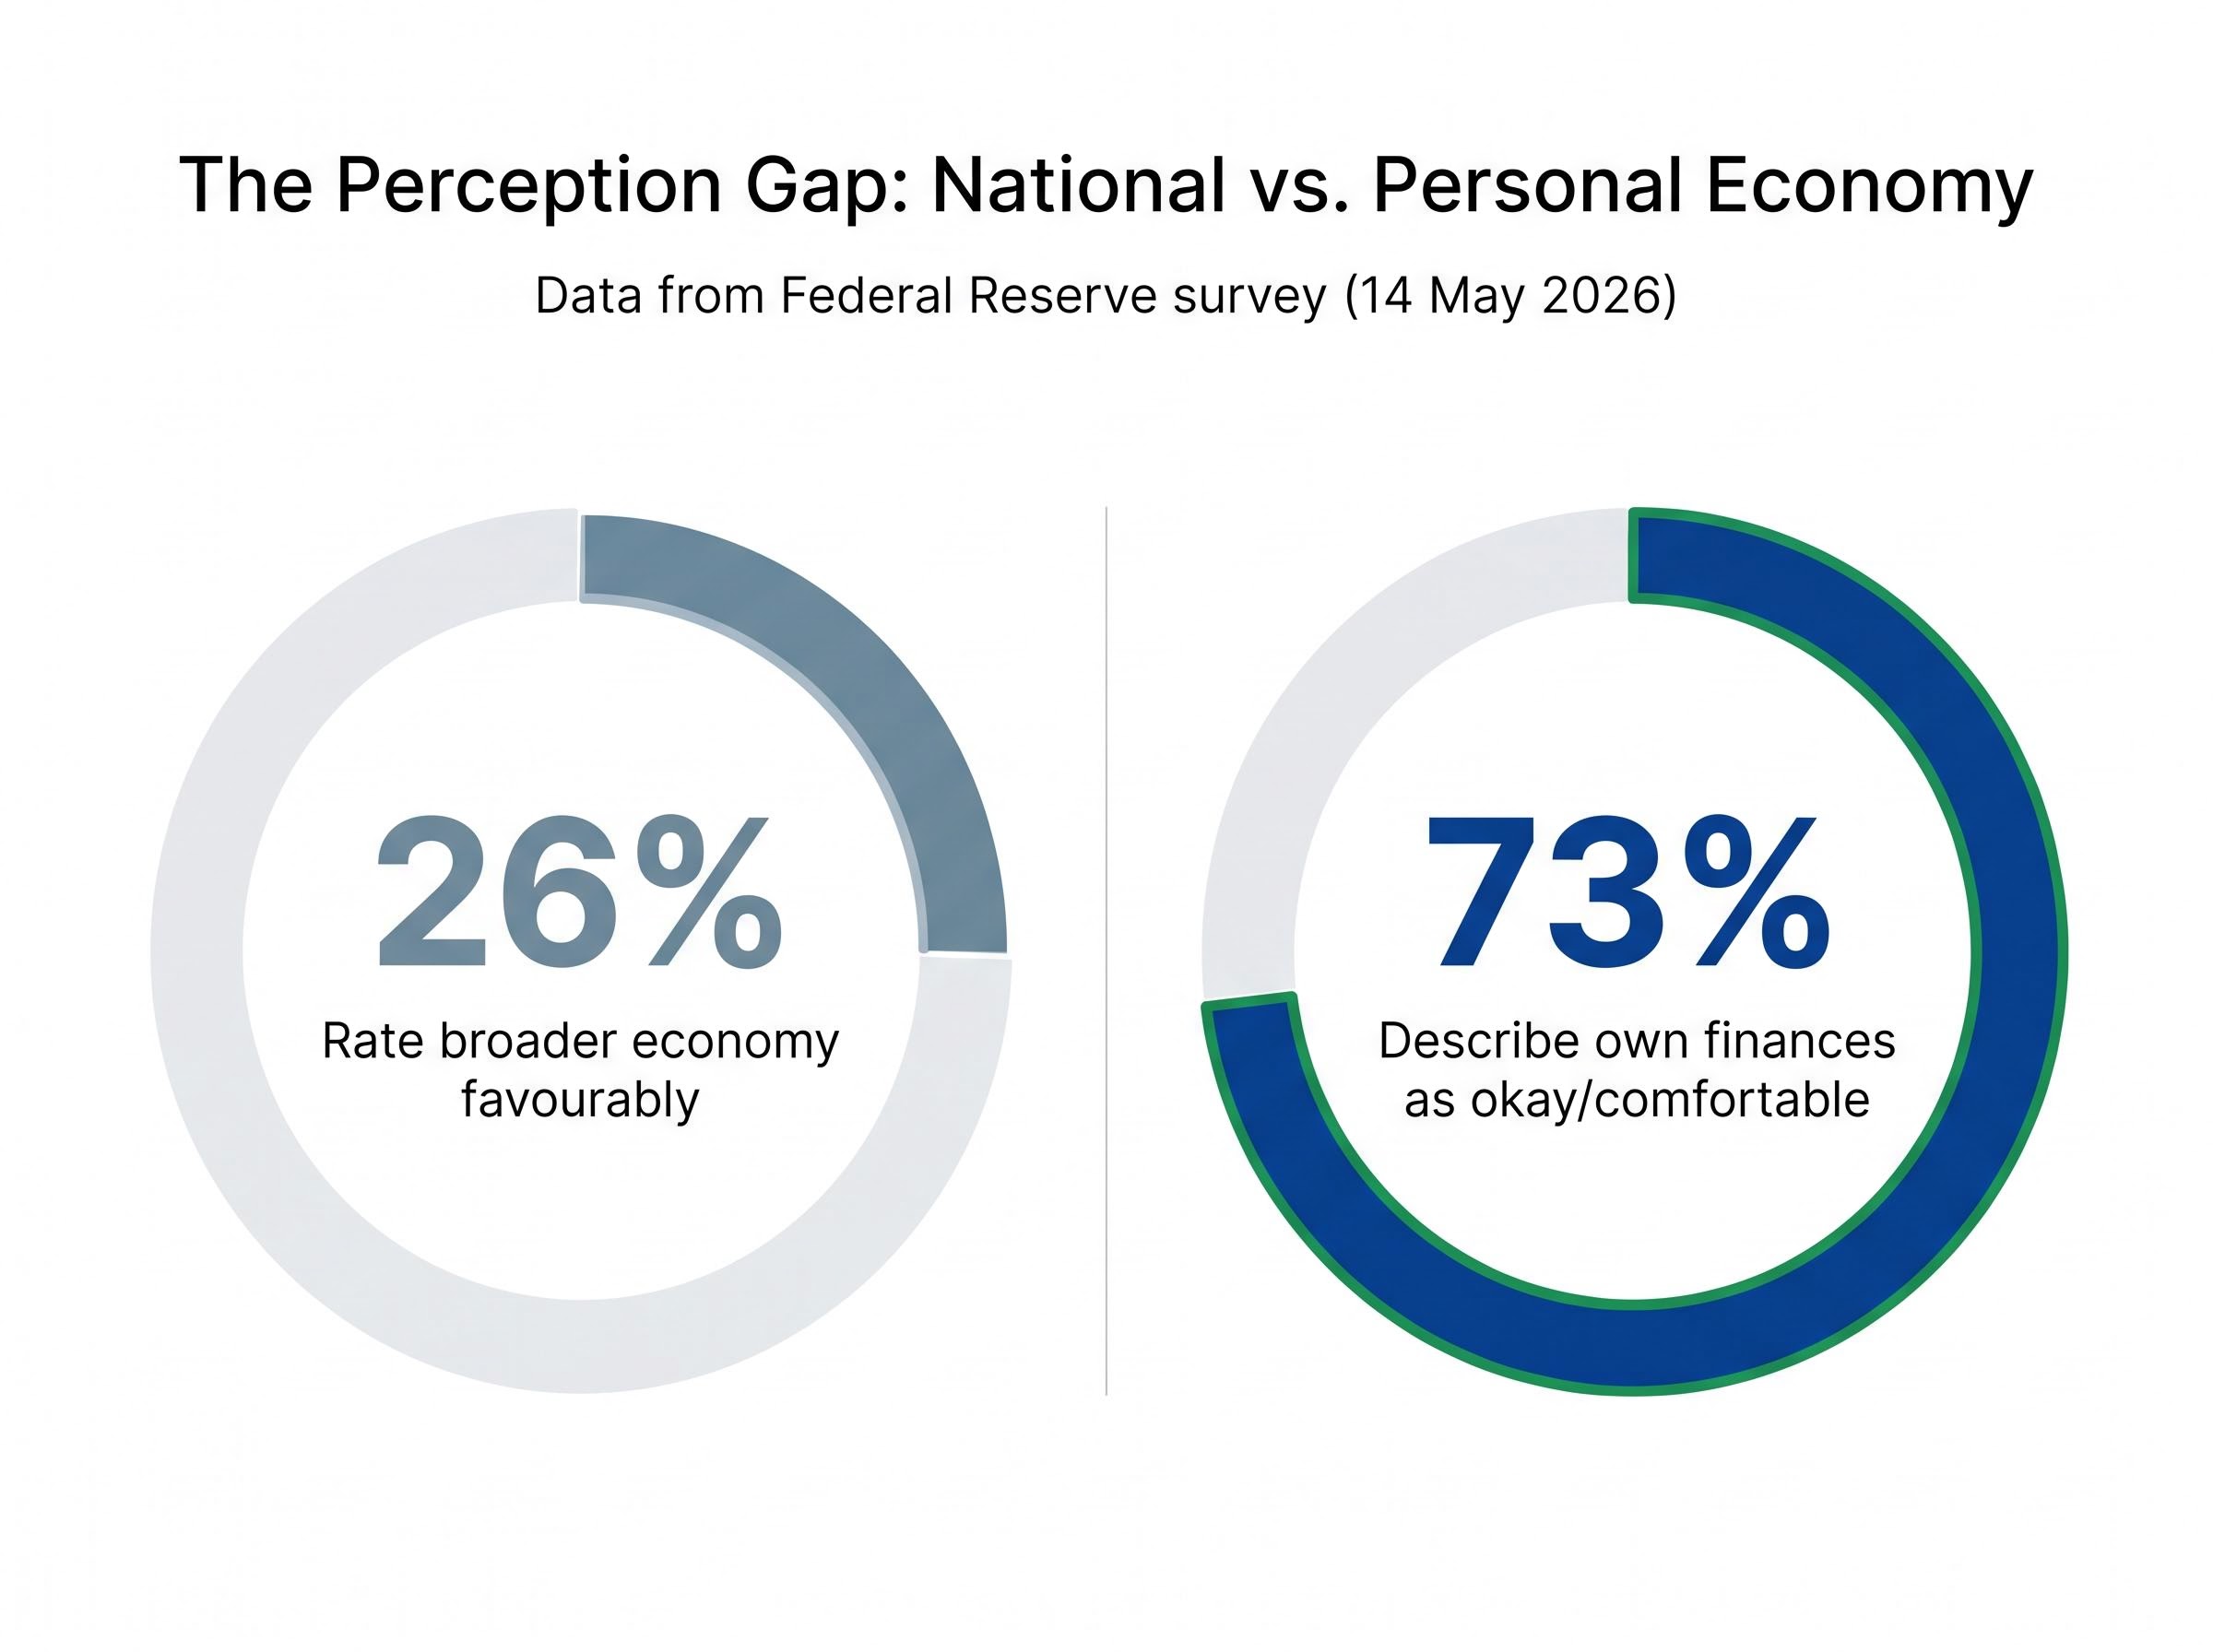
A Federal Reserve survey published on 14 May 2026 revealed a striking gap. Only 26% of respondents rated the broader economy favourably. Yet 73% described their own personal finances as either “doing okay” or “living comfortably.”
73% of Americans described their own finances as okay or comfortable, while only 26% rated the national economy favourably, according to a Federal Reserve survey published 14 May 2026.
New York Fed Q1 delinquency transition data, cited in the same Axios report, showed the pace of new delinquency entry declining in Q1, a hard-data signal that runs counter to the sentiment headline.
Both distortions point in the same direction. The 48.2 aggregate is absorbing non-economic signal, partisan identity and abstract pessimism about national conditions, that does not translate into the kind of spending contraction that drives recessions.
What matters more than how consumers feel
The 48.2 reading is real. The concerns fuelling it are real. But sentiment’s track record as a stand-alone predictor of recessions or equity market drawdowns is poor by the weight of institutional evidence, and the current reading carries additional distortion from partisan polarisation and the gap between how Americans describe the national economy and how they describe their own finances.
The indicators that carry more predictive weight for recession risk assessment are concrete and trackable:
- Labour market data: Non-farm payrolls and initial jobless claims, the most direct real-time signal of economic momentum
- Business investment trends: Non-residential fixed investment as reported in GDP component data
- Household debt delinquency progression: Transition rates from the New York Fed’s quarterly reports, particularly the trajectory across age cohorts
- Corporate earnings surprises: Whether actual results exceed or fall short of consensus estimates
- Credit spreads: The gap between corporate bond yields and Treasuries, a market-based signal of default risk perception
Labour market signals sit at the top of any well-constructed recession indicator hierarchy, and the April 2026 nonfarm payroll report illustrated exactly why: a 115,000 headline beat masked a three-month average of just 48,000 per month, simultaneous ISM contraction in both manufacturing and services employment, and a 445,000 surge in involuntary part-time workers.
A New York Fed working paper from April 2025 found that standard spread and claims models outperform expectations-based models for recession prediction. Goldman Sachs reached a compatible conclusion: once income, wealth, and employment are included, sentiment adds limited incremental value.
The final May 2026 University of Michigan release on 22 May 2026 will provide an updated data point. It is unlikely to change the analytical picture substantially.
A record low that tells you more about the moment than what’s next
A preliminary reading of 48.2 is a significant signal about how Americans feel right now. It reflects gasoline prices that have surged, tariff anxieties that have deepened, and a partisan environment in which political identity shapes economic perception at a level institutional researchers describe as historically unusual.
What it does not reflect, based on the convergent findings of the Federal Reserve Bank of New York, the University of Michigan’s own director, Goldman Sachs, Charles Schwab, Wolfe Research, and the Peterson Institute, is a reliable prediction of recession or equity market collapse. In 11 of 12 bear markets since 1952, sentiment did not lead the downturn. In June 2022, a record low coincided with the precise bottom.
Genuine uncertainties remain. The final 22 May reading, Q1 2026 economic data not yet published, and the possibility that tariff-driven cost pressures worsen materially all warrant monitoring. The indicators that will resolve those uncertainties are employment, income, delinquency data, earnings, and credit spreads, not a survey that, historically, tells investors more about where the economy has been than where it is going.
For investors who want to move from sentiment analysis to explicit probability frameworks, our full explainer on S&P 500 recession probability models examines Goldman Sachs, J.P. Morgan, and Moody’s Analytics estimates ranging from 30% to 48.6%, the historical relationship between gasoline price levels and index drawdowns, and the implied price targets that would follow from recessionary earnings contraction at current index levels.
This article is for informational purposes only and should not be considered financial advice. Investors should conduct their own research and consult with financial professionals before making investment decisions. Past performance does not guarantee future results.