Why the Mid-Cap Rotation Beat Mega-Cap Tech in June 2026
5 mins ago

Global fund managers stampeded into equities in May 2026 at a pace never previously recorded in the BofA Global Fund Manager Survey. Equity allocations leapt from a net 13% overweight to a net 50% overweight in a single survey cycle, the largest one-month swing in the survey’s history. The May 8-14 polling window captured 200 fund managers repositioning against a backdrop of fading recession fears, renewed earnings optimism driven by artificial intelligence, and an expectation among half of respondents that the Federal Reserve would cut rates within 12 months. The combination produced a positioning stampede, not a gradual rotation. What follows is an analysis of what the record swing actually signals, how BofA’s contrarian framework interprets it, what chief investment strategist Michael Hartnett is recommending, and what the data means for anyone reading institutional momentum heading into June 2026.
The scale of the May reallocation is difficult to overstate. In April, global fund managers held a net 13% overweight in equities. By mid-May, that figure had ballooned to 50%, the highest reading since January 2022.
The move was not confined to one side of the ledger. Cash levels fell simultaneously, dropping from 4.3% to 3.9% and crossing below the 4.0% threshold that activates BofA’s contrarian sell signal.
The key positioning metrics from the May survey:
The 50% net equity overweight is the highest allocation reading since January 2022, a prior peak that preceded a significant equity drawdown over the following months.
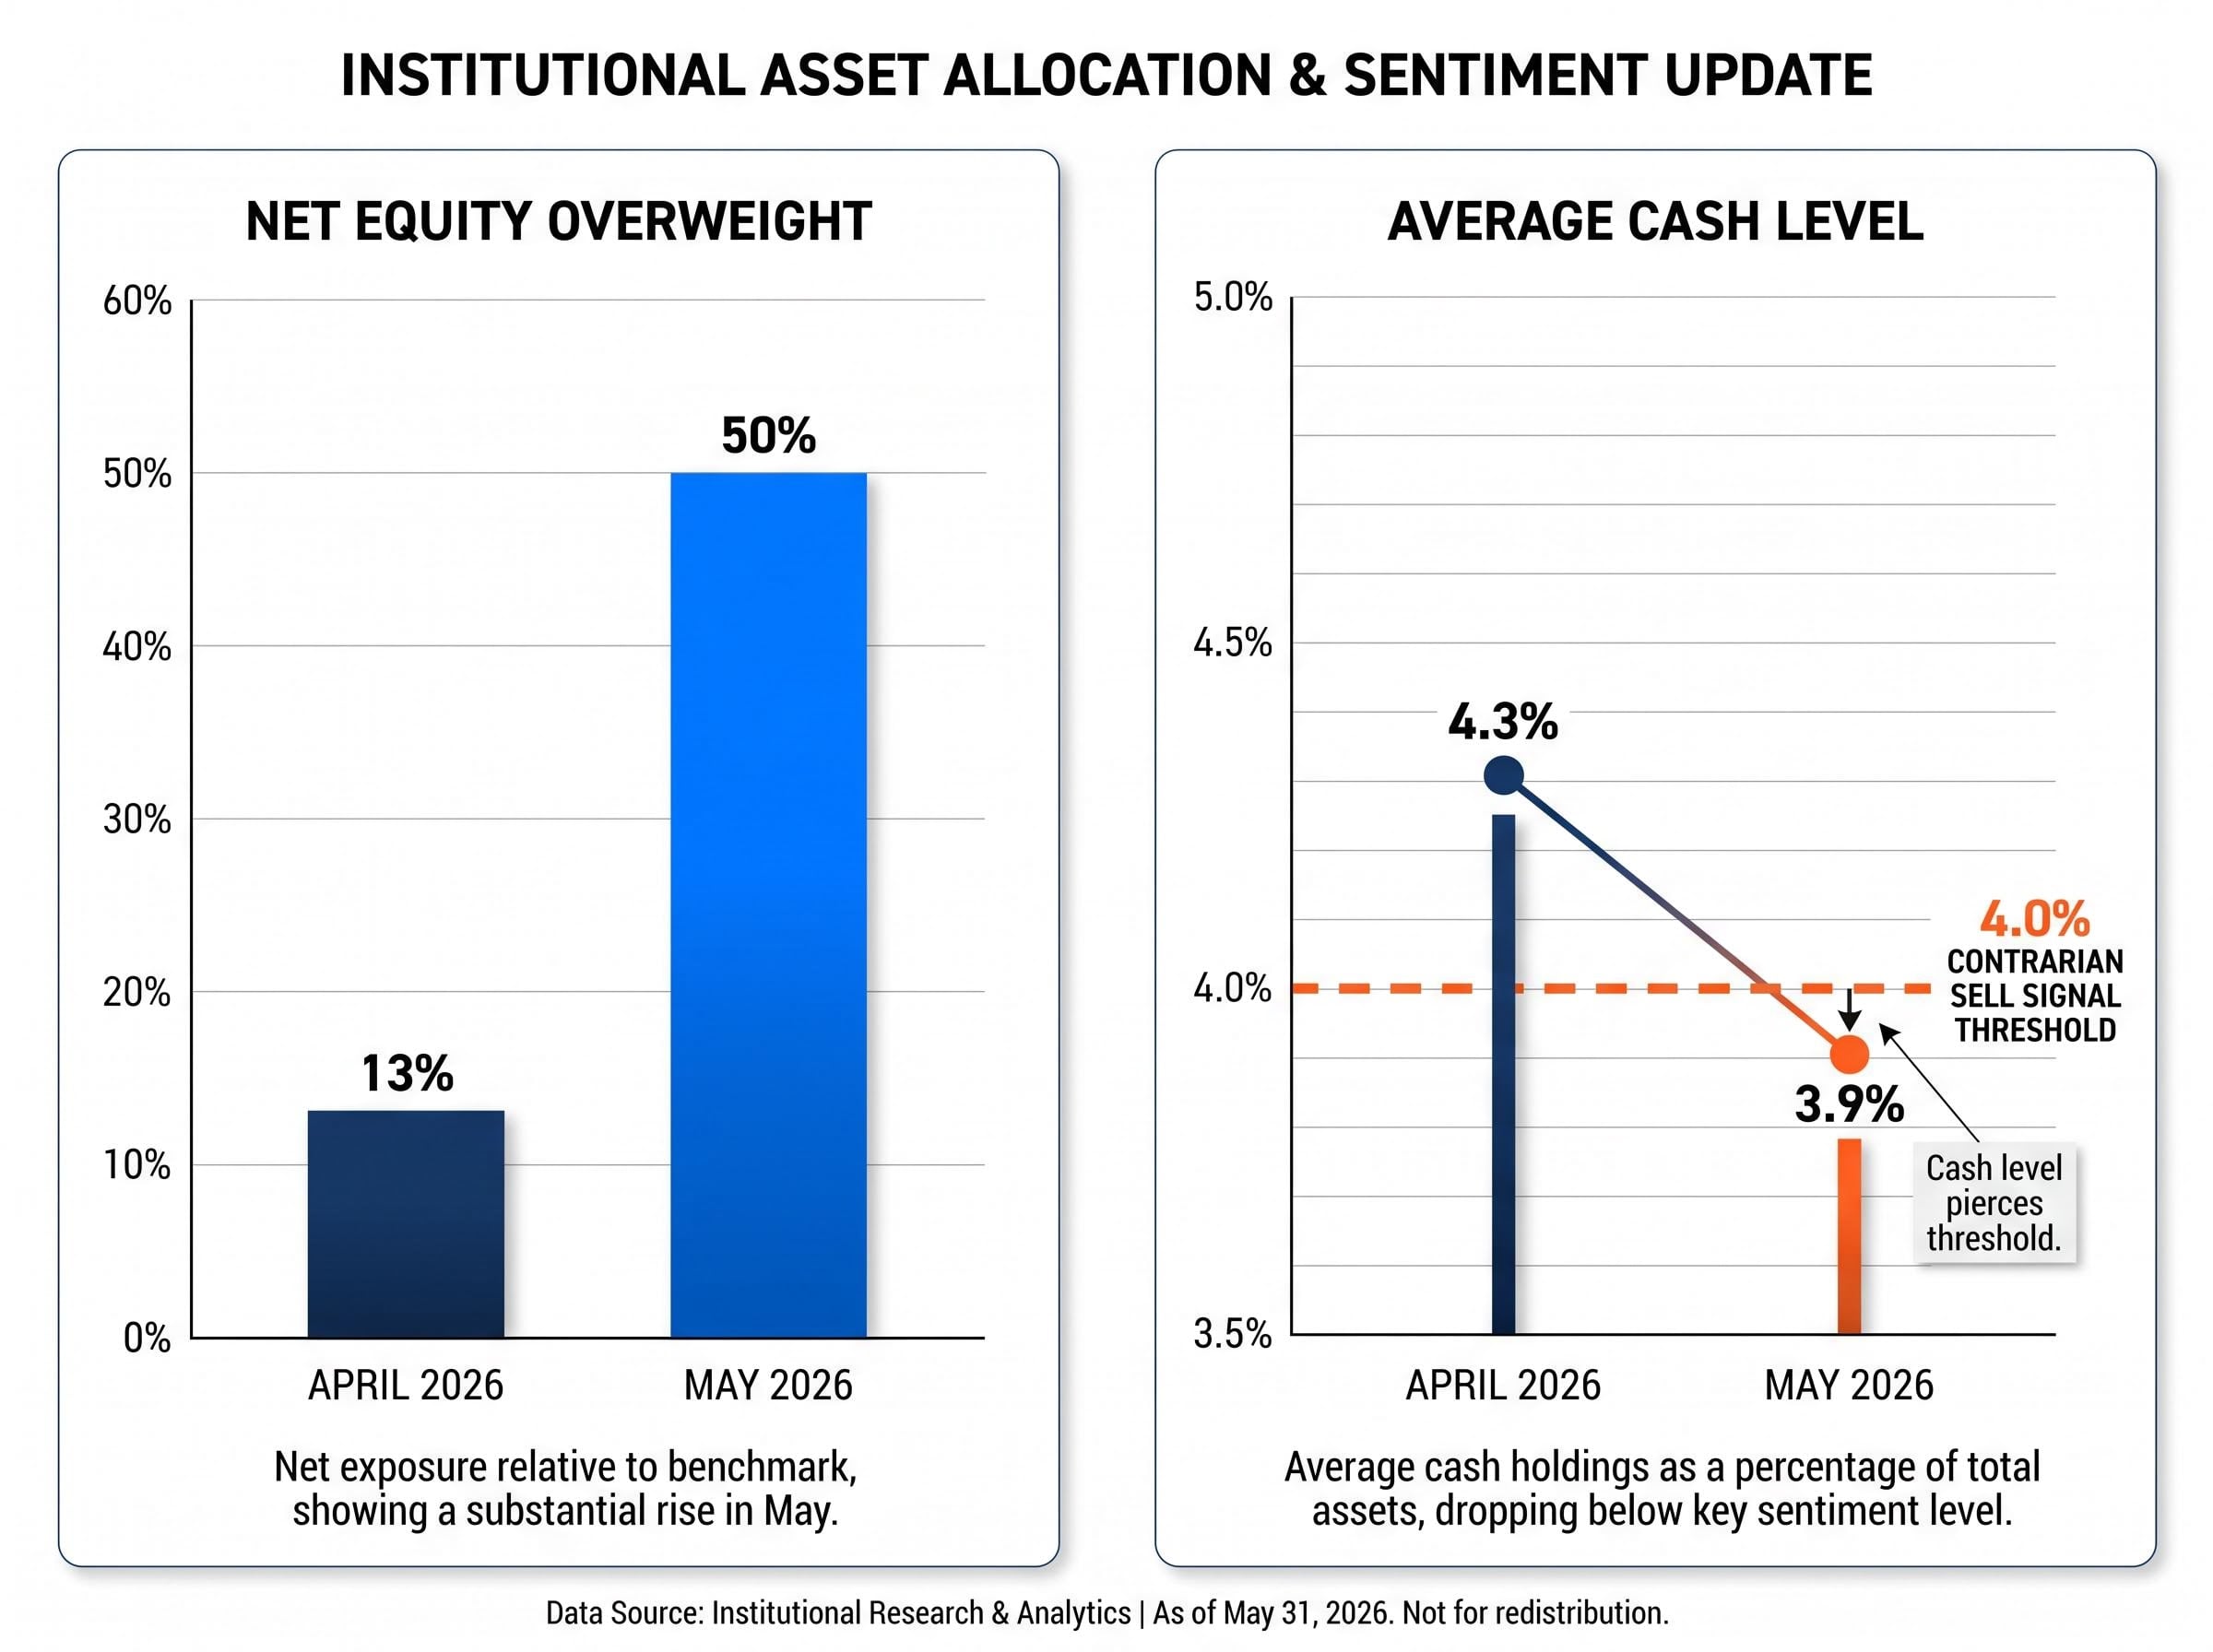
These two signals, the allocation surge and the cash drawdown, are not independent data points. They are two expressions of the same positioning decision: managers simultaneously added risk and funded it by drawing down defensive cash buffers. That dual-trigger event is what separates May’s reading from routine monthly shifts in survey data.
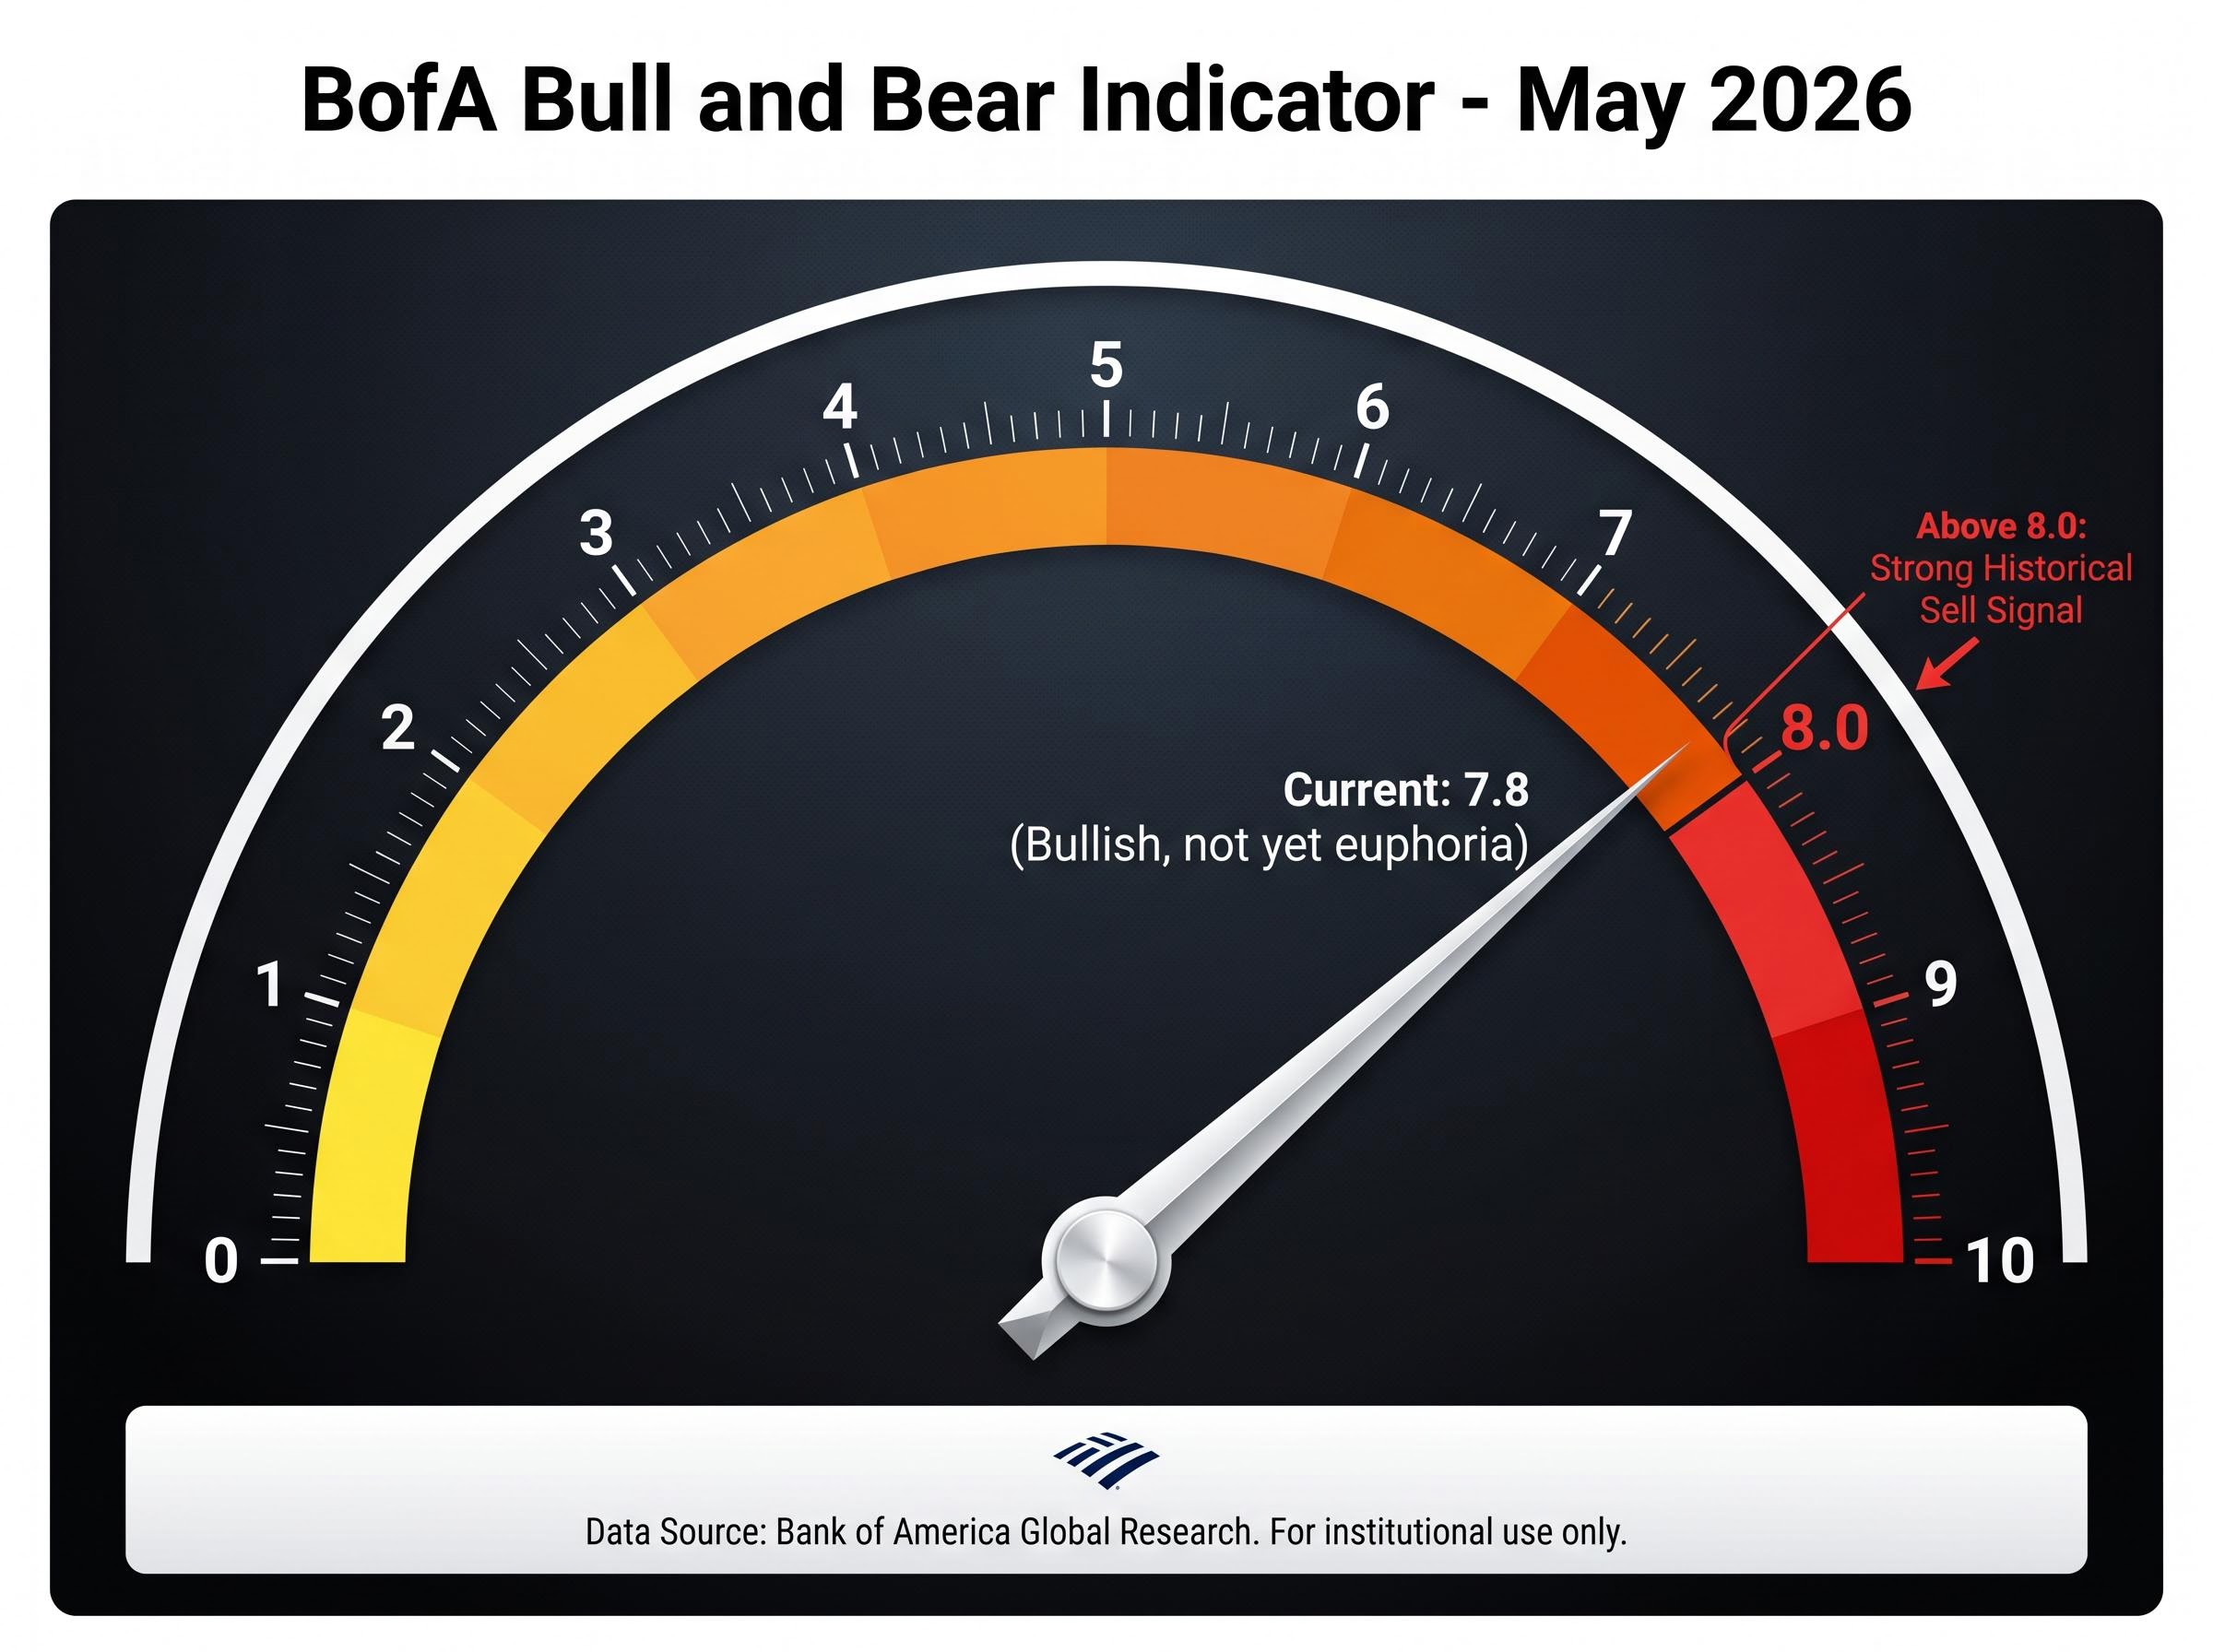
BofA’s Bull and Bear Indicator is a composite gauge that aggregates positioning, sentiment, and flow data into a single reading. Two thresholds define its signal structure: a reading above 8.0 has historically functioned as a strong sell signal, while cash levels falling below 4.0% have been associated with weaker forward equity returns in BofA’s back-tested data.
The May 2026 reading came in at 7.8, elevated enough to sit in what Hartnett’s team has described as the “bullish, not yet euphoria” zone. The distinction between 7.8 and above 8.0 matters. At 7.8, the indicator flags caution and supports a profit-taking recommendation. Above 8.0, historical data associates the reading with the strongest contrarian sell signals in the survey’s history.
BofA’s Sell Side Indicator, a separate composite that aggregates Wall Street strategist equity allocation recommendations, held at 55.6% in April 2026 and sat just 1.9 percentage points from its own historic sell threshold, adding a second independent BofA gauge to the cautionary picture that the Bull and Bear Indicator and cash level data already paint.
“Contrarian” in this framework does not mean predicting a crash date. It means identifying when the consensus has become so crowded that the risk-reward of adding to that consensus deteriorates. The tool signals probability shifts, not timing precision.
| Indicator | Threshold | Historical Signal | May 2026 Status |
|---|---|---|---|
| Bull and Bear Indicator | Above 8.0 | Strong historical sell signal | 7.8 (approaching, not yet triggered) |
| Average Cash Level | Below 4.0% | Contrarian sell signal; weaker forward returns | 3.9% (triggered) |
BofA’s back-tests indicate that periods when cash fell below 4.0% have historically preceded below-average forward equity returns. The finding is directional, not precise: sub-4% cash correlates with weaker performance across multiple cycles but does not identify exact reversal dates.
This is why Hartnett’s recommendation targets early June as a trimming window rather than an exit call. The indicator signals a deteriorating risk-reward environment, and the back-tests support that framing, but they do not claim to pinpoint when the deterioration begins.
Michael Hartnett identified early June 2026 as the year’s best window to trim risk, framing his recommendation as “sell the rip” in U.S. equities and particularly in crowded technology and semiconductor positions.
The reasoning assembles three interlocking data points:
Each element reinforces the others. The allocation swing shows where capital went. The cash drawdown shows how it was funded. The indicator reading shows where the composite sits relative to historical precedent.
Hartnett characterised the positioning shift as “the kind of capitulation into risk we usually see before corrections rather than at the start of new bull markets.”
The language is deliberate. “Trimming” rather than “exiting” is consistent with the 7.8 reading sitting below the full 8.0 sell threshold. Hartnett is making a calibrated call: the conditions warrant reducing exposure, but they have not yet reached the level where his framework’s strongest historical signal is active. The one-to-two-week window following the May 8-14 survey pointed squarely at early June.
The technical picture reinforces the positioning data: the Philadelphia Semiconductor Index was trading approximately 63% above its 200-day moving average in mid-May 2026, a level BofA compares to Nasdaq overextension at the dot-com peak, which is central to Hartnett’s June inflection point thesis and the specific macro catalysts he identified as converging in a narrow two-week window.
Beneath the aggregate equity overweight sits a more concentrated vulnerability. In May, 73% of surveyed managers identified long global semiconductors as the most crowded trade. In April, that figure was 24%, tied with long oil at the top of the list.
The jump from 24% to 73% in a single survey cycle represents one of the fastest crowding builds in recent FMS history, a concentration shift driven by momentum-chasing rather than gradual conviction-building.
The crowding in semiconductor names did not emerge in isolation; semiconductor capital flow dynamics through April 2026 included SOXX posting a record 40.4% monthly gain alongside a self-reinforcing dollar feedback loop that attracted international holders into the same concentrated positions, compounding the crowding that the May FMS then documented at 73% consensus.
That level of consensus creates a specific mechanical risk. When a single trade becomes this crowded, three conditions make it especially vulnerable to sharp unwinds:
The broader positioning data reinforced the concentration picture. The cyclicals-versus-defensives overweight reached its highest level since January 2018, and large-cap conviction was the strongest since June 2022. For investors with exposure to AI and semiconductor names, the crowded-trade data translates the abstract sentiment survey into specific portfolio risk.
Three macro tailwinds drove the positioning shift. Recession fears receded. Profit expectations swung sharply, from a net 14% of managers expecting deterioration in April to a net 17% expecting improvement in May, the sixth-largest monthly profit-optimism surge on record. And 50% of respondents expected Federal Reserve rate cuts within 12 months.
The recession fear receding that powered the May allocation surge rests on buffers with a measurable shelf life; BCA Research’s recession buffer dynamics framework identifies IT investment at an all-time high of 4.9% of GDP as the most durable support, but flags June 2026 as the threshold where inventory depletion and lag effects from the Strait of Hormuz disruption converge to test whether the soft-landing consensus holds.
The combination was potent enough to produce the record allocation swing. But the same survey that documented that optimism also contained data pointing in the opposite direction.
| Metric | April 2026 | May 2026 |
|---|---|---|
| Profit Outlook (net % expecting improvement) | Net 14% expecting deterioration | Net 17% expecting improvement |
| Inflation as Top Tail Risk | 26% | 40% |
| Short-Rate Expectations (net % expecting higher) | Below May level | Net 23% (highest since October 2022) |
Inflation re-emerged as the top tail risk, cited by 40% of managers in May compared to 26% in April. Geopolitical risk fell to second place at 20%. Meanwhile, 62% of managers said the 30-year Treasury yield is more likely to exceed 6% than to fall below 4% over the next 12 months, and a net 23% expected higher short-term rates, the most hawkish reading since October 2022.
The contradiction is not a flaw in the survey. It is the survey’s most important signal. Managers are positioned for a benign soft-landing scenario while simultaneously flagging inflation and rates risks that would undermine that very positioning.
Some strategists have argued that the May FMS result reflected positioning finally catching up to genuine macro improvement, meaning the contrarian signal may be “late, not wrong.” Mid-cycle sentiment tops tend to unfold over months rather than as single-day reversal events. This is why Hartnett framed his call as a trimming window rather than a crash prediction.
The May 2026 FMS is not a reason to panic. It is a reason to be deliberate. The distinction between 7.8 and above 8.0 on the Bull and Bear Indicator matters for calibrating the urgency of any response, and Hartnett’s own recommendation reflects that calibration: trim exposure, do not abandon it.
Three specific escalation signals are worth monitoring in the coming weeks:
What the survey confirms and what it cannot predict are distinct:
The appropriate response is position review, not market timing. That framing is consistent with Hartnett’s own call and with the indicator’s current status one step below its strongest signal.
The May 2026 BofA Global Fund Manager Survey documents a genuine historic positioning event. The 37-percentage-point single-month surge in equity allocations, the cash drawdown below 4.0%, and the semiconductor crowding at 73% are simultaneously a bullish momentum confirmation and a contrarian caution flag. Both interpretations are defensible given the data.
The January 2022 precedent provides the closing anchor. The last time equity allocations reached this level, markets subsequently corrected over the following months. That reference does not make correction inevitable; it makes the risk calculus worth taking seriously.
The next BofA FMS (June 2026) and the Bull and Bear Indicator’s proximity to 8.0 are the two data points most worth watching. If the indicator crosses 8.0 with cash continuing to fall, the contrarian case will strengthen materially. Until then, the May survey stands as what it is: the largest positioning stampede on record, carrying all the momentum and all the vulnerability that description implies.
This article is for informational purposes only and should not be considered financial advice. Investors should conduct their own research and consult with financial professionals before making investment decisions. Past performance does not guarantee future results. Financial projections are subject to market conditions and various risk factors.
The BofA Global Fund Manager Survey is a monthly poll of professional investors that tracks equity allocations, cash levels, and sentiment across global markets. Investors follow it because it reveals institutional positioning extremes that BofA's contrarian indicators use to identify potential turning points in equity markets.
The May 2026 survey showed equity allocations surged from a net 13% overweight in April to a net 50% overweight, the largest single-month swing in the survey's history and the highest allocation reading since January 2022. Cash levels simultaneously fell from 4.3% to 3.9%, crossing below BofA's contrarian sell threshold of 4.0%.
BofA's Bull and Bear Indicator is a composite gauge of positioning, sentiment, and flow data; readings above 8.0 have historically produced BofA's strongest sell signals. The May 2026 reading came in at 7.8, placing it in a cautionary zone that Hartnett described as 'bullish, not yet euphoria,' supporting a profit-trimming recommendation rather than a full exit call.
In the May 2026 survey, 73% of fund managers identified long global semiconductors as the most crowded trade, up sharply from 24% in April 2026. This level of consensus concentration increases vulnerability to sharp unwinds because fewer marginal buyers exist to absorb selling pressure if the trade thesis weakens.
Michael Hartnett identified early June 2026 as the year's best window to trim risk, recommending investors 'sell the rip' in US equities and reduce exposure to crowded technology and semiconductor positions. His call is a calibrated trimming recommendation rather than a full exit, reflecting the Bull and Bear Indicator sitting at 7.8, one step below the 8.0 level that triggers BofA's strongest historical sell signal.