
How to Evaluate Fund Benchmarks Before You Commit Capital
1 hr ago

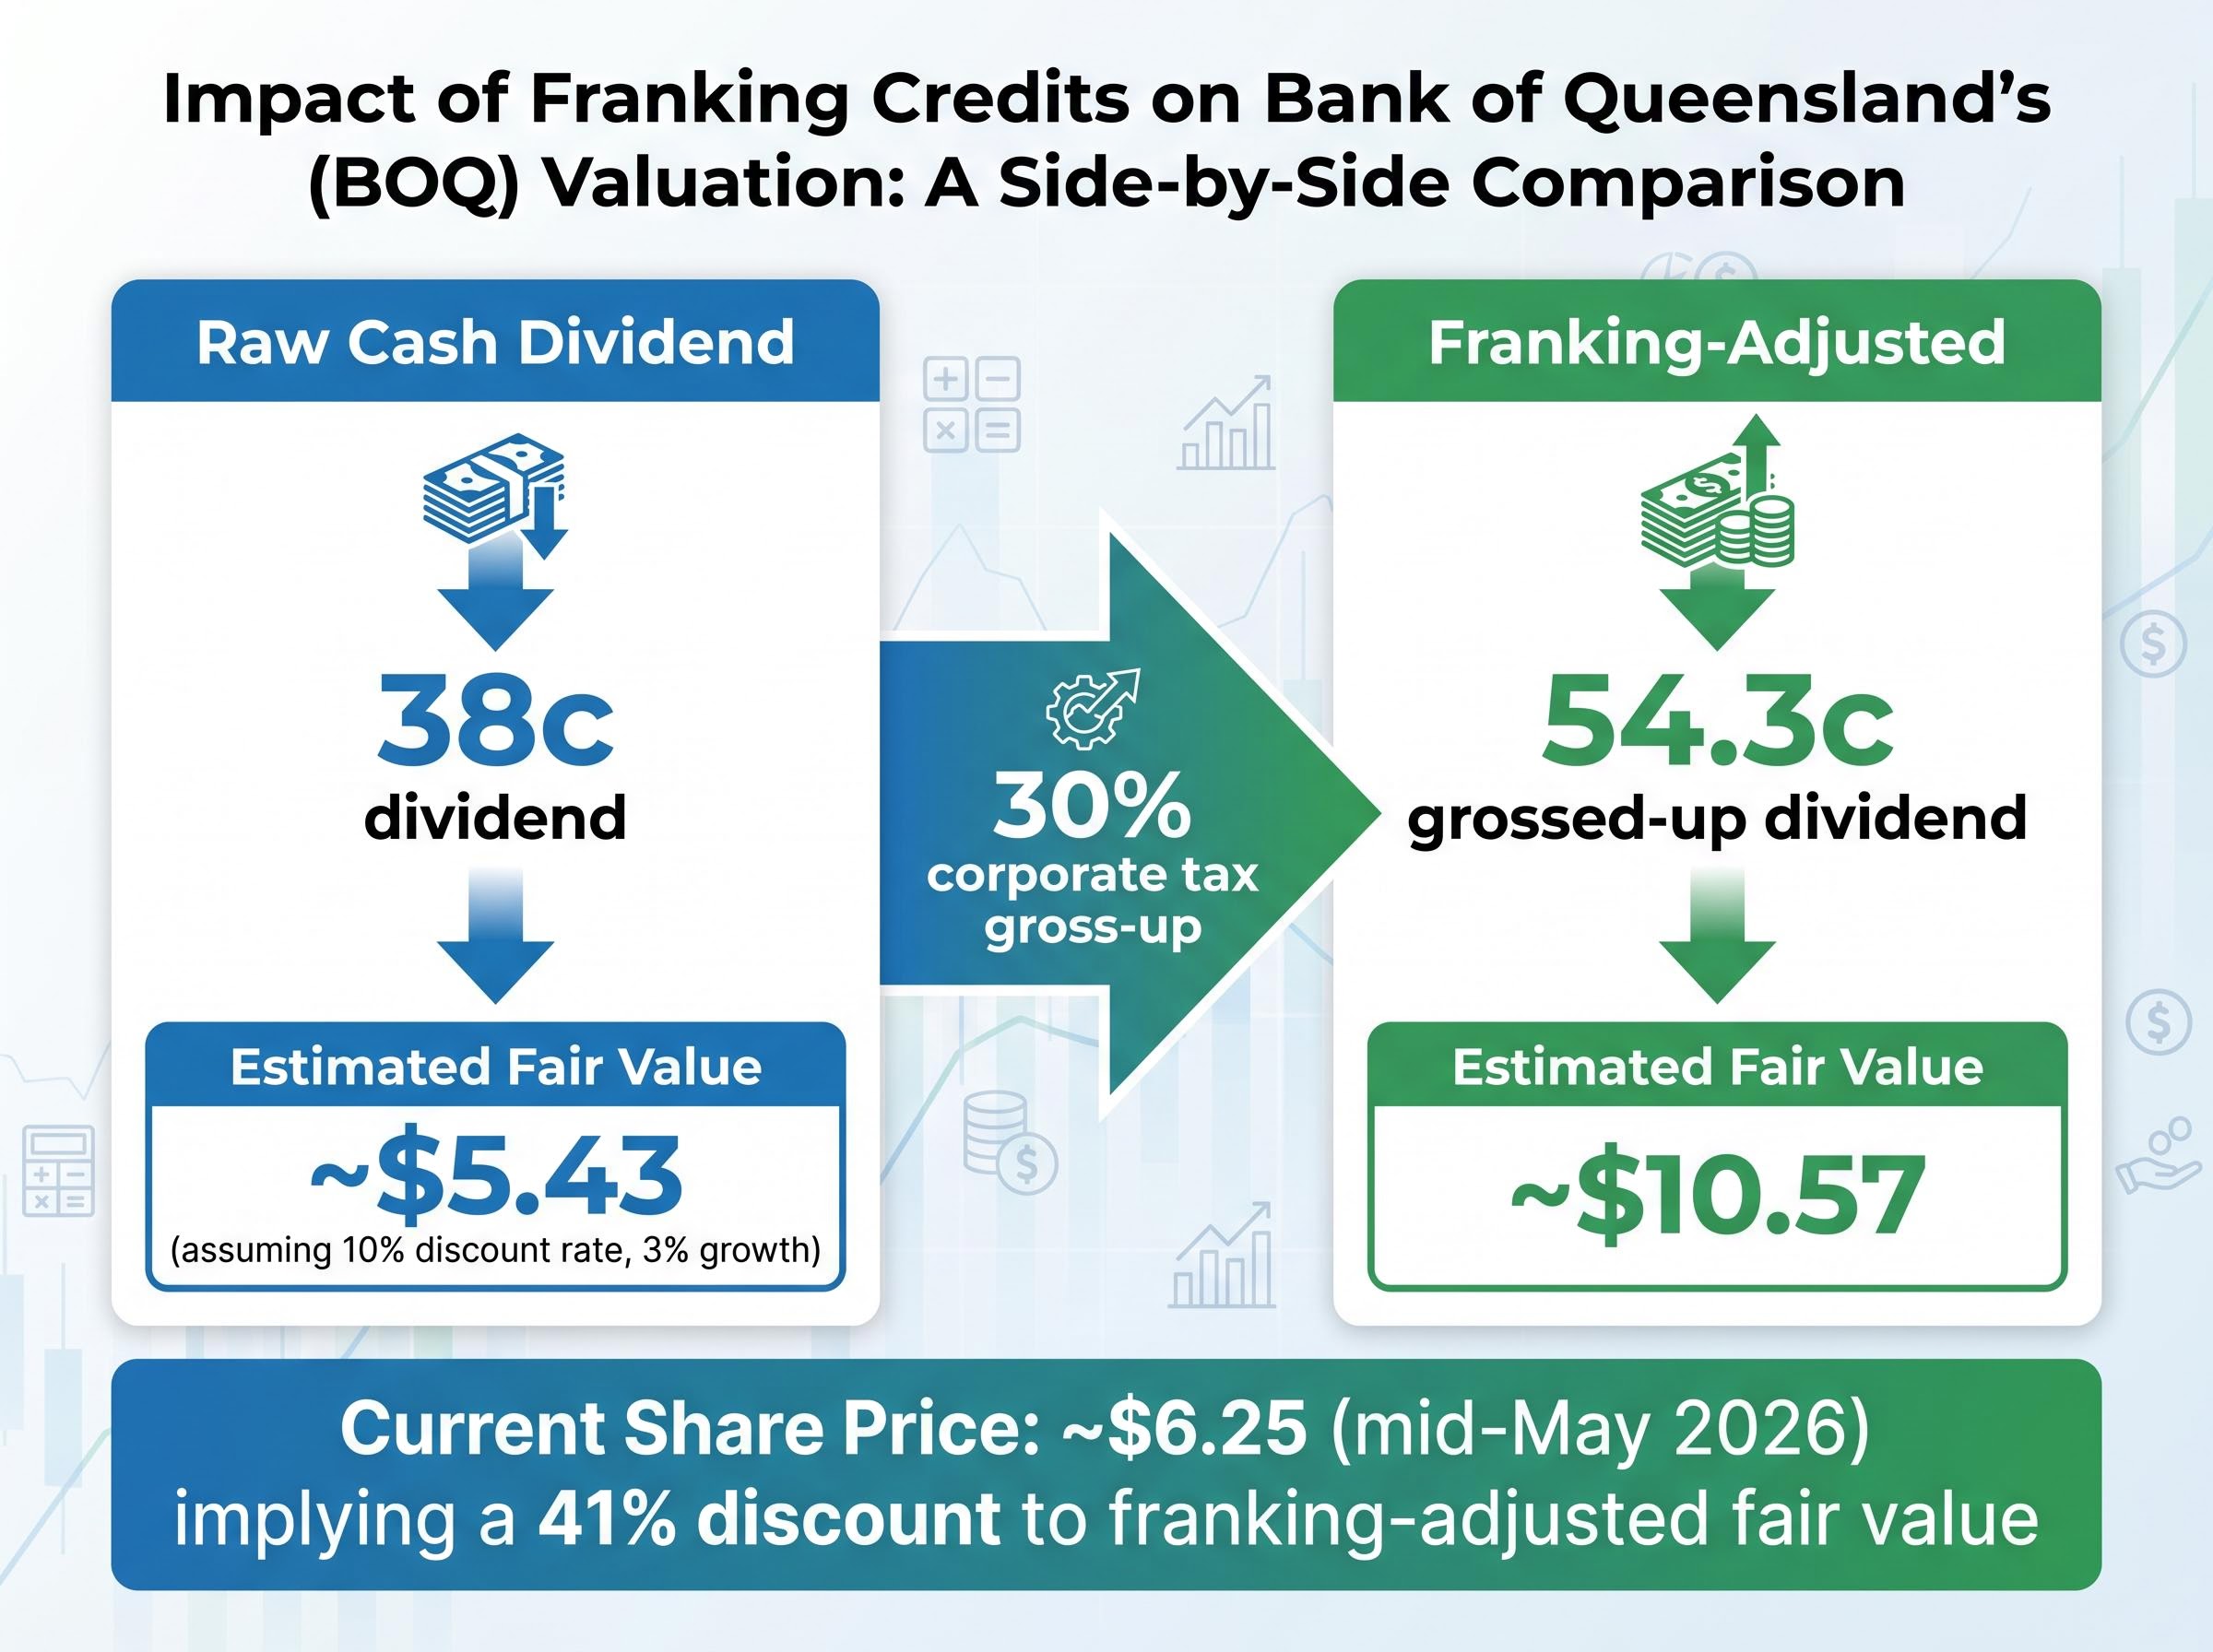
At Bank of Queensland’s (BOQ) current share price of approximately $6.25, a Dividend Discount Model calculation using the FY25 dividend of 38 cents per share produces an estimated fair value of around $7.40. Gross up that dividend for franking credits and the number shifts to $10.57. That is not a rounding error; it is a methodology choice, and the gap between those two figures illustrates why understanding the model’s inputs matters more than memorising its formula.
With BOQ trading well below several analyst fair value estimates following a disappointing March 2026 earnings update, retail investors are weighing whether the stock is cheap or structurally impaired. The Dividend Discount Model is the framework most commonly applied by professional analysts to answer that question for income-generating banks. This guide walks through the DDM step by step using BOQ’s actual dividend data, explains how to adjust for franking credits in an Australian context, and shows why small changes in assumptions produce dramatically different valuations, equipping readers to apply the same methodology to any ASX-listed bank.
Banks occupy an unusual position among ASX-listed companies. The majority of their income flows directly to shareholders as dividends rather than being retained for capital-intensive reinvestment. BOQ’s interest income represents 93% of total revenue, a figure that illustrates the earnings predictability underpinning dividend-based valuation. When a company’s cash flows are this heavily channelled toward distributions, the dividend stream itself becomes the most direct measure of value to shareholders.
This is why professional analysts default to dividend discount frameworks for Australian bank valuations. Morningstar, Wilsons Advisory, and income fund managers cited by Livewire Markets all apply DDM to the banking sector, with discount rates typically ranging from 9% to 10.5% depending on bank size and risk profile. The specific variant used most often, and the one this guide applies throughout, is the Gordon Growth Model, which values a stock based on its expected future dividend growing at a constant rate.
Other valuation methods capture different things:
For a stock like BOQ, where shareholders are primarily buying an income stream, the DDM captures the valuation question most directly.
Building a DDM valuation requires three decisions, not one formula. The Gordon Growth Model compresses those decisions into a single equation, but each variable represents a distinct judgment call the investor must make.
Share Price = D / (r – g)
In plain terms: the fair value of a stock equals its expected annual dividend, divided by the gap between the investor’s required return and the rate at which dividends are expected to grow.
The three inputs break down as follows:
One constraint is non-negotiable: g must be lower than r. If the growth rate equals or exceeds the discount rate, the denominator reaches zero or turns negative, producing a nonsensical result. Intuitively, this makes sense: a dividend growing faster than the rate at which it is discounted would imply infinite value, which no stock possesses.
Analysts often use a forecast dividend rather than the last reported payment. Using 35 cents as a conservative forward estimate for BOQ (reflecting the possibility of flat or modestly lower near-term payouts) shifts the base DDM valuation from approximately $7.19 to approximately $7.40 under mid-range assumptions. That difference is small but illustrates how even the starting input involves judgment.
The formula is straightforward. The inputs are not. Professional analysts who use the same Gordon Growth equation reach meaningfully different valuations for BOQ because they disagree, defensibly, about two variables: the discount rate and the dividend growth rate.
The discount rate represents the return an investor requires to compensate for the risk of holding a particular stock. For Australian bank valuations, this is typically derived from a risk-free rate plus an equity risk premium, adjusted for the specific bank’s risk profile.
Regional banks attract a higher discount rate than the major four. According to Wilsons Advisory, “Our dividend discount models for the regionals apply a 10-10.5% cost of equity versus 9-9.5% for the majors.” Income managers cited by Livewire Markets use similar parameters, applying 10% as a base discount rate for BOQ “to reflect higher earnings volatility.”
Wilsons Advisory applies a 10-10.5% cost of equity to regional bank DDM valuations, compared with 9-9.5% for the major banks.
The premium is justified by BOQ’s lower profitability and execution risk. BOQ’s FY25 cash return on equity (ROE) came in at 6.4%, an improvement from 4.7% in FY24 but still roughly half the major bank average of approximately 9.35%. The bank’s ongoing Simplification programme, while targeting long-term efficiency gains, introduces near-term uncertainty that analysts price into a higher required return.
Near-term, most analysts assume flat dividends for BOQ through FY27. Macquarie models “near-zero dividend growth” as the bank invests in technology and remediation. Livewire Markets commentary from December 2025 noted: “We assume a flat dividend for three years for BOQ, then 3-4% per annum long-term growth in our dividend discount frameworks.”
BOQ’s improved ROE of 6.4% slightly strengthens the case for growth assumptions at the higher end of the range. However, the March 2026 earnings disappointment prompted renewed caution. Most analysts treat 3% long-term growth as a best-case ceiling rather than a base assumption.
The sensitivity table below shows how these two variables interact, using BOQ’s FY25 dividend of 38 cents as the fixed input. Each cell represents the DDM fair value estimate under that combination of discount rate and growth rate.
| Growth Rate (g) | r = 9% | r = 10% | r = 10.5% | r = 11% |
|---|---|---|---|---|
| 0% | $4.22 | $3.80 | $3.62 | $3.45 |
| 2% | $5.43 | $4.75 | $4.47 | $4.22 |
| 3% | $6.33 | $5.43 | $5.07 | $4.75 |
| 4% | $7.60 | $6.33 | $5.85 | $5.43 |
The range spans from $3.45 to $7.60 depending entirely on assumption choices. At the 10% discount rate and 3% growth rate that most closely reflect the professional consensus for BOQ, the model produces a fair value of approximately $5.43 using the raw 38 cent historical dividend. Using a forward estimate or adjusting the growth rate by a single percentage point shifts the output materially. This is the DDM’s most important lesson: the valuation is only as credible as the assumptions feeding it.
The calculations above use the cash dividend as declared. For many Australian investors, that understates the actual economic value of a fully franked payment.
Australia’s dividend imputation system means that when a company like BOQ pays a fully franked dividend, it has already paid 30% corporate tax on the profits distributed. Eligible shareholders receive a tax credit (the franking credit) for that amount, which either reduces their tax liability or, for investors in low or zero tax brackets, results in a cash refund from the Australian Taxation Office.
Franking credit refund mechanics vary significantly by investor type: SMSF members in pension phase receive the full credit as a cash payment from the ATO, while investors on higher marginal rates receive a smaller net benefit, which is exactly why the grossed-up DDM input is not a universal substitute for the cash dividend figure.
The ATO’s imputation system guidance sets out the precise rules governing how franking credits attach to dividends and how eligible shareholders claim them as tax offsets, including the refundable credit rules that make fully franked payments so valuable to SMSF members in pension phase.
To capture this in a DDM, the dividend is grossed up to its pre-tax equivalent before being plugged into the formula.
Grossing-up formula: D_gross = D × 1 / (1 – 0.30)
For BOQ: $0.38 × 1 / (1 – 0.30) = approximately $0.543 per share
Applying the Gordon Growth DDM to this grossed-up dividend of 54.3 cents, using a 10% discount rate and 3% growth rate, produces a fair value estimate of approximately $10.57 per share. With BOQ trading at approximately $6.25 as of mid-May 2026, that implies a 41% discount to the franking-adjusted fair value.
For context, Morningstar’s fair value estimate of approximately $10.40 sits in a similar range, though the methodologies are not identical. Readers seeking a foundational explanation of how franking credits work can consult ASIC Moneysmart’s guide on the topic.
The franking-adjusted DDM is not universally applicable. Its relevance depends entirely on the investor’s tax position:
Investors who cannot fully utilise franking credits, including high marginal rate taxpayers and non-residents, should use the raw cash dividend as their D input rather than the grossed-up figure. The appropriate dividend input depends on the individual investor’s tax position, not a universal rule.
A DDM output is a fair value estimate under a specific set of assumptions. It is not a price target, and the gap between BOQ’s current share price and the model’s output only tells an investor something useful if the assumptions behind it are credible.
Several risks sit outside the model’s reach. The DDM assumes a perpetual, smoothly growing dividend stream, which is precisely the element that BOQ’s recent history calls into question.
Dividend trap signals, including a rising yield driven by a falling share price rather than genuine earnings growth, are precisely the pattern the DDM’s sensitivity analysis is designed to expose; when the only scenario that produces a fair value above the current price requires optimistic growth assumptions, the model is flagging risk rather than confirming value.
“If earnings don’t stabilise, the board may have to reconsider the current dividend in the next couple of years.”
— Fund manager quoted by Livewire Markets, approximately 28 March 2026
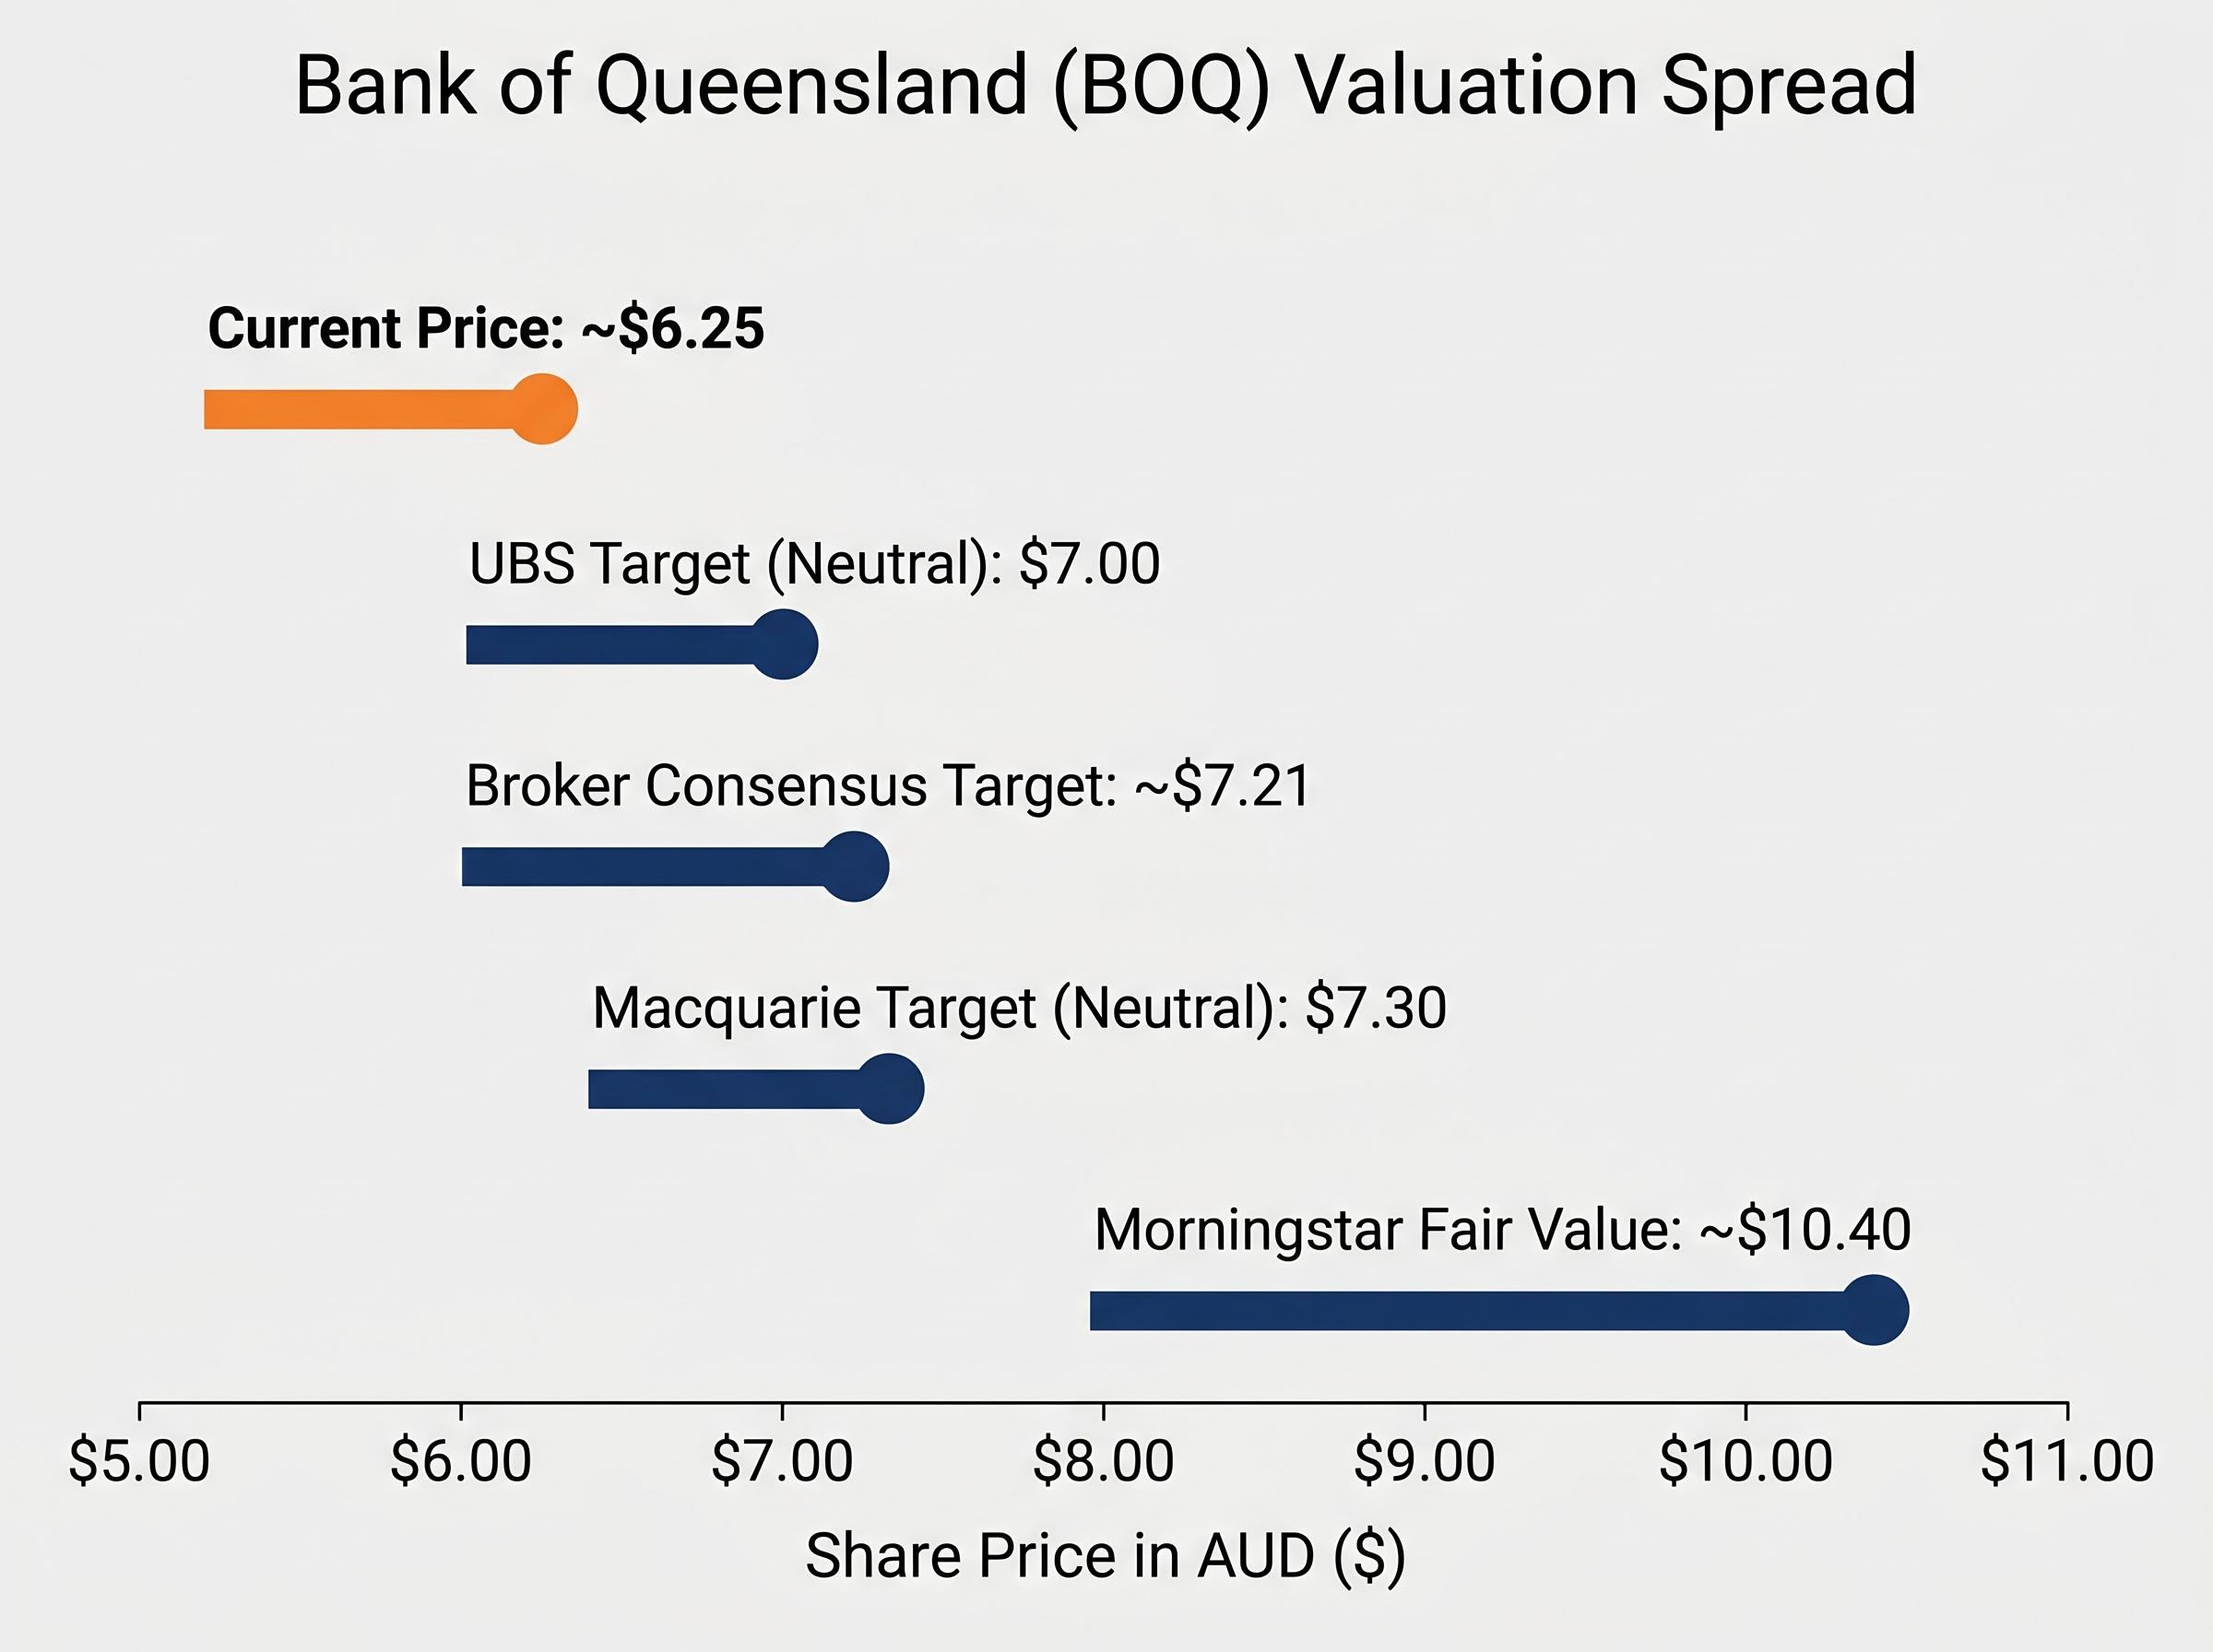
The professional community reflects this uncertainty in its range of valuations. UBS holds a target of $7.00 (Neutral). Macquarie sits at $7.30 (Neutral). The broker consensus target of approximately $7.21 clusters well below Morningstar’s approximately $10.40 fair value estimate. That spread is not an error; it reflects genuinely different weightings of the same risks.
BOQ’s CET1 capital ratio of 10.94% (FY25) sits above APRA’s unquestionably strong benchmark, providing a buffer. But with ROE at 6.4%, roughly half the major bank average, the structural constraint on dividend growth capacity remains the central question any DDM user must confront.
This article is for informational purposes only and should not be considered financial advice. Investors should conduct their own research and consult with financial professionals before making investment decisions.
Past performance does not guarantee future results. Financial projections are subject to market conditions and various risk factors.
The DDM does not produce a single answer. It produces a range shaped by the investor’s own assumptions and tax position. For BOQ, three scenarios bracket the territory:
| Scenario | Dividend Input | Key Assumptions | Estimated Fair Value |
|---|---|---|---|
| Historical dividend, mid-range | 38 cps (FY25 actual) | 10% discount rate, 3% growth | ~$5.43 |
| Forward estimate, mid-range | 35 cps (conservative forward) | 10% discount rate, 3% growth | ~$5.00 |
| Franking-adjusted gross dividend | 54.3 cps (grossed-up) | 10% discount rate, 3% growth | ~$10.57 |
BOQ’s current price of approximately $6.25 sits within this range rather than uniformly below it, a data point worth investigating further rather than a conclusion in itself. The broker consensus target of approximately $7.21 and Morningstar’s fair value estimate of approximately $10.40 provide additional reference points from professionals applying similar frameworks with different assumption sets.
PE and DDM convergence on a similar valuation level carries more analytical weight than either model alone, because two structurally different methods arriving at the same number reduces the probability that the result is driven by a single flawed assumption rather than genuine intrinsic value.
The methodology itself is the lasting takeaway. The same Gordon Growth formula, the same sensitivity logic, and the same franking credit adjustment apply to CBA, ANZ, Bendigo and Adelaide Bank, or any other dividend-paying ASX stock. What changes between applications is the set of assumptions, and the DDM’s greatest value is that it forces those assumptions into the open where they can be examined, debated, and stress-tested.
For investors wanting to stress-test a DDM output against a broader analytical framework, our comprehensive walkthrough of ASX bank valuation methods covers PE, P/B, DDM, and DCF in combination with qualitative factors including management track record, loan book quality, and APRA capital requirements, providing the fuller picture that any single model cannot supply on its own.
The Dividend Discount Model is a framework for making assumptions explicit, not a machine that produces correct prices. Its value lies in the discipline it imposes on the investor’s own thinking.
—
The Dividend Discount Model (DDM) values a stock by calculating the present value of all future dividends it is expected to pay. It suits bank stocks particularly well because banks distribute the majority of their earnings as dividends rather than retaining them for capital-intensive reinvestment.
To adjust for franking credits, you gross up the cash dividend to its pre-tax equivalent using the formula: D_gross = D multiplied by 1 divided by (1 minus 0.30). For BOQ's 38 cent FY25 dividend, this produces a grossed-up figure of approximately 54.3 cents per share, which is then used as the dividend input in the Gordon Growth Model.
Professional analysts such as Wilsons Advisory apply a cost of equity of 10-10.5% for regional Australian banks like BOQ, compared with 9-9.5% for the major four banks, to reflect higher earnings volatility and lower profitability.
The DDM output is highly sensitive to the discount rate and dividend growth rate assumptions; for BOQ, changing these two inputs produces fair value estimates ranging from $3.45 to $7.60 using the raw cash dividend, and up to $10.57 when the dividend is grossed up for franking credits.
The DDM assumes a perpetual, smoothly growing dividend stream and cannot account for BOQ-specific risks such as the March 2026 earnings disappointment, potential dividend cuts if earnings do not stabilise, net interest margin compression, and execution risk from the ongoing core banking platform migration.