Iran Shuts Hormuz, Threatening 20% of Global Oil Supply
4 hrs ago
A 133-percentage-point gap has opened between the best and worst-performing technology stocks in 2026, the widest dispersion on record in Morningstar’s dataset as of 13 May 2026. This is not a statistical curiosity. It is the clearest signal yet that AI infrastructure spending is splitting the technology sector into distinct winners and losers, with AI hardware stocks and semiconductor names capturing the bulk of upside while software firms absorb the damage. The timing sharpens the stakes: Nvidia’s Q1 FY2027 earnings are due 20 May 2026, offering the next major data point on whether the demand thesis still holds. What follows is a breakdown of which hardware and semiconductor sub-sectors are leading, the specific companies driving returns, the 2028 demand-peak thesis underpinning the bull case, and the supply-normalisation risk that could reverse it.
The numbers land before the explanation does.
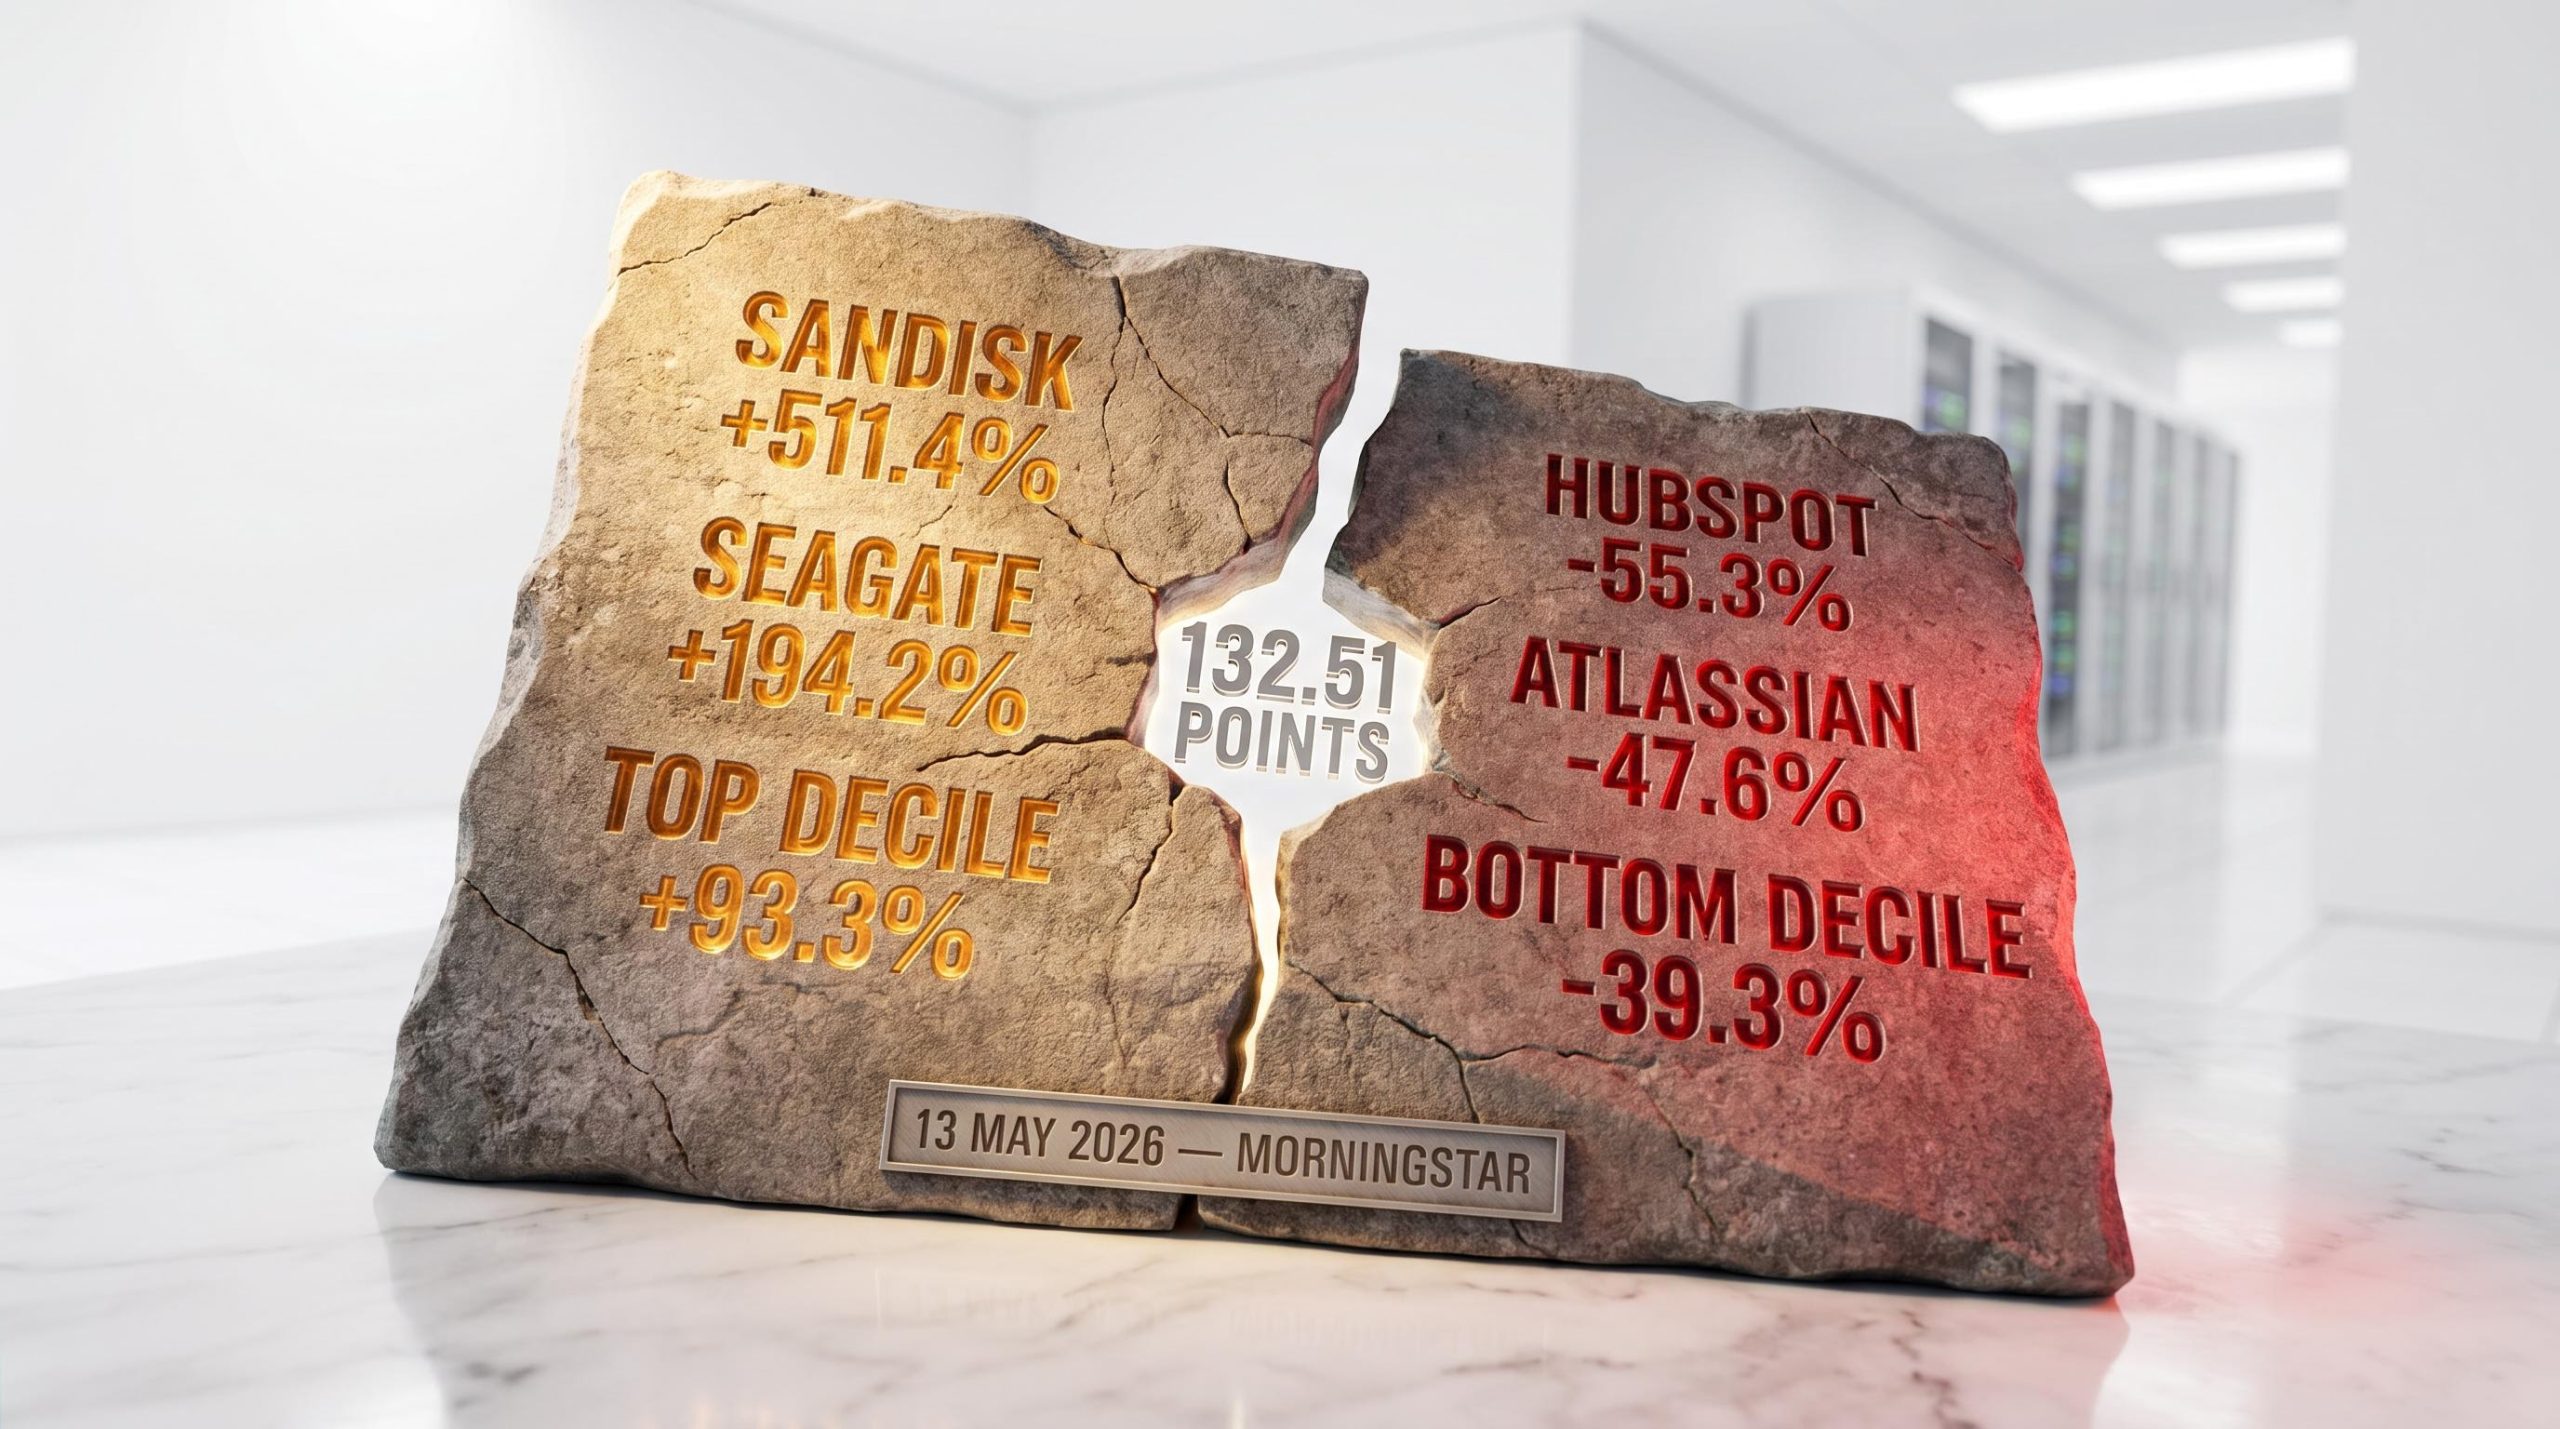
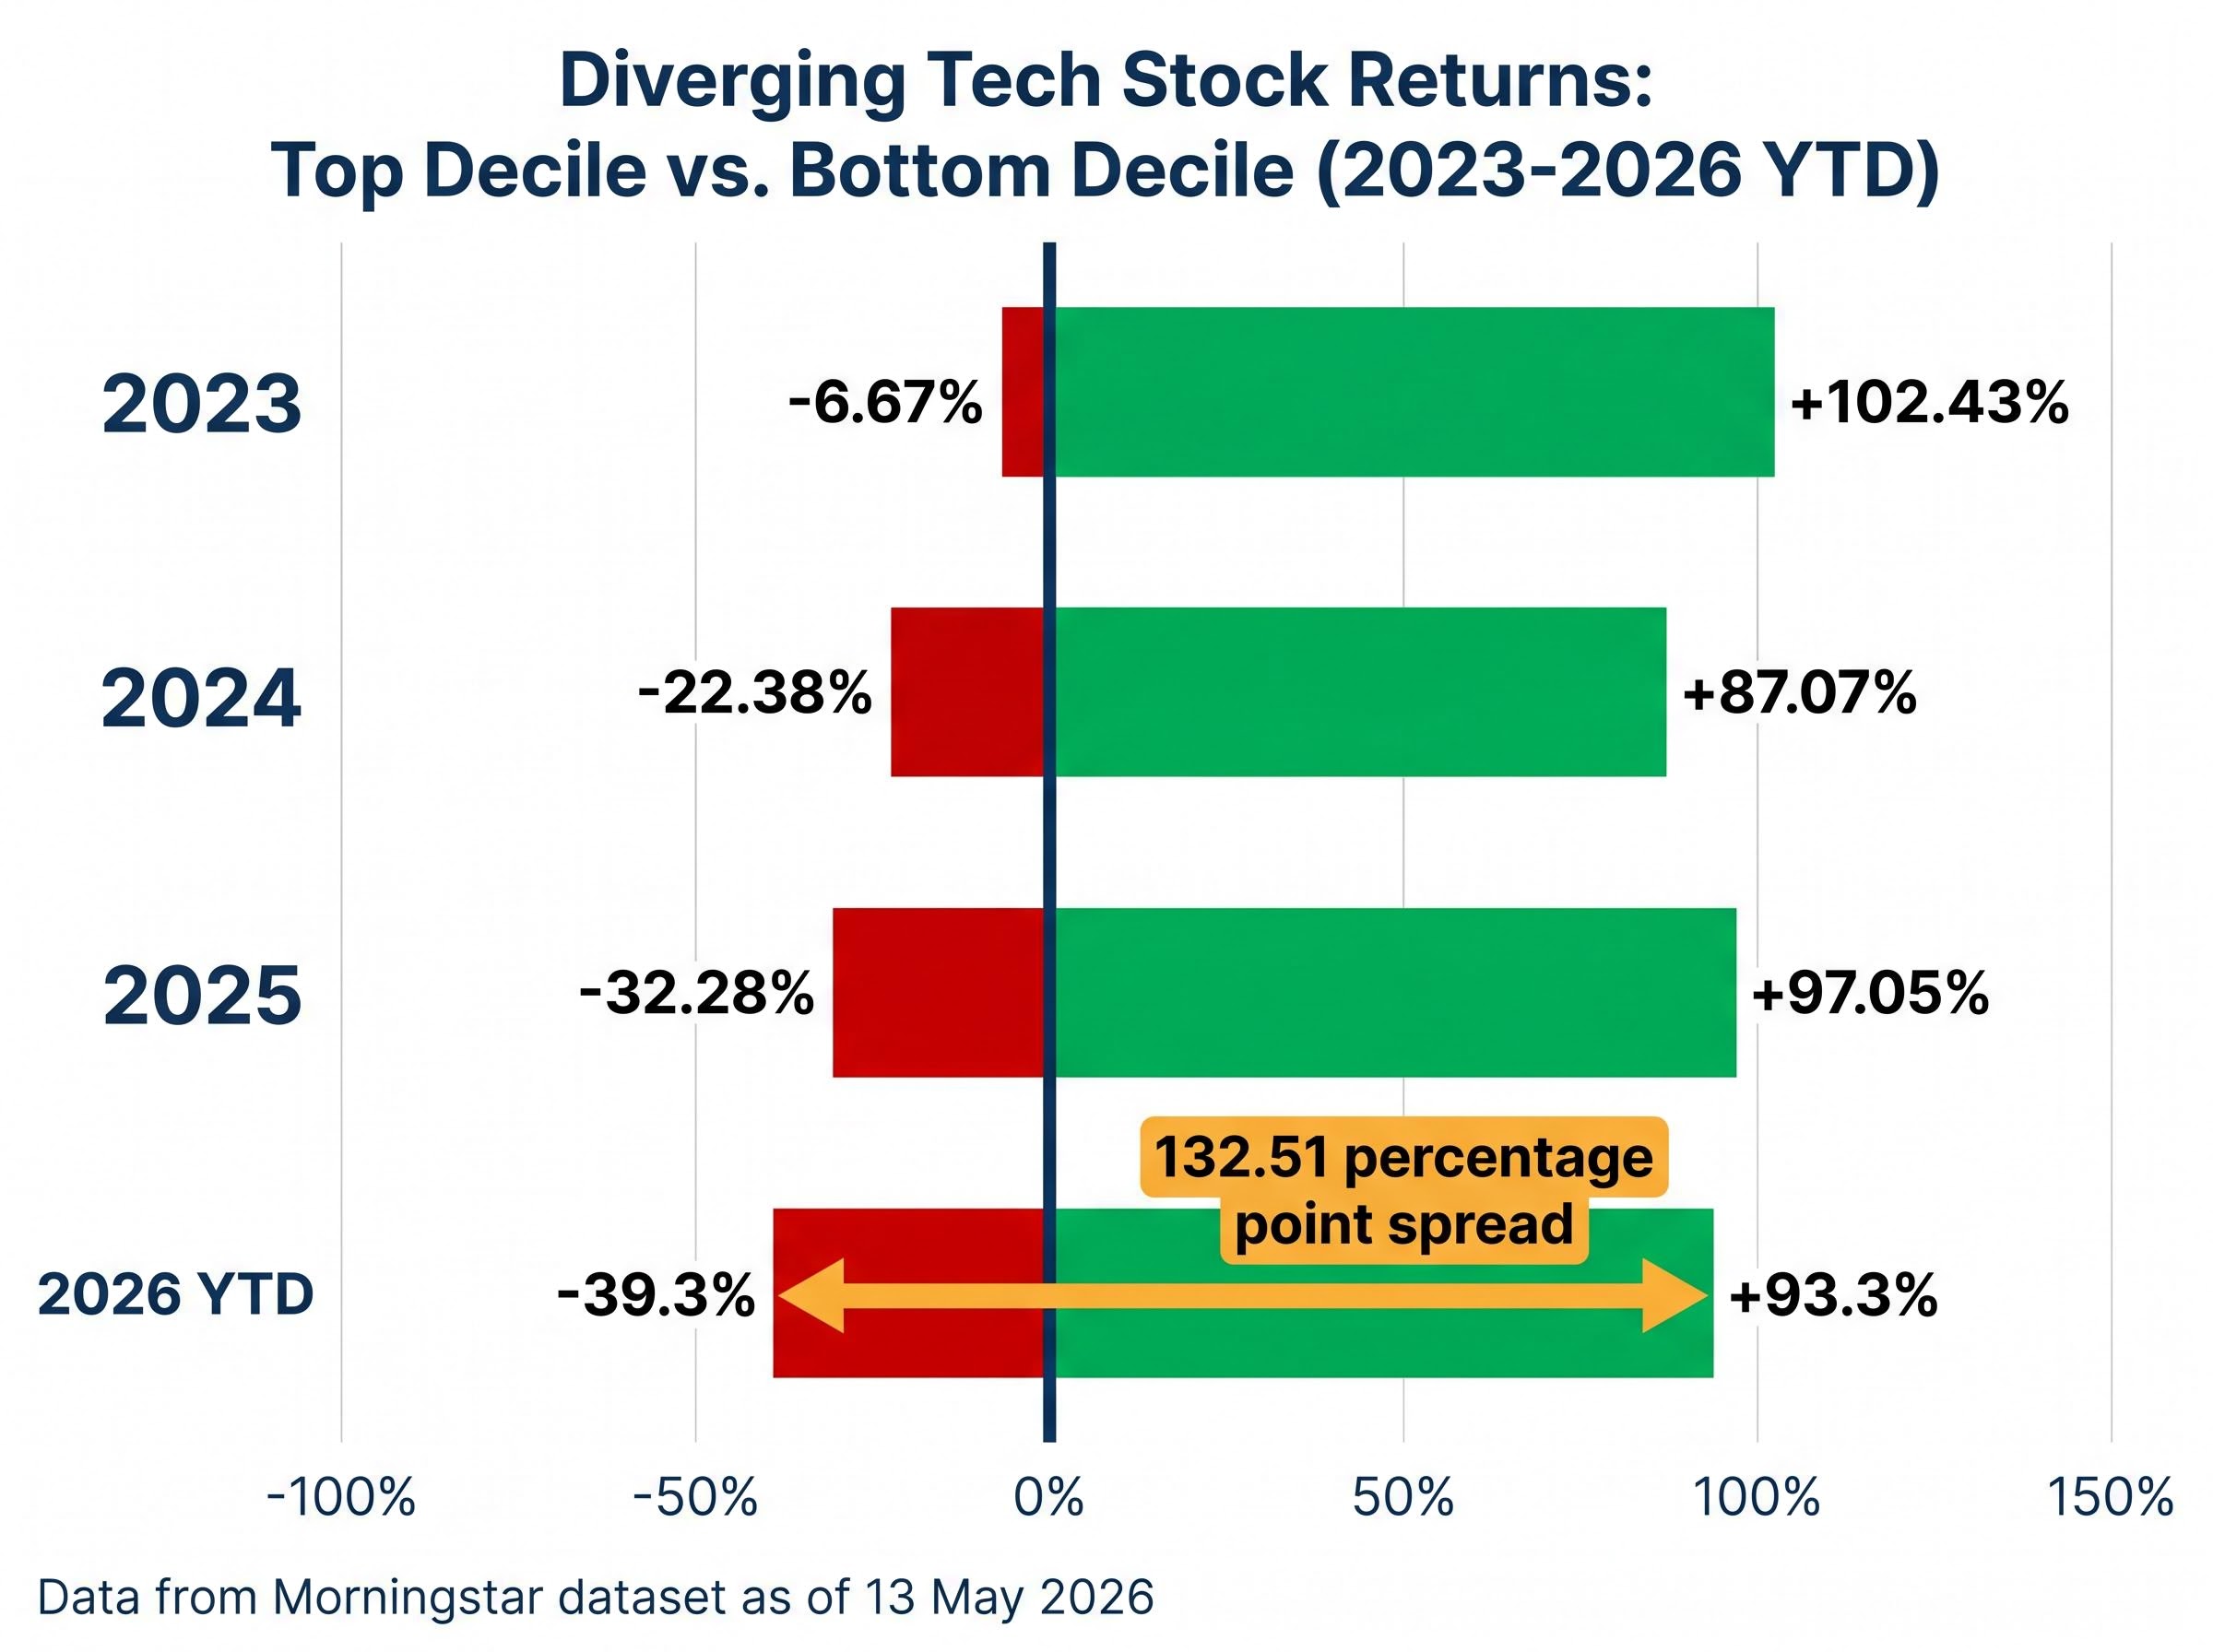
132.51 percentage points. That is the spread between the top and bottom deciles of technology stock returns year-to-date as of 13 May 2026, the largest dispersion in Morningstar’s dataset.
The top decile of technology stocks averaged a 93.3% year-to-date return. The bottom decile averaged a decline of 39.3%, the weakest reading since 2022. Those two figures sit in the same sector, measured over the same five months.
This gap has been widening progressively since 2021, with the current spread roughly double the level observed three years prior. The historical trajectory makes the acceleration visible.
| Year | Top Decile Return | Bottom Decile Return |
|---|---|---|
| 2023 | 102.43% | -6.67% |
| 2024 | 87.07% | -22.38% |
| 2025 | 97.05% | -32.28% |
| 2026 YTD | 93.3% | -39.3% |
The top decile has remained broadly consistent across four years. It is the bottom decile that has deteriorated sharply, falling from -6.67% in 2023 to -39.3% in 2026. For investors holding a broad technology fund or index product, the implication is direct: average tech returns in 2026 are masking a bifurcated market where sub-sector selection, not sector allocation, is the decisive variable. Dave Sekera, Morningstar’s Chief US Market Strategist, published the dispersion data on 13 May 2026.
The demand engine is not abstract. It carries a combined price tag.
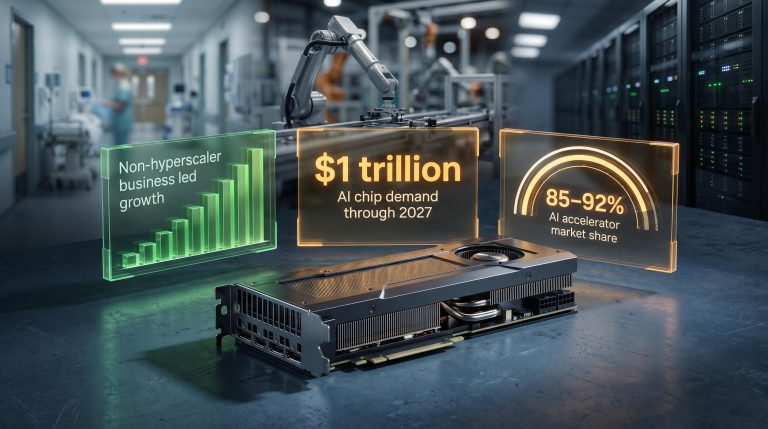
Together, these four hyperscalers issued combined capex guidance of approximately $725 billion for 2026 during their Q1 2026 earnings releases. That figure represents the single largest coordinated infrastructure spending commitment in the technology sector’s history, and the spending is overwhelmingly directed at data centre buildout.
The link between those capital expenditure plans and hardware stock prices is mechanical rather than speculative. Data centre construction creates direct pull-through demand for NAND flash storage, hard disk drives, and server memory components. As that demand has outpaced supply, pricing power has shifted toward hardware manufacturers, allowing expanding operating margins to amplify returns beyond what revenue growth alone would deliver.
The current AI investment cycle has already surpassed every prior technology spending peak as a share of US GDP, with Q1 2026 IT hardware and software outlays reaching 4.9% of GDP, eclipsing both the dot-com era peak of approximately 4.2% and the cloud buildout peak of approximately 3.8%, a macro backdrop that provides structural context for the hardware returns playing out at the stock level.
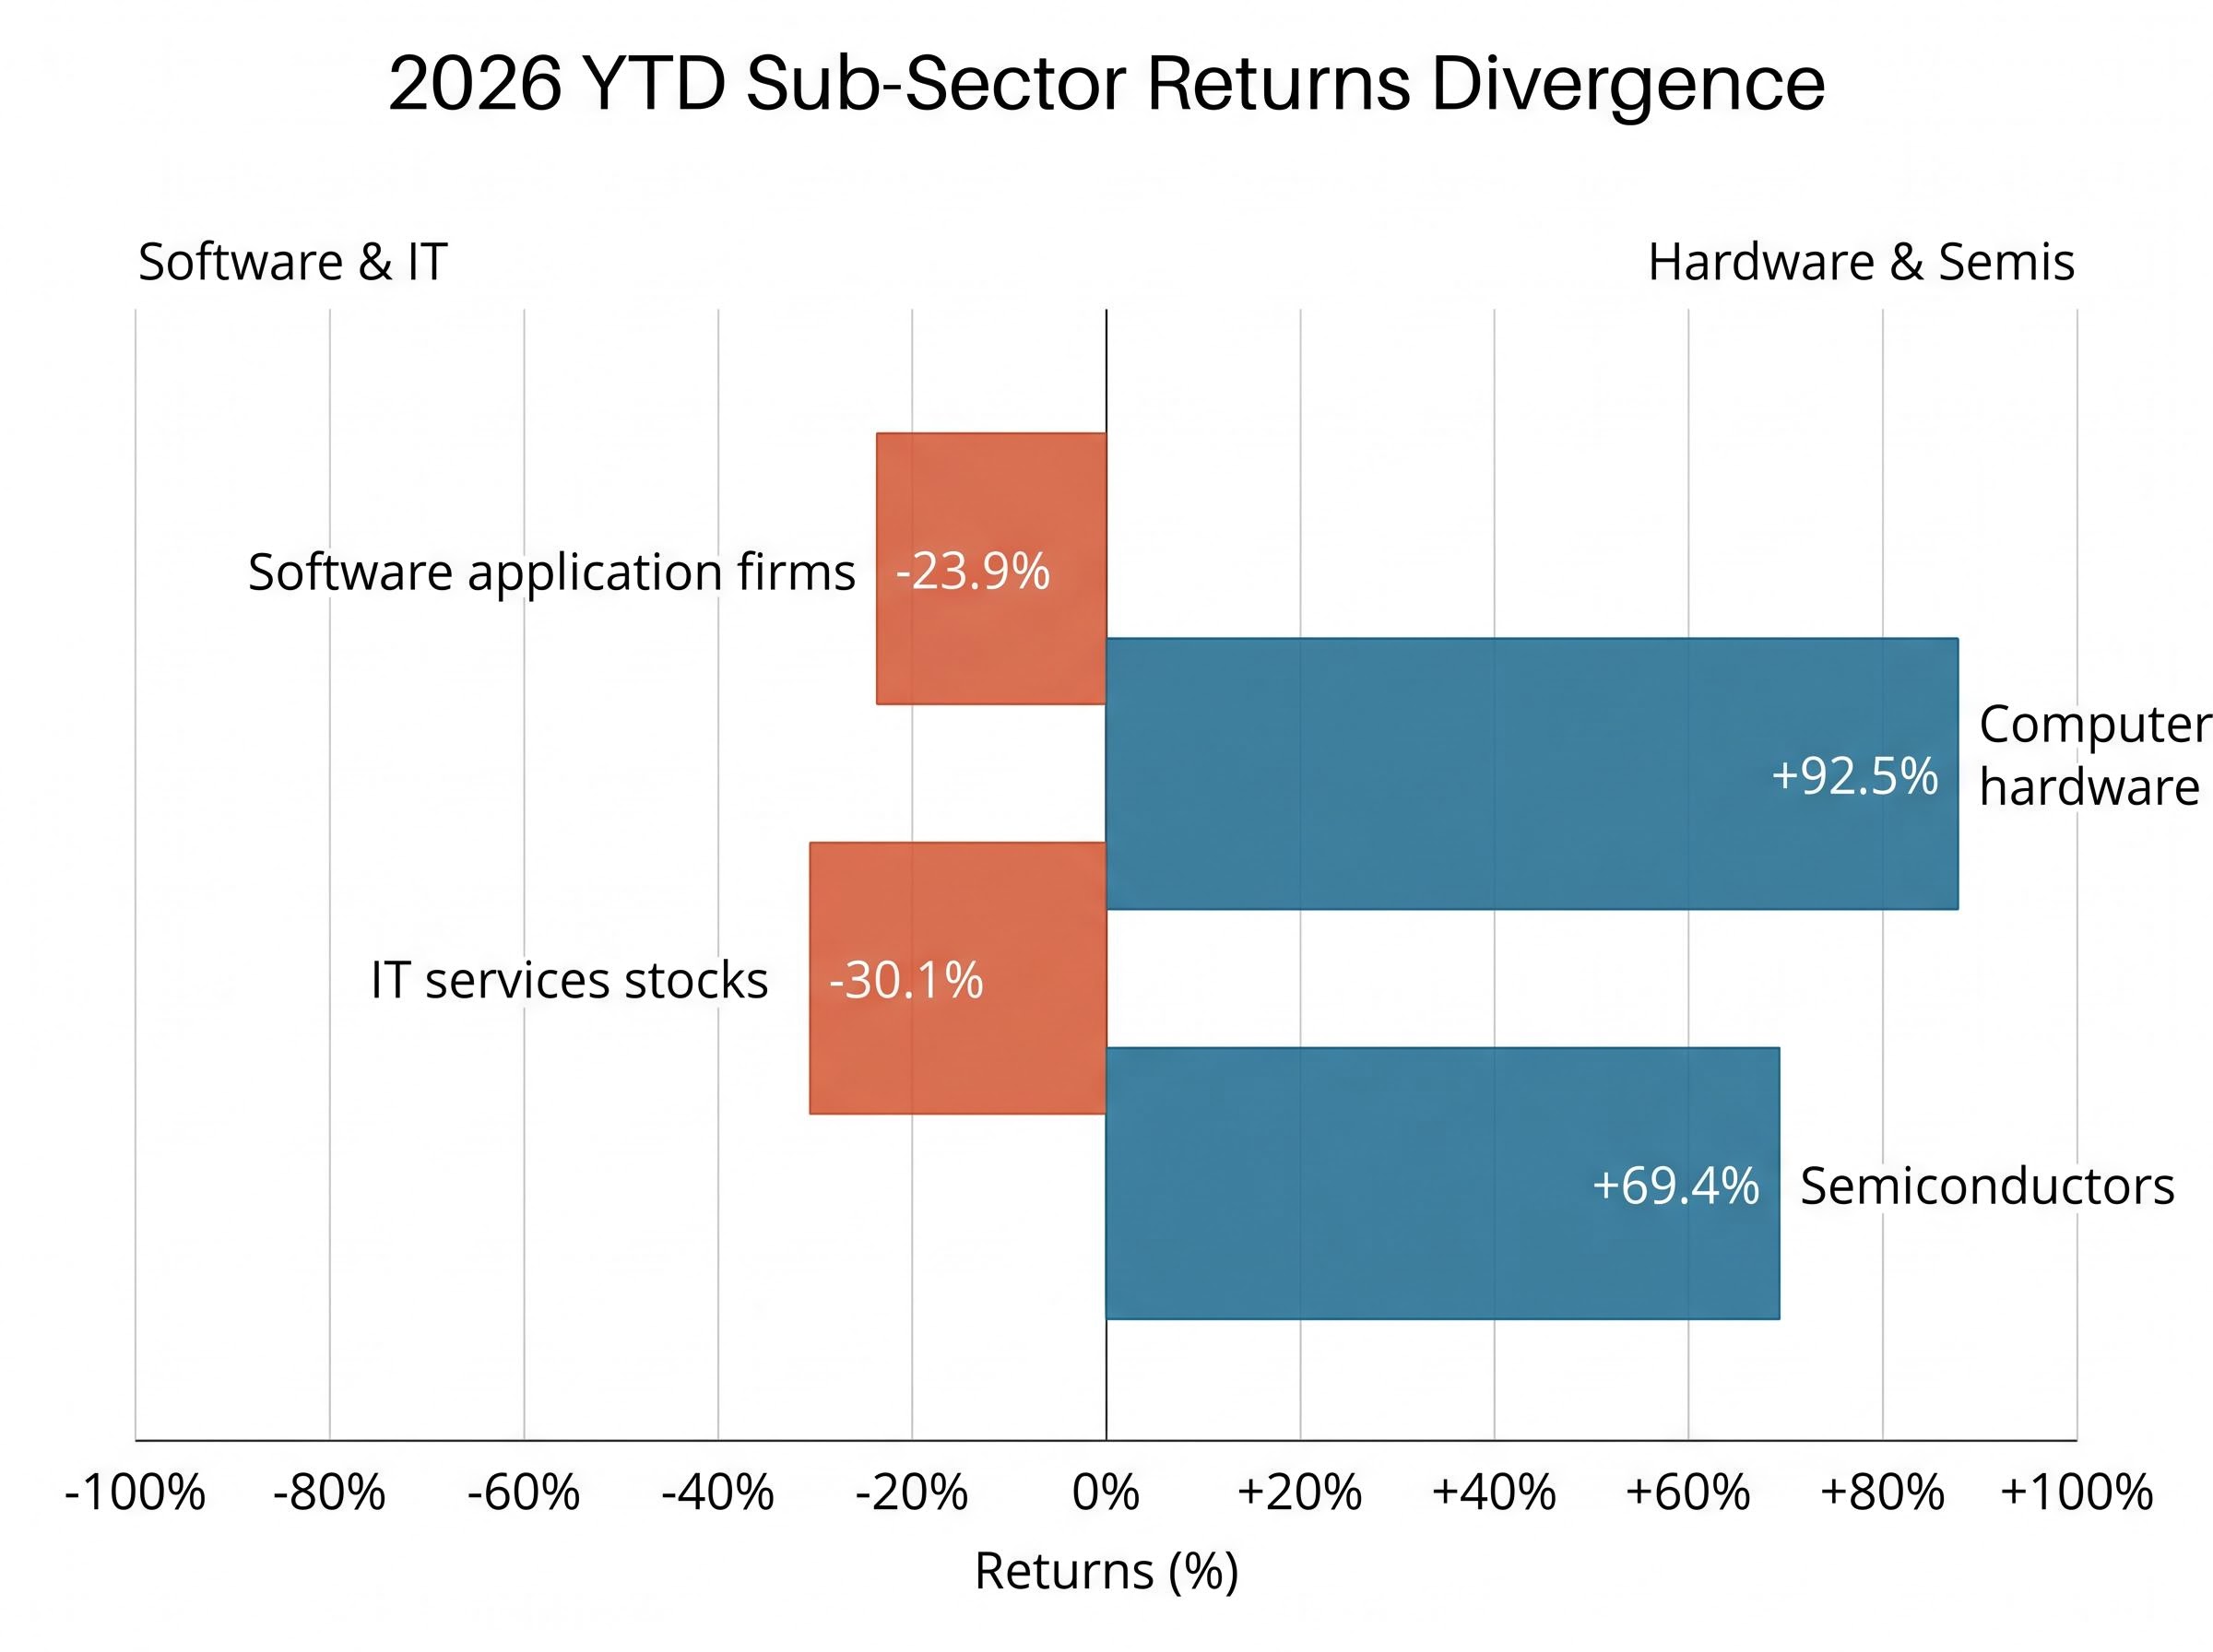
The results are visible in the data. Computer hardware stocks averaged 92.5% year-to-date returns in 2026, exceeding 2025 by more than 20 percentage points and sitting well above the 2020-2025 five-year average of 82.7%, according to Morningstar data published 11 May 2026.
Intel delivered a Q1 2026 revenue beat on persistent server processor demand, as noted by Morningstar analyst Brian Colello. Nvidia’s Q1 FY2027 results, scheduled for 20 May 2026, represent the next inflection point. As the dominant supplier of AI training and inference chips, Nvidia’s forward guidance will function as a barometer for whether hyperscaler spending intentions are holding, accelerating, or showing early signs of moderation.
The hardware rally is concentrated, not uniform. The sub-sector hierarchy as of 11 May 2026, based on Morningstar data, reveals where the capital has flowed.
| Sub-sector | 2026 YTD Return | 2020-2025 Five-Year Average |
|---|---|---|
| Computer hardware | 92.5% | 82.7% |
| Semiconductor equipment & materials | 76.6% | Five-year avg |
| Electronics & computer distribution | 69.6% | Five-year avg |
| Semiconductors | 69.4% | 33.4% |
| Communication equipment | 52.8% | Five-year avg |
| Electronic components | 52.3% | Five-year avg |
| Scientific & technical instruments | 31.1% | Five-year avg |
Three of the top five individual technology performers year-to-date are computer hardware companies. Storage-focused firms occupy three of the top four positions overall. The individual stock leaders as of 12 May 2026:
The selectivity matters. Approximately 7% of hardware and semiconductor stocks remain in negative territory year-to-date, a reminder that even within the winning segment, stock selection carries real risk. Investors evaluating their hardware exposure should examine whether their positions are concentrated in the highest-returning storage and memory names or distributed across the broader category.
The bull case for AI hardware stocks rests on a specific timeline, and understanding that timeline determines whether current valuations look stretched or justified.
Dave Sekera, Morningstar’s Chief US Market Strategist, has projected that AI infrastructure buildout is expected to reach its maximum rate of hardware absorption around 2028, after which the pace of new demand creation is forecast to slow.
The concept requires a distinction that many investors overlook.
The difference between these two outcomes is significant for position sizing. A rate-of-change inflection (a peak) may compress returns from exceptional to moderate. A collapse would reverse them entirely.
Sekera has cited a projected shortage of commodity-oriented hardware over the next several years as a primary driver of elevated stock forecasts. The market appears to agree. Semiconductor stocks averaged 69.4% returns in 2026 versus a five-year average of 33.4%, indicating that prices already reflect above-average demand duration. Investors entering these positions today are not buying at the start of the recognition cycle; they are buying into a thesis the market has been pricing for multiple quarters.
The capex-to-revenue lag in AI infrastructure, estimated at 18-24 months by Morningstar analyst Dennis Li, creates a specific timing risk for semiconductor positions: spending commitments translate into hardware orders immediately, but the revenue justification for those orders only materialises as cloud customers monetise their AI deployments, leaving a window in which hardware demand could moderate before commercial AI revenues validate the investment thesis.
The hardware bull case is analytically strong. So is the counterargument.
Morningstar has issued an explicit warning that commodity-oriented hardware companies face the greatest downside risk once supply catches up to demand, with the potential for sharp price declines in that scenario.
This is the structural vulnerability in the trade. Storage manufacturers like Sandisk, Seagate, and Western Digital are benefiting from a demand-supply imbalance that is, by its nature, temporary. When NAND flash and HDD production capacity expands sufficiently to meet AI-driven demand, pricing power reverses and margins compress. The timing is uncertain; the direction is not.
Supply chain bottlenecks, particularly in memory and power infrastructure, are already constraining the rate at which approved capital budgets can actually be deployed, a friction that has so far extended the shortage window for hardware suppliers but introduces a second-order risk: if bottlenecks resolve faster than the market expects, the supply normalisation that compresses margins could arrive earlier than the 2028 demand-peak timeline suggests.
The contrast with the software sector sharpens the risk picture. Sekera has characterised the current software selloff as an overreaction, expecting those companies to adapt by embedding AI capabilities into their existing products rather than being displaced by them. The numbers illustrate the divergence:
Software application firms have declined 23.9% year-to-date against a five-year average gain of 27%. IT services stocks have fallen 30.1% against a five-year average gain of 10.6%. If Sekera’s thesis on software resilience proves correct, mean reversion in those names could shift relative positioning between hardware and software over the next 12-18 months.
The 7% of hardware and semiconductor stocks already in negative territory serves as a reminder that selectivity matters even within the leading segment.
The evidence across the preceding sections converges on three decision points for investors evaluating AI hardware exposure.
Investors preparing for the 20 May release will find our deep-dive into the Nvidia metrics that matter most, which identifies the three forward-looking figures that will determine whether analyst estimate revisions move bullish or bearish across the hardware complex, including Blackwell ramp guidance, Q2 FY2027 revenue outlook language, and management commentary on China revenue given the unresolved export control environment.
Microsoft’s share price offers a useful illustration of the headline-versus-reality gap. The stock has declined 15.5% year-to-date despite a Q1 2026 revenue beat and strong AI-related demand, as noted by Morningstar analyst Dan Romanoff. The index-level drag from software is real, and it obscures the hardware story for investors relying solely on sector-level benchmarks.
The core tension is clear. AI infrastructure demand is documented in $725 billion of hyperscaler capex commitments. The 2028 demand-peak thesis gives investors a multi-year window before the rate of new demand creation decelerates. Storage and semiconductor stocks have delivered returns that are multiples of their five-year averages.
Current stock prices in hardware already reflect significant forward optimism. Entry timing and position sizing are now the variables that determine outcomes, not the direction of the trade itself.
The selectivity message bears repeating: broad technology index exposure is not capturing this rally cleanly. The investor who wants to participate in the AI hardware cycle needs deliberate sub-sector and company-level positioning, with a clear distinction between commodity suppliers riding a temporary shortage and companies whose competitive advantages extend beyond the current cycle.
What Nvidia reports on 20 May will shape the next phase. Demand momentum, analyst estimate revisions, and hyperscaler spending intentions will all be visible in a single earnings release. The data arrives in two days.
This article is for informational purposes only and should not be considered financial advice. Investors should conduct their own research and consult with financial professionals before making investment decisions. Past performance does not guarantee future results. Financial projections are subject to market conditions and various risk factors.
AI hardware stocks are companies that manufacture the physical components powering artificial intelligence infrastructure, including chips, storage devices, and server processors. In 2026, they are outperforming because four major hyperscalers (Microsoft, Amazon, Google, and Meta) committed approximately $725 billion in combined capex to data centre buildout, creating direct demand for storage and semiconductor products that has outpaced supply and expanded margins.
As of 12 May 2026, Sandisk (SNDK) leads with a 511.4% year-to-date return, followed by Intel (INTC) at over 225%, Seagate Technology (STX) at 194.2%, and Western Digital (WDC) at 183.8%, with storage-focused firms occupying three of the top four positions.
The 2028 demand-peak thesis, cited by Morningstar's Chief US Market Strategist Dave Sekera, projects that AI infrastructure buildout will reach its maximum rate of hardware absorption around 2028, after which the pace of new demand creation is forecast to slow. This is not a demand collapse but a deceleration, meaning orders continue at a diminishing rate rather than contracting sharply.
The primary risk is supply normalisation: storage manufacturers like Sandisk, Seagate, and Western Digital are benefiting from a demand-supply imbalance that is temporary, and when NAND flash and HDD production capacity expands to meet AI-driven demand, pricing power will reverse and margins will compress. Morningstar has explicitly warned that commodity-oriented hardware companies face the greatest downside risk in that scenario.
The Morningstar US Technology Index is down approximately 15.5% year-to-date as of 12 May 2026 because sharp declines in software stocks, with names like HubSpot down 55.3% and Atlassian down 47.6%, are dragging the index lower even as hardware names surge. Deliberate sub-sector and company-level positioning is required to participate in the hardware rally rather than relying on broad sector allocation.