
How to Assess Australian Bank Stocks Beyond the PE Ratio
17 mins ago

The April 2026 jobs report landed on 2 May with a number that should have, by the most popular version of market logic, sent stocks lower. Nonfarm payrolls rose 177,000. Private-sector hiring more than doubled the consensus forecast. Unemployment held steady at 4.3%. The familiar chain of reasoning appeared within hours: strong jobs mean the Federal Reserve has no reason to cut rates, and without rate cuts, stocks should struggle. The S&P 500 total return index hit another record high anyway. The disconnect between that logic and what actually happened is not a one-off anomaly. It is a pattern, and it reveals something important about how jobs data, Fed policy, and equity markets actually relate to one another. What follows is an explanation of why the relationship between the jobs report and the stock market is weaker, messier, and less useful for investment decisions than most investors assume.
The headline number was strong by any reasonable standard. Total nonfarm payrolls rose 177,000 in April 2026, and the March figure was revised upward to 185,000, marking the first two-month consecutive gain since May 2025.
The sectoral breakdown told a broad-based story:
Private-sector hiring came in at 123,000, more than double the 59,000 economists had forecast.
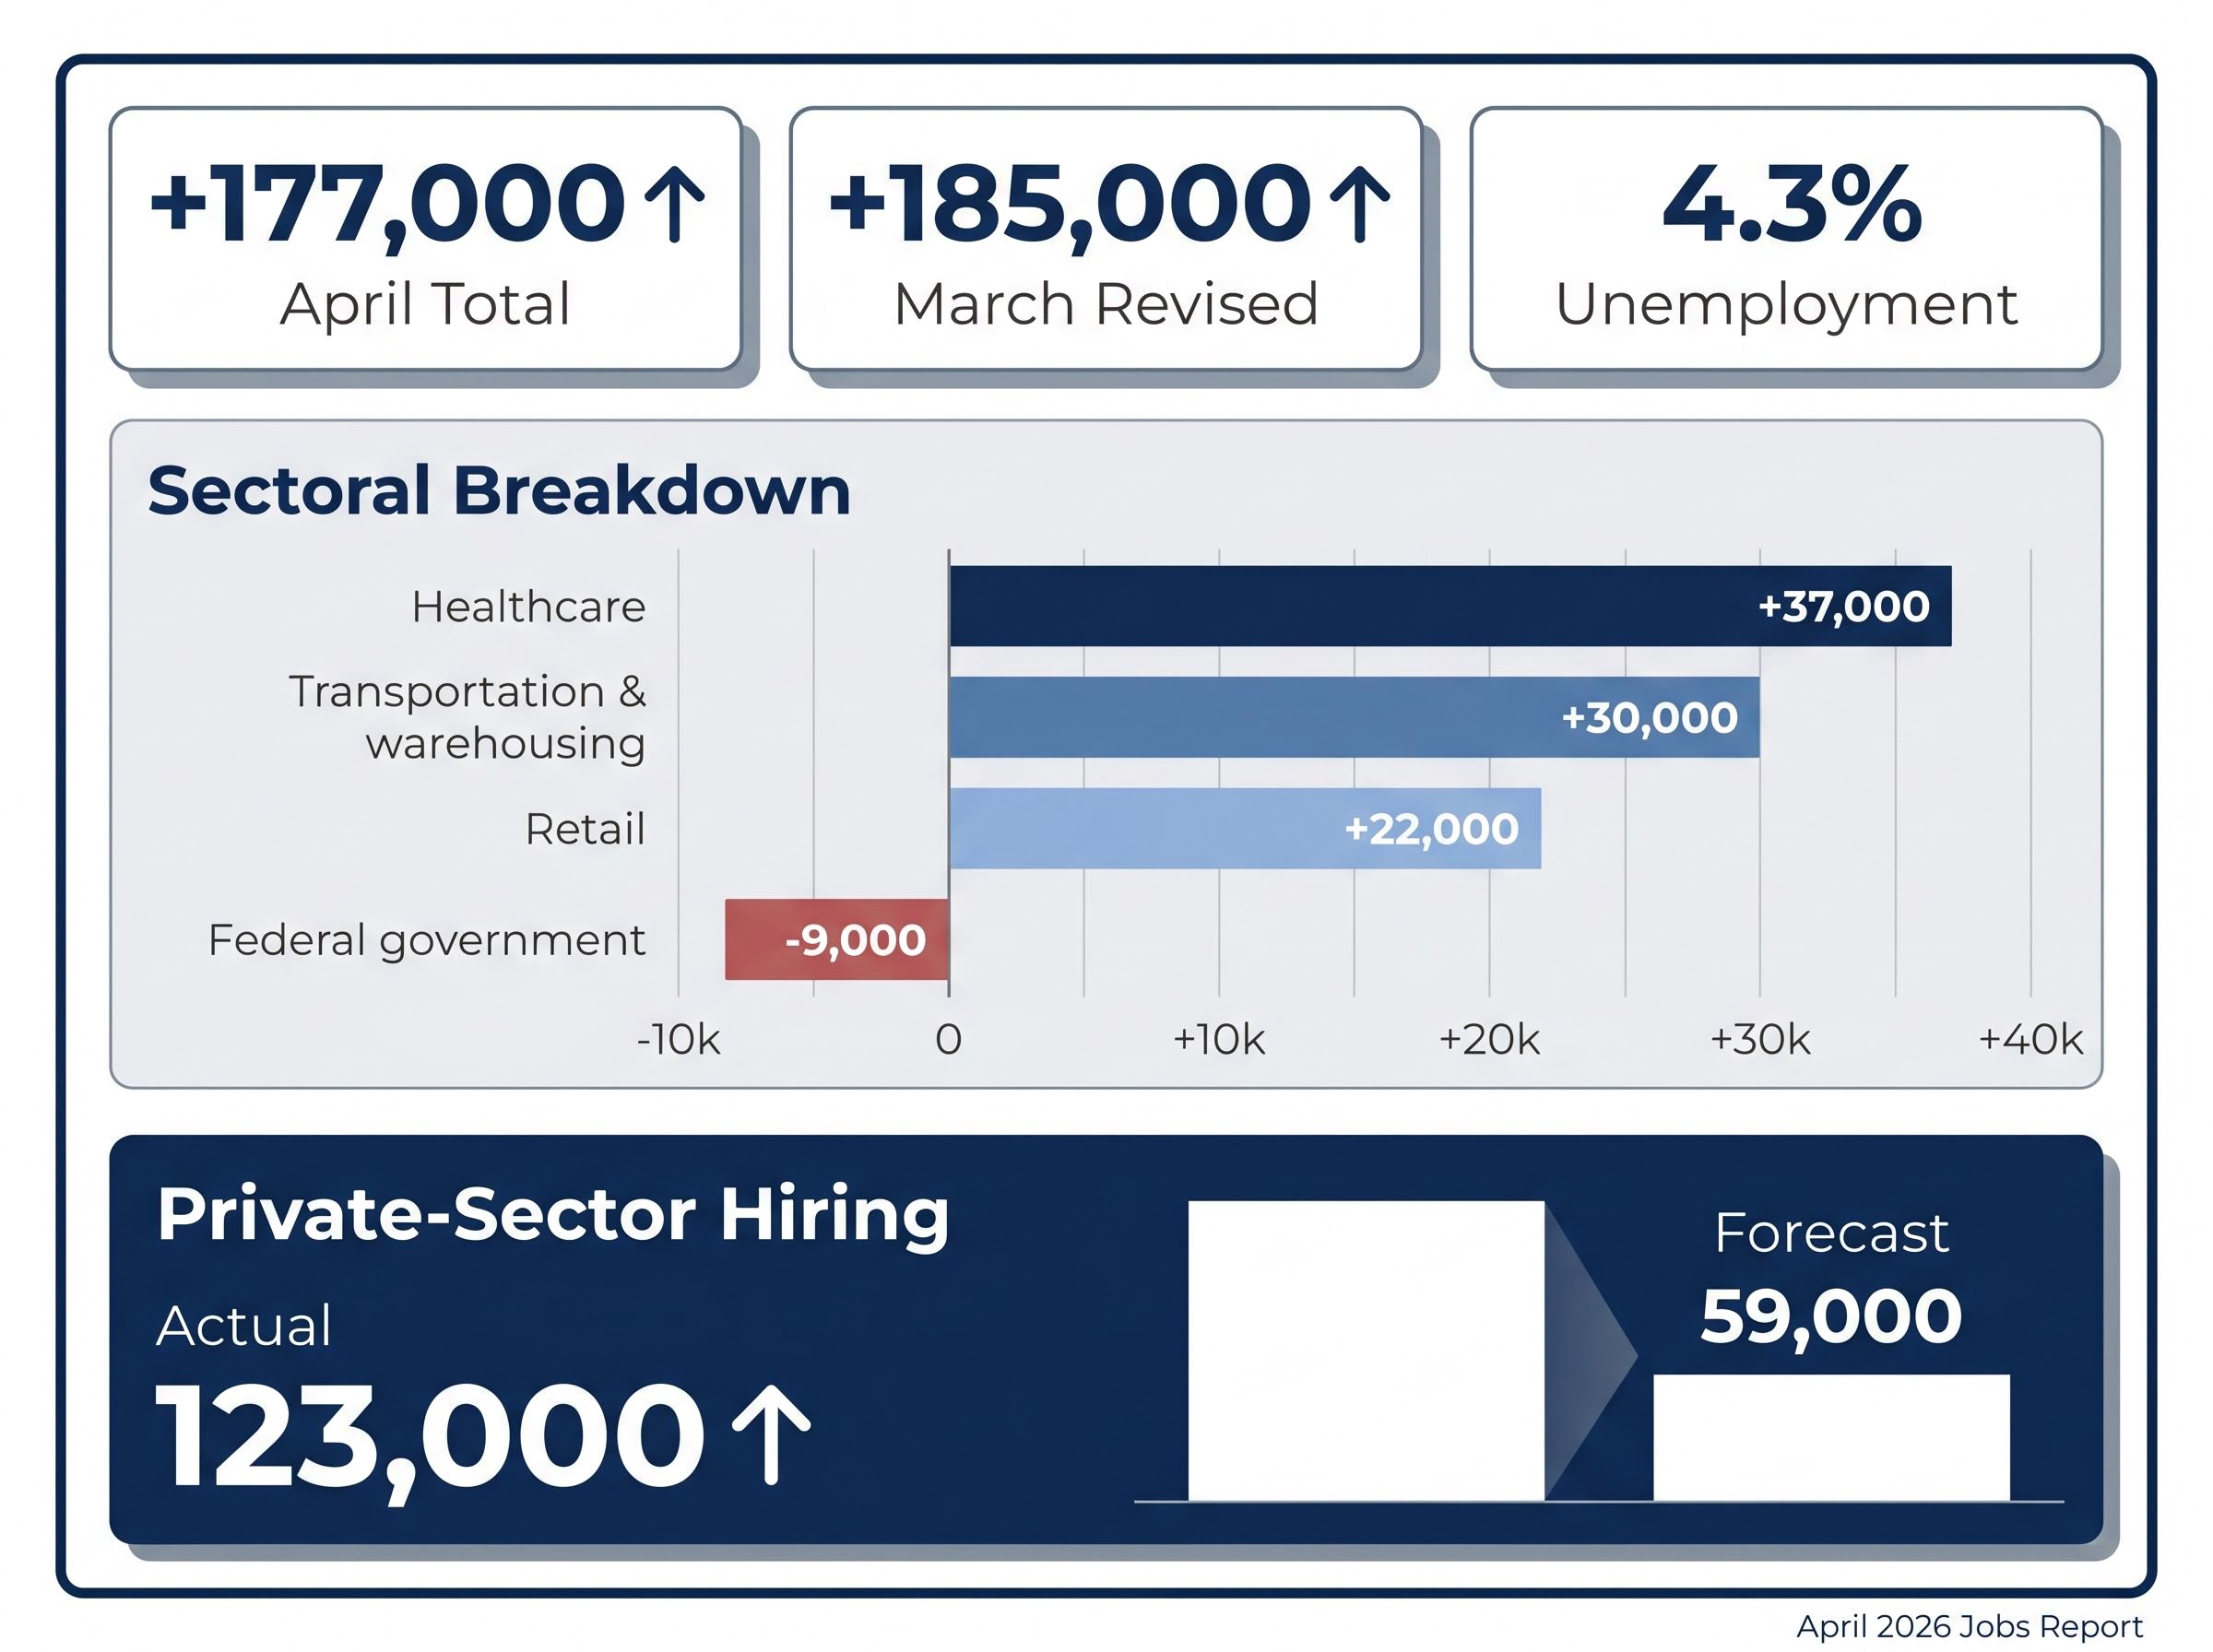
Unemployment held at 4.3%, and the S&P 500 total return index stood at record highs as of 12 May 2026, per FactSet.
Two narratives emerged from the same data. One camp argued the strength ruled out rate cuts, making the report bearish for equities. The other pointed to the record highs and shrugged. Both sides cited the same numbers. That interpretive split is the problem this article addresses.
The April headline number also obscured a sharp deterioration in labour market quality: involuntary part-time employment surged by 445,000 to 4.9 million, and both ISM Manufacturing Employment and ISM Services Employment remained in contraction simultaneously, removing the services buffer that had previously offset goods-sector weakness.
The logic of hiring runs in one direction, and it is not the direction most investors assume. A company does not hire workers because it expects growth to happen. It hires workers because growth has already happened and existing staff cannot keep up. The decision to post a job, interview candidates, extend offers, and onboard new employees follows demand; it does not anticipate it.
The reverse is equally true. Layoffs arrive after revenue has already declined, after margins have compressed, and after management has exhausted alternatives. By the time job cuts appear in the Bureau of Labor Statistics release, the economic damage that caused them is months old.
This pattern was visible in the April data itself. Most private service-sector categories expanded through April 2026, while manufacturing and mining continued contracting, partly attributed to tariff uncertainty. The jobs data confirmed conditions the market had been pricing for months.
Economists sort indicators into three categories. Leading indicators move before the economy turns; examples include ISM new orders and credit spreads. Coincident indicators move with the economy in real time; industrial production is one. Lagging indicators move after the turn has already occurred, and payrolls sit squarely in this third group.
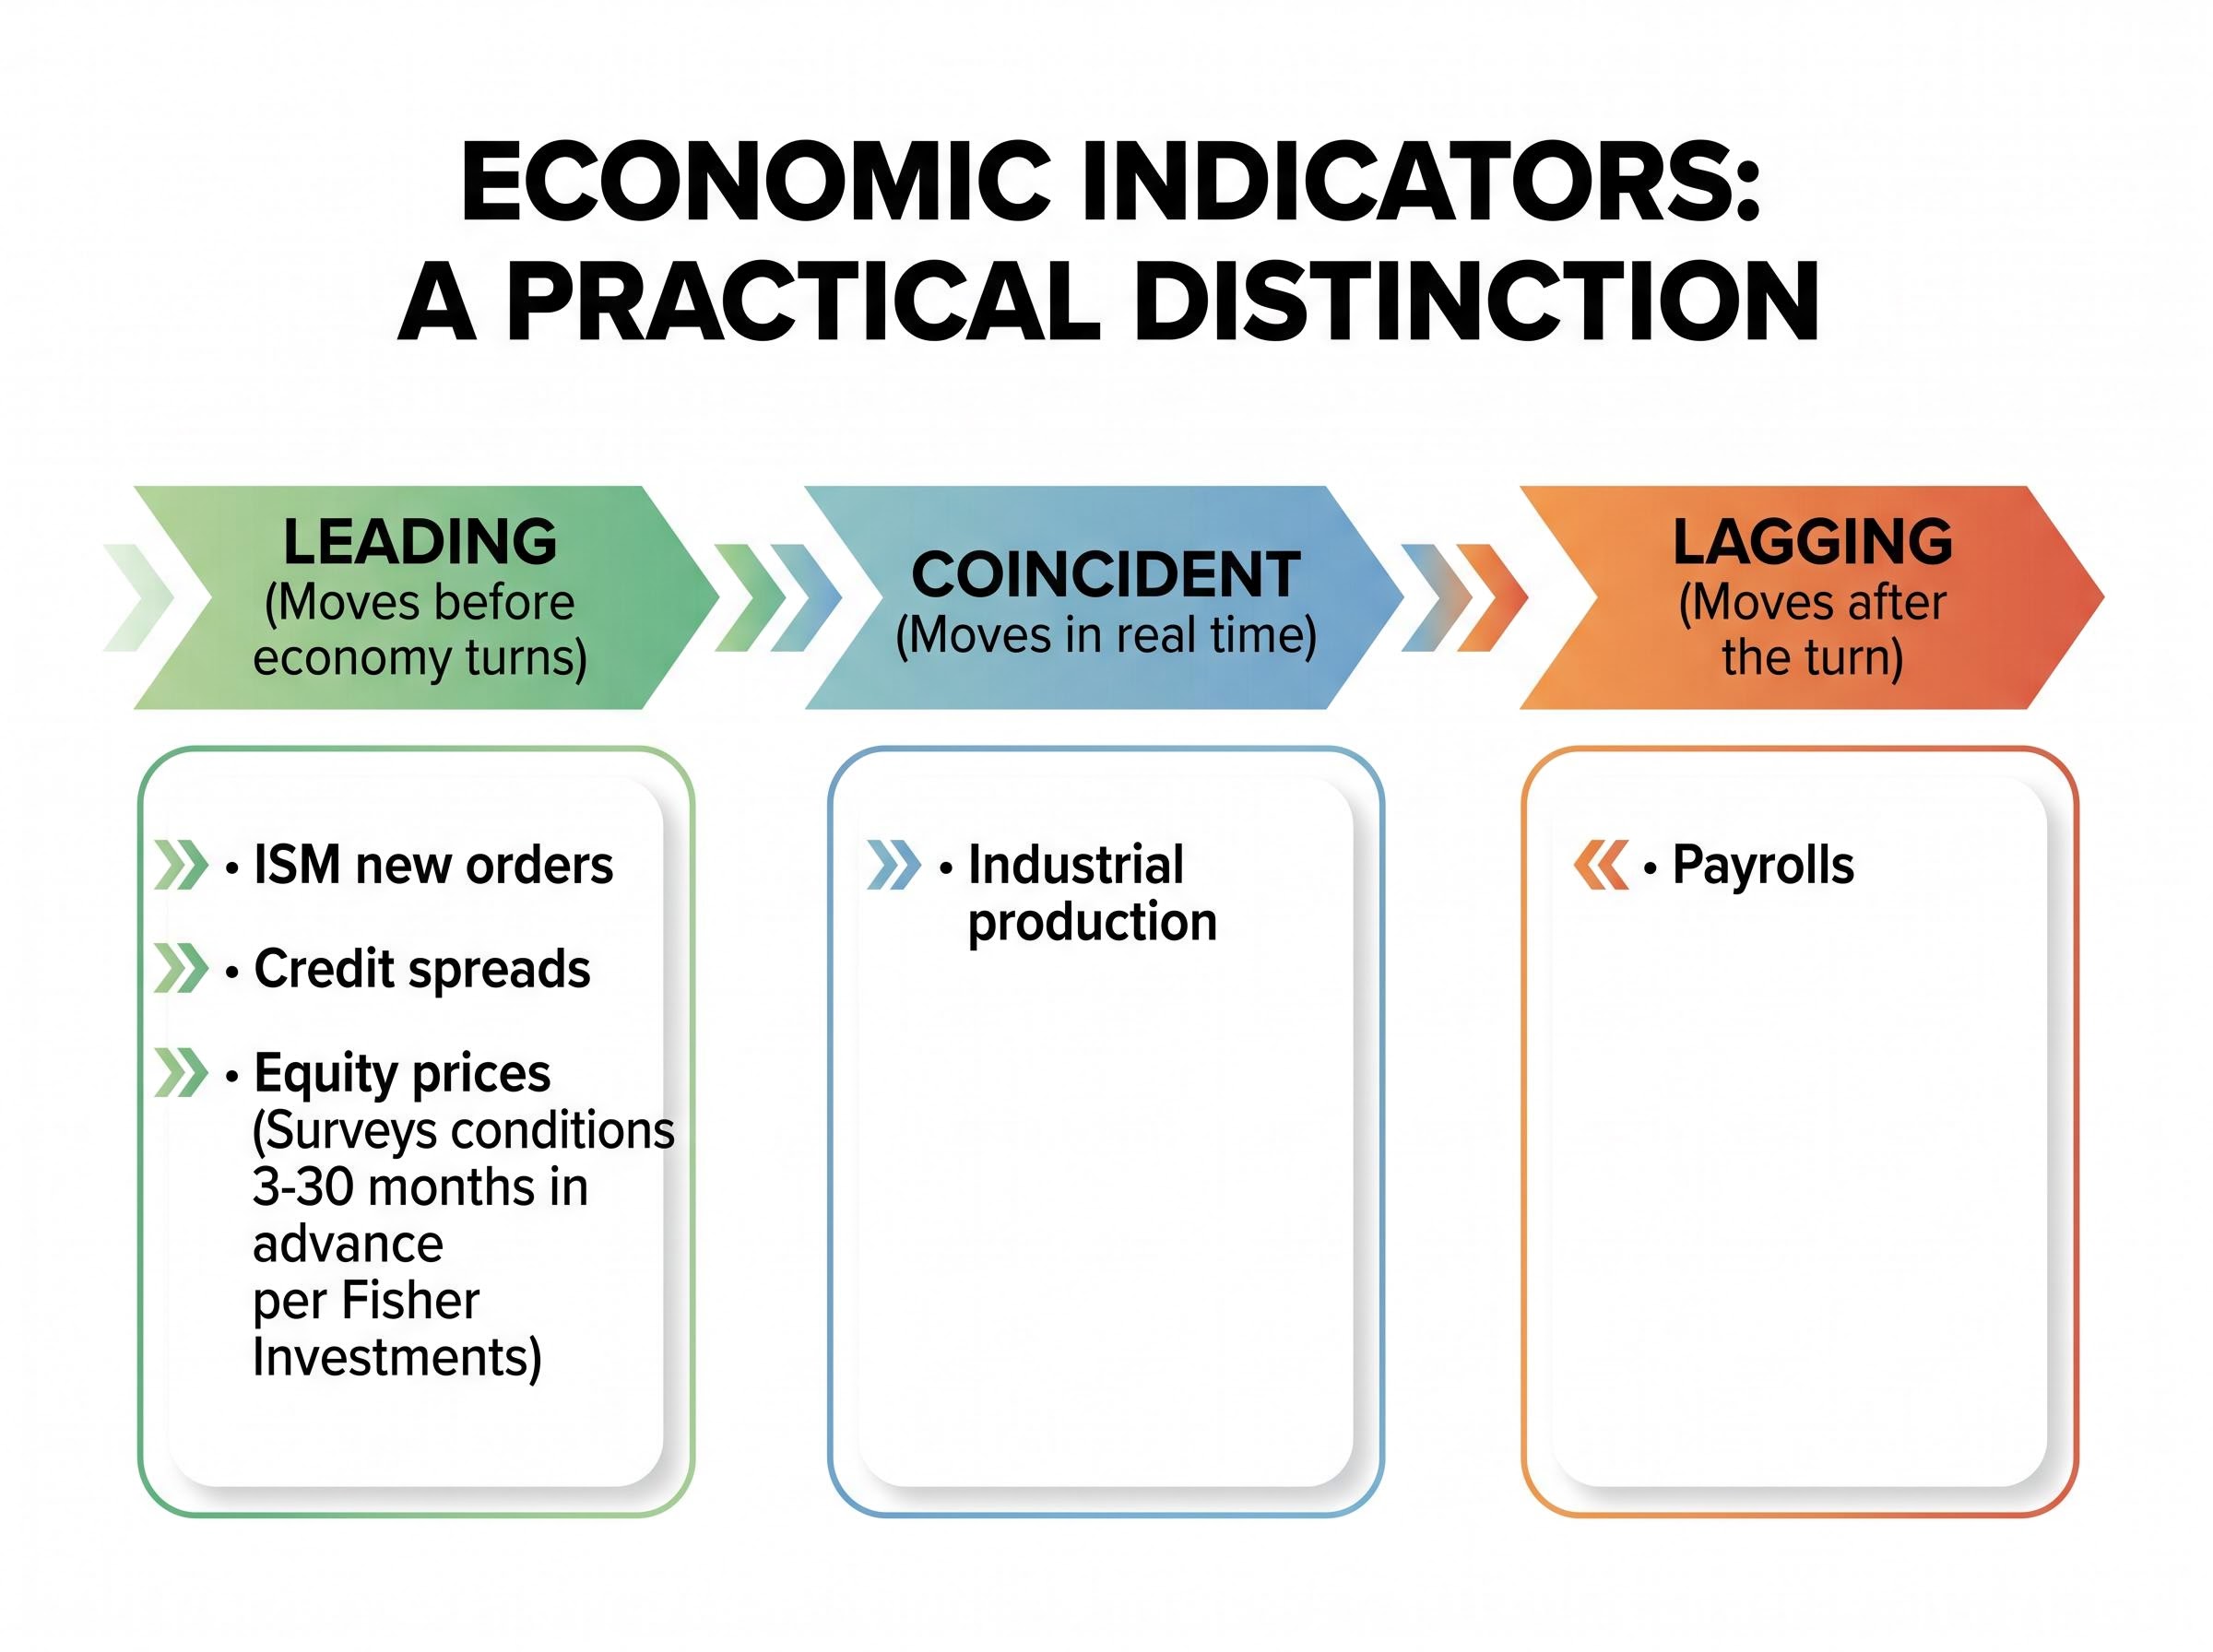
Equity prices themselves are a leading indicator. As Fisher Investments has framed it, stocks survey economic conditions 3 to 30 months in advance. Payrolls describe where the economy has been. Liz Ann Sonders, chief investment strategist at Charles Schwab, has emphasised this distinction, characterising payrolls as lagging relative to forward-looking signals like ISM new orders and credit spreads.
The practical implication: a strong jobs report does not tell investors where the economy is going. It tells them where it has already been. And by the time that receipt arrives, markets have moved on.
Investors who treat earnings season as a macro indicator gain access to credit conditions, consumer health, and inflation signals weeks before official GDP data is published, making corporate results a more timely input to equity positioning than any payroll release.
The simplified version of the relationship runs like this: strong jobs mean no rate cuts, no rate cuts mean stocks fall. Each link in that chain is weaker than it appears.
The Fed operates under a dual mandate to promote maximum employment and price stability. Neither term has a fixed, agreed-upon definition. There is no official unemployment rate that triggers a cut, and no payroll number that prevents one. Individual policymakers interpret the mandate differently, and that interpretive latitude shapes every decision.
The Federal Reserve dual mandate framework makes clear that the FOMC assesses maximum employment by weighing a broad range of labour market indicators, not a single payroll print, which is precisely why characterising any one jobs report as hawkish or dovish overstates what that data point can actually tell policymakers.
Under Jerome Powell, the Fed was explicit about how it used data. In his 11 December 2024 press conference, Powell stated that decisions would be based on “the totality of the data, the evolving outlook, and the balance of risks.” John Williams, president of the New York Fed, put it more directly in a 28 November 2024 speech:
“Data-dependent, but not data-point dependent.”
That distinction matters. The Fed was not reacting to individual payroll prints. It was tracking forward-looking inflation projections, risk assessments, and the broader trajectory of economic activity. Christopher Waller, a Fed governor, articulated the priority in an April 2024 speech: “When inflation is above target, price stability must take precedence in the near term.”
| What investors assume | What the Fed actually said | Why it differs |
|---|---|---|
| Strong jobs number means no rate cuts | “Data-dependent, but not data-point dependent” (Williams, Nov 2024) | No single payroll print triggers or blocks a rate decision; the Fed weighs a suite of indicators |
| The Fed reacts primarily to employment data | “Price stability must take precedence in the near term” (Waller, April 2024) | Inflation projections, not jobs, have been the binding constraint on rate decisions |
| The Fed’s reaction function is predictable | Kevin Warsh confirmed as Fed Chair on 13 May 2026 in a 54-45 vote | New leadership means the Powell-era reaction function is no longer a reliable guide |
Rates have been unchanged since December 2025. The Warsh confirmation introduces genuine uncertainty about how the dual mandate will be weighted going forward, making the “strong jobs equals no cuts” shortcut even less reliable than it was under the previous chair.
The S&P 500’s current bull market began on 12 October 2022. At that point, the Federal Reserve was in the middle of its most aggressive rate-hiking cycle in decades. What followed was an equity advance that survived every rate environment the Fed threw at it.
| Period / Rate environment | S&P 500 direction |
|---|---|
| Oct 2022: Bull market begins during active rate hikes | Advancing from cycle lows |
| 2023: Hold at cycle peak (highest in 20+ years) | Continued advance through the year |
| Jan 2024: No cuts delivered yet | Record high on 19 January 2024 |
| Late 2024: First rate cuts begin | Further gains through year-end |
| 2025: Additional cuts, then hold; “Liberation Day” pullback and recovery | Swift recovery to new highs |
| May 2026: Rates unchanged since Dec 2025 | Record high (total return index, 12 May 2026) |
The 19 January 2024 moment is worth isolating. Reuters reported that the S&P 500 hit a record high “even as the Federal Reserve keeps its benchmark interest rate at the highest level in over two decades.” No cuts had been delivered. The rate environment was as restrictive as it had been since the early 2000s. Stocks advanced regardless.
Equities price discounted future cash flows. Earnings growth is the numerator in that equation; interest rates affect the denominator by altering the discount rate. A higher discount rate is a headwind, but it is a headwind that can be overcome when the numerator, earnings, is growing fast enough.
That is precisely what happened through this cycle. Large-cap technology and healthcare delivered earnings growth that outweighed the drag of restrictive policy. Goldman Sachs U.S. equity strategy has noted that payroll surprises “do not reliably forecast S&P 500 returns” once earnings and rates are controlled for. The signal that moved stocks was not the jobs number. It was the earnings trajectory.
Equity markets do not require strong jobs, low rates, or any particular macroeconomic backdrop to advance. They require outcomes that exceed expectations. The difference between what was priced in and what actually happened is what moves stock prices, not the absolute level of any single indicator.
This expectations framework operates in three steps:
Liz Ann Sonders captured the inversion this creates:
“Good news can be bad news when the Fed is leaning hawkish, and bad news can be good news once policy is restrictive.”
That framing explains why the same headline number can produce opposite market reactions on different days. Michael Arone of State Street Global Advisors has noted that investors trade “the implications for the Fed, not the jobs number itself,” and that over longer horizons, “equities track earnings and liquidity far more closely than monthly payroll noise.”
The PwC Global Investor Survey 2024, covering 345 investors across 24 countries, found that a large majority expected earnings growth over the following 12 months even under high-rate conditions. Institutional positioning was cautious but invested, consistent with a market that grinds higher on earnings rather than waiting for macro green lights.
Widespread anxiety about the jobs-rates-stocks chain paradoxically helps equities. When expectations are depressed by fear of rate holds, the bar for a positive surprise drops. The pessimism becomes the fuel.
The consumer confidence and stock market divergence in April 2026, with the University of Michigan index hitting a record low of 49.8 while the S&P 500 held near all-time highs, is precisely the kind of pessimism the current cycle has repeatedly converted into fuel: historical precedent shows that record-low sentiment readings have tended to coincide with market bottoms rather than the start of sustained declines.
If payrolls are a lagging indicator with a noisy relationship to equity returns, what should investors monitor instead? Several signals have historically mapped more cleanly onto equity direction:
When the next payroll number crosses the screen, one question cuts through the noise: does this number change the earnings outlook, or does it simply confirm growth the market has already priced?
If the answer is confirmation, the appropriate response is usually no portfolio action. The market has already issued its verdict on the growth the jobs report is now documenting.
Employment data is a receipt for growth that already occurred. Equity markets issued that receipt months earlier when they priced the underlying expansion into forward earnings expectations. The April 2026 report confirmed a labour market that was still adding jobs across most service-sector categories. It did not predict where the economy, or the market, would go next.
The Warsh era introduces genuine uncertainty about how the Fed will translate employment data into rate decisions. The Powell-era shortcut, strong jobs equals hawkish Fed equals bearish for stocks, was already unreliable under the chair who rejected it. Under new leadership, it is even less useful as a forecasting tool.
This framework does not guarantee outcomes. Bull markets end, and the next one may end for reasons unrelated to any payroll release. What changes is the quality of the questions investors ask. The investors positioned to benefit from record highs during this bull market were not the ones who waited for payrolls, rate cuts, or any other lagging confirmation before remaining invested. They were the ones who understood that the jobs report tells you where the economy has been, not where the market is going.
This article is for informational purposes only and should not be considered financial advice. Investors should conduct their own research and consult with financial professionals before making investment decisions.
A lagging indicator is a data point that moves after the economy has already changed direction. Payrolls are a classic example because companies hire after growth has occurred, meaning the jobs report confirms past conditions rather than predicting future ones.
The S&P 500 total return index hit record highs because equity markets price discounted future earnings, not current employment conditions. The strong payroll number largely confirmed growth the market had already priced in months earlier.
Not necessarily. The Fed weighs a broad range of indicators rather than reacting to a single payroll print, and as New York Fed President John Williams stated, policy is data-dependent but not data-point dependent.
Investors tracking equity direction more effectively monitor forward earnings estimates, earnings revisions, ISM new orders, credit spreads, and yield curve shape, all of which tend to lead economic turning points rather than lag them.
The current S&P 500 bull market began on 12 October 2022, during the Federal Reserve's most aggressive rate-hiking cycle in decades, demonstrating that equity advances do not require low rates or rate cuts to sustain.


