Why Social Media Stocks Are Mispricing Youth Litigation Risk
11 hrs ago
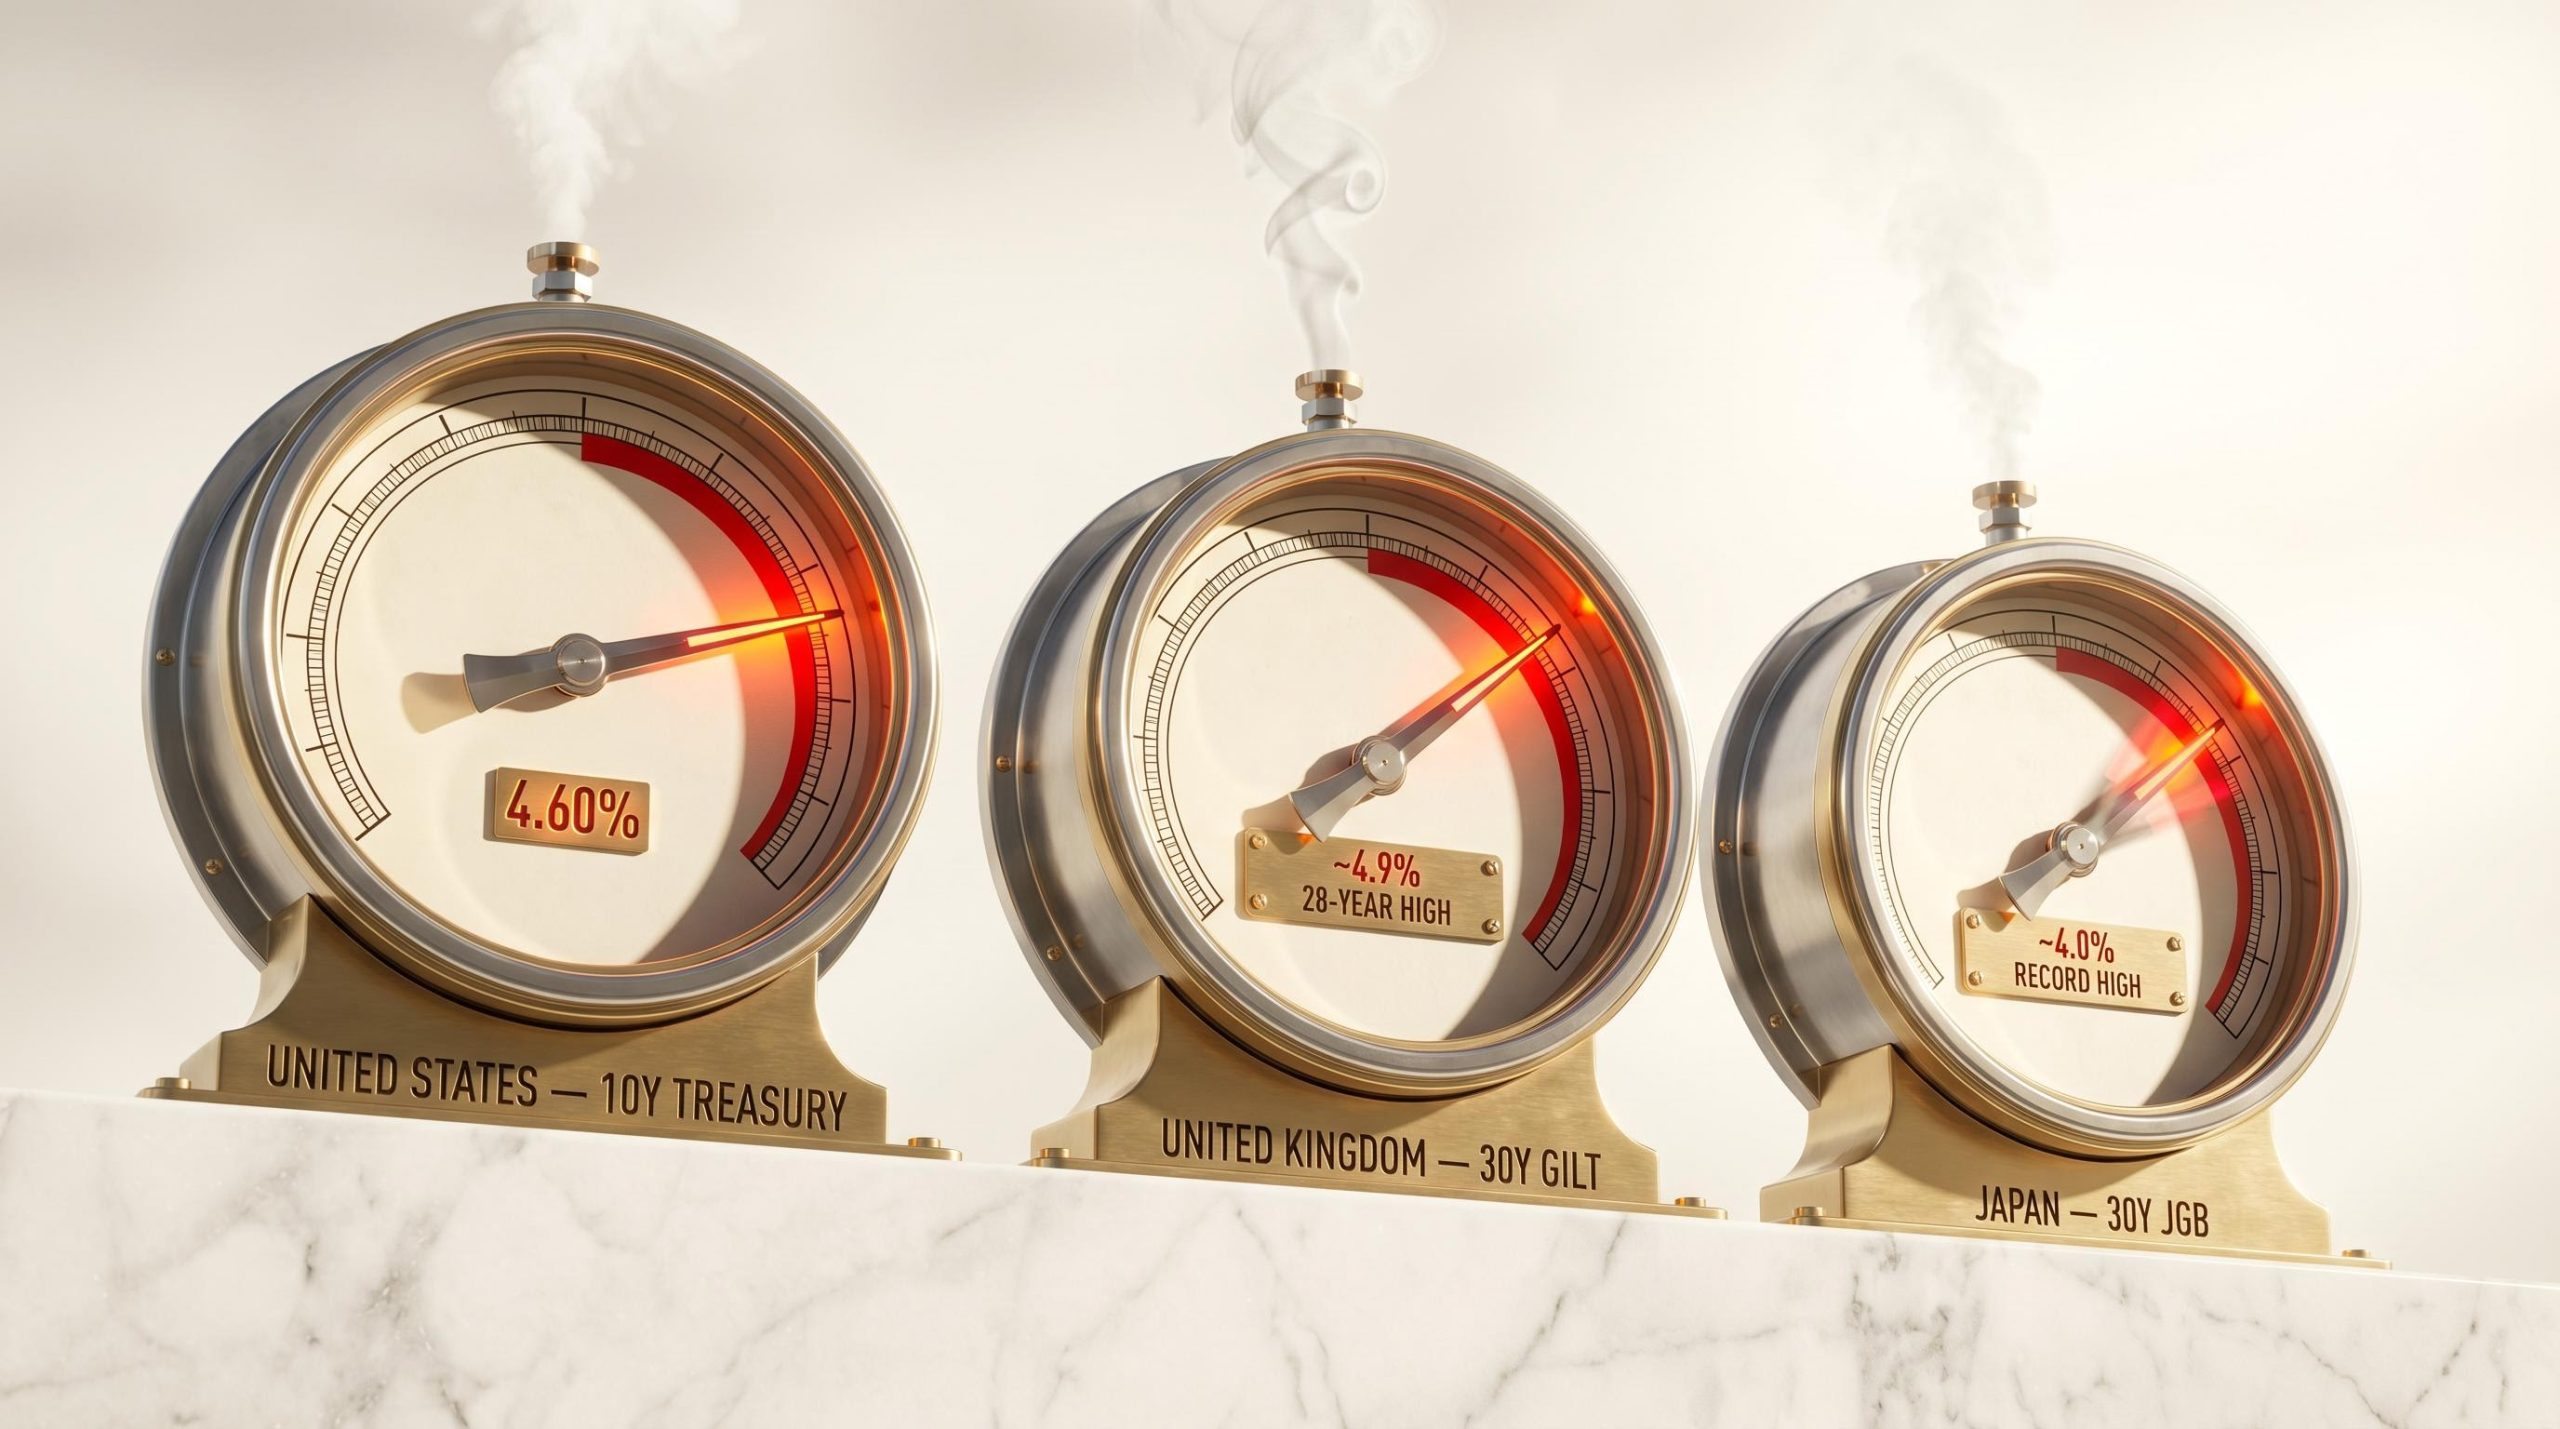
The US 10-year Treasury yield pushed toward 4.60% this week, its highest level since May 2025. The UK 30-year gilt climbed to approximately 4.9%, a 28-year high. Japan’s 30-year government bond briefly touched 4% for the first time in the instrument’s history. These are not three separate stories. They are one story, playing out simultaneously across the world’s largest sovereign bond markets, and the signal they send is that the era of rising bond yields is reasserting itself with a breadth that single-market analysis cannot capture. What follows is an examination of the forces driving the move, what central banks are actually saying (and not saying), how prior yield surges have played out for equity investors, and what the portfolio response looks like across asset classes.
The scale of the move matters. But the synchronisation matters more.
On a single session this week, the US 10-year Treasury yield climbed approximately 11 basis points to close near 4.595%. The UK 30-year gilt settled around 4.9%, a level not seen since the late 1990s. Japan’s 30-year JGB briefly breached 4%, a record for that instrument, before pulling back to just below 3.98%.
| Market | Instrument | Approximate Yield | Historical Context |
|---|---|---|---|
| United States | 10-year Treasury | 4.60% | Highest since May 2025 |
| United Kingdom | 30-year gilt | ~4.9% | 28-year high |
| Japan | 30-year JGB | ~4.0% | Record high |
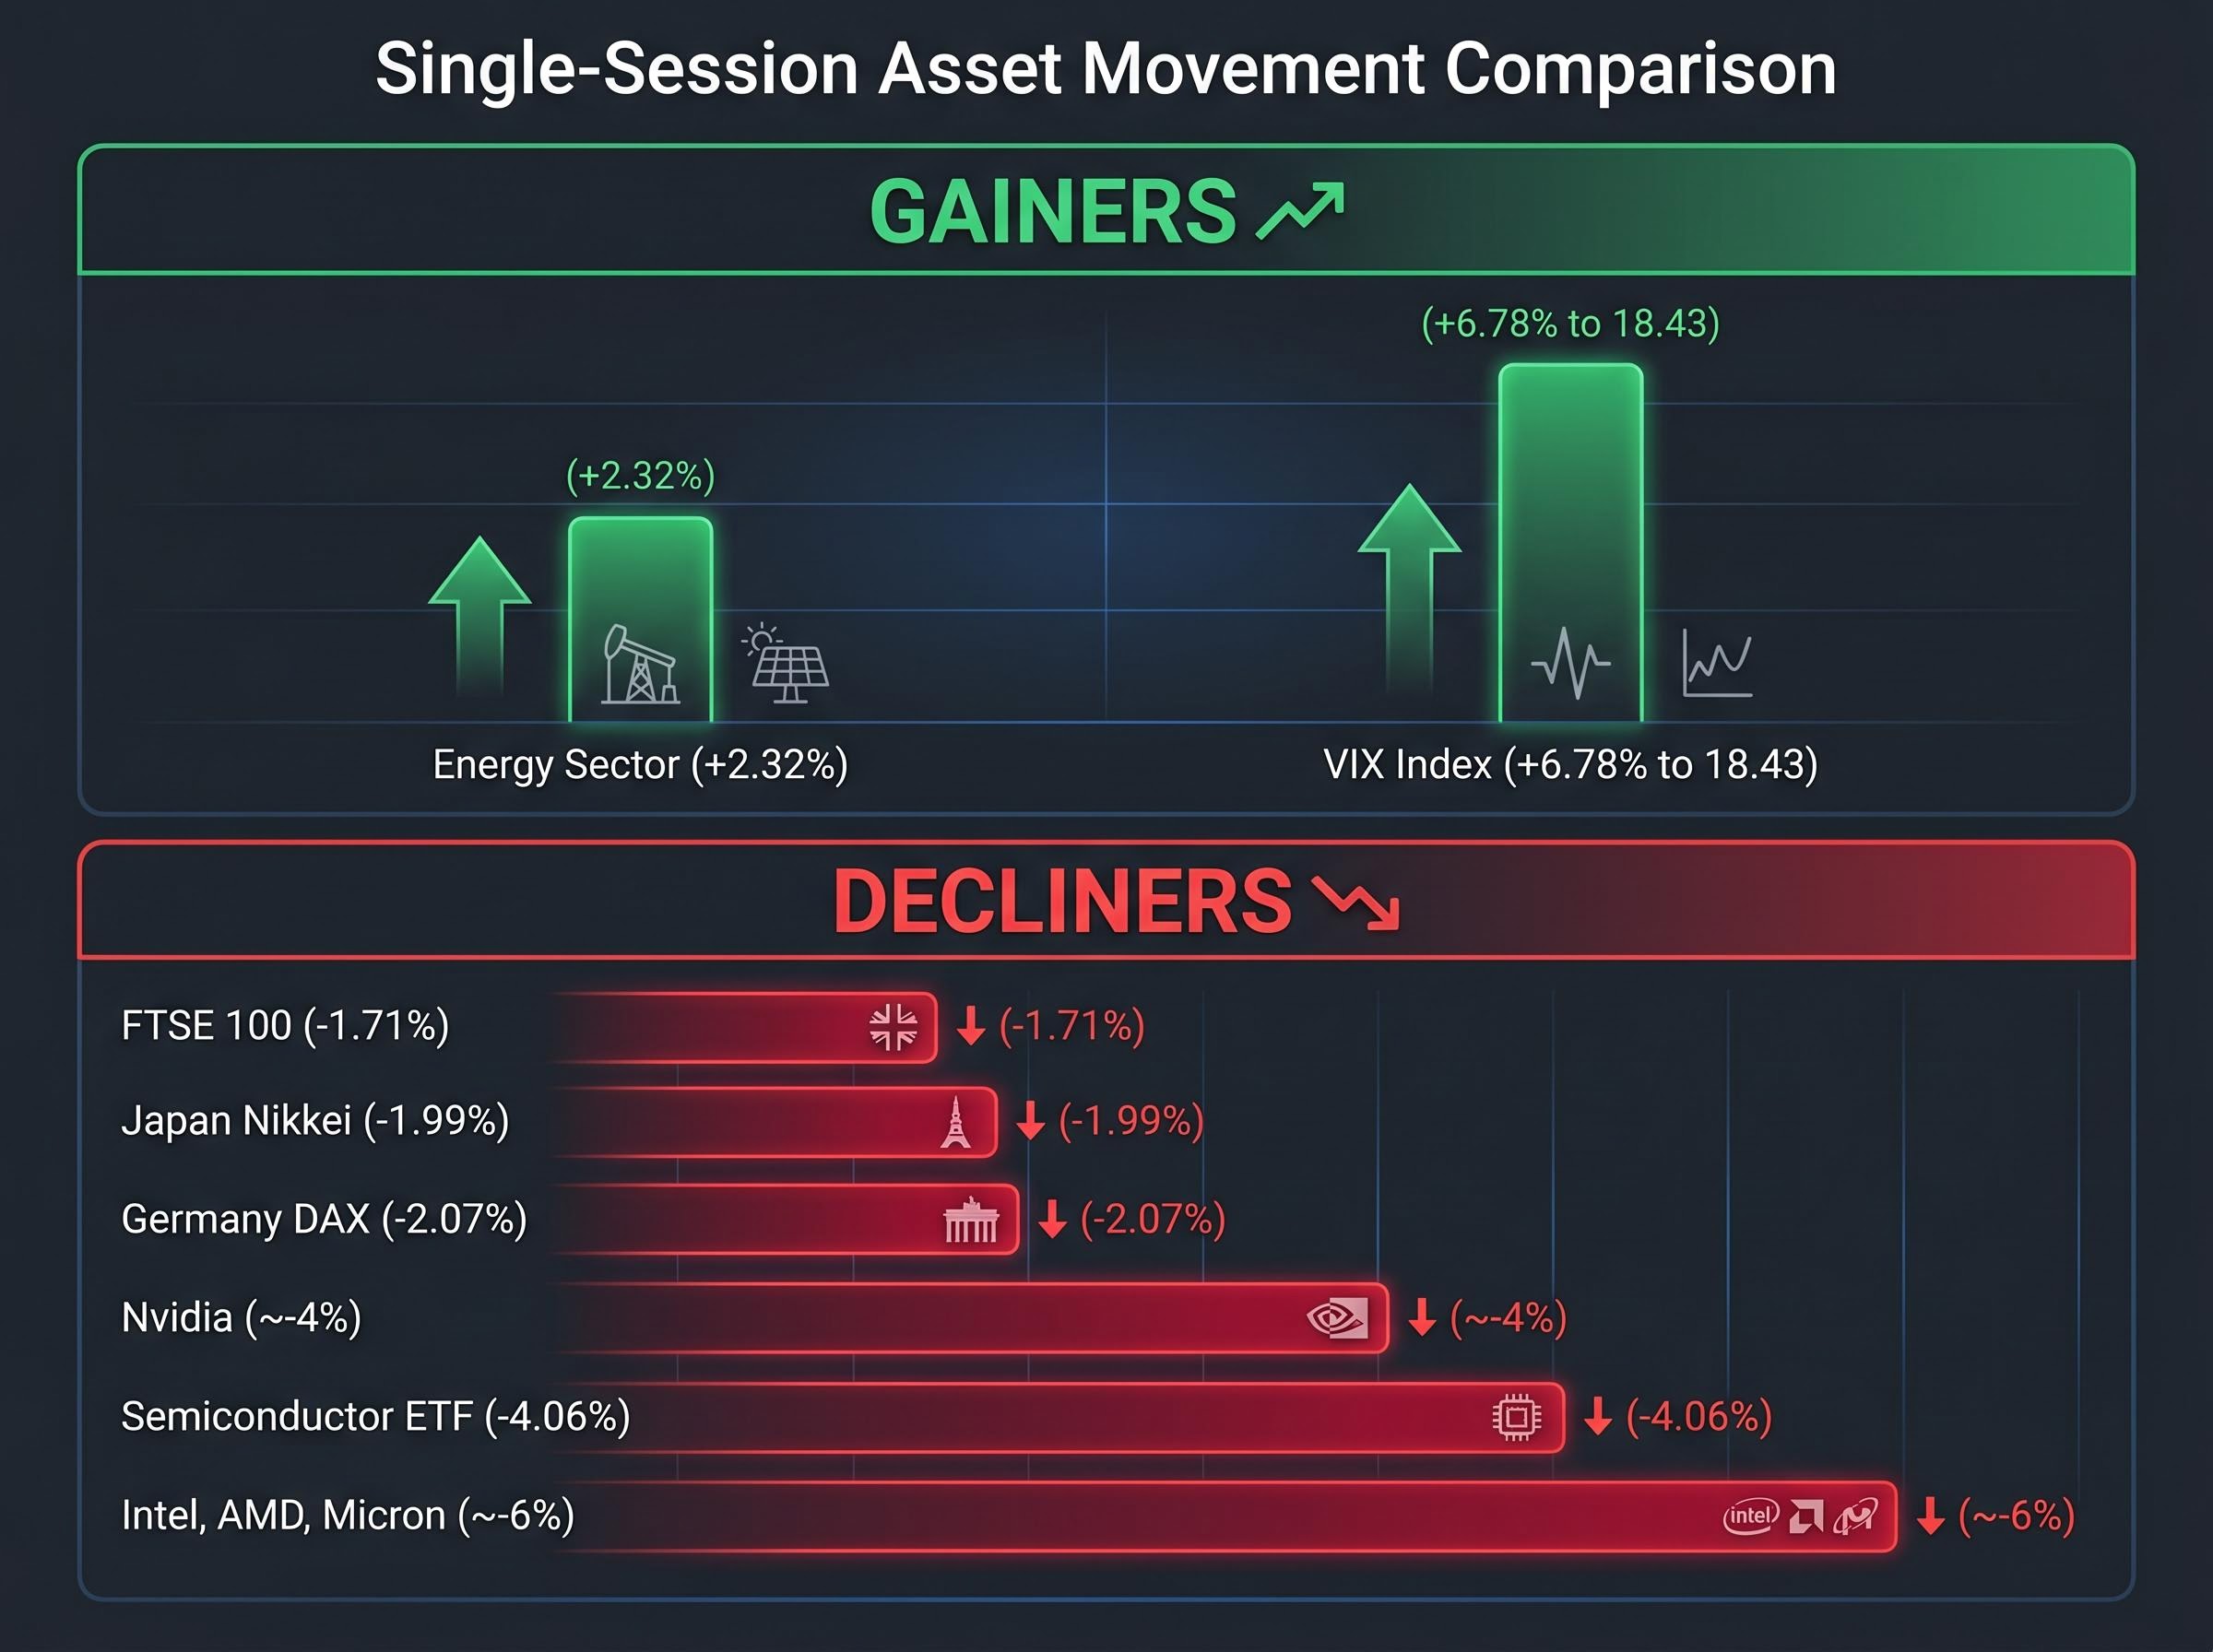
Post-spike trading in all three showed consolidation rather than reversal, a sign that participants have not dismissed the move as a technical overshoot. Equity markets fell in sympathy: Germany’s DAX dropped 2.07%, Japan’s Nikkei fell 1.99%, and the FTSE 100 declined 1.71% in the same session. When sovereign yields breach multi-year highs across three economies on the same day, the signal is global, and investors cannot diversify away from it by shifting between developed markets.
The structural repricing of long-duration sovereign debt extended further on 15 May 2026 when US 30-year Treasury yields crossed 5% for the first time since 2007, a threshold that compounds the pressure on discount rates beyond what the 10-year move alone implies for equity valuations.
The proximate trigger was US inflation data. Hotter-than-expected CPI and PPI readings forced market participants to reprice the “higher for longer” timeline for the Federal Reserve. But inflation data alone does not explain why gilt and JGB yields moved in tandem.
Four drivers are reinforcing one another:
The transmission chain from oil prices to yields runs through CPI: Brent crude above $111 per barrel pushed April 2026 headline inflation to 3.8% year-over-year, nearly double the Federal Reserve’s target, and that reading is the proximate force that has anchored the front end of the yield curve at elevated levels and extended the repricing into long-duration assets.
The IEA has forecast that global oil markets will remain materially undersupplied through at least October 2026, even assuming a June resolution of the Iran conflict.
US economic data reinforced the “no imminent slowdown” narrative: April retail sales rose 0.5% month-on-month, and industrial production climbed 0.7%, its strongest reading in over a year. Investors who identify the yield move as multi-causal are better positioned to assess whether a single catalyst, such as a softer CPI print or a ceasefire, would be sufficient to reverse the trend. The reinforcing nature of these drivers suggests the bar for reversal is higher than any one data point can clear.
Bond prices and yields move in opposite directions. When a bond pays a fixed coupon of 3% but new bonds are being issued at 4.5%, the older bond becomes less attractive. Its price falls until its effective yield matches the new rate. That mechanical relationship is the reason a selloff in bonds, meaning falling prices, translates directly into rising yields.
The yield on government bonds serves as the risk-free rate, the baseline return an investor can earn without taking on credit risk. Every other asset is valued relative to this baseline. When the risk-free rate rises, the discount rate applied to future cash flows rises with it.
The discount rate effect hits differently depending on how far into the future an asset’s cash flows sit:
The session data illustrated this in real time. The semiconductor ETF fell 4.06%, with Intel, AMD, and Micron each declining approximately 6% and Nvidia falling roughly 4%. Energy, the sole S&P 500 sector to gain, rose 2.32%. The VIX volatility index climbed 6.78% to 18.43.
In a traditional 60/40 portfolio, bonds cushion equity drawdowns. When both fall together, that buffer disappears. The current episode fits the pattern of inflationary yield surges, as seen in 2022, where rising rates punish both asset classes simultaneously. This is distinct from recessionary yield moves, where bonds typically rally as equities fall. The breakdown means investors holding balanced portfolios are absorbing losses on both sides, a dynamic that demands a more active response than simply waiting for the traditional correlation to reassert itself.
The stock-bond correlation breakdown played out with particular severity in Asian markets on 15 May 2026, where Japan’s 20-year JGB yield hit its highest level since 1996 on the same session that the KOSPI reversed 6.1% intraday and Samsung Electronics fell 8.6%, illustrating how the inflation-driven repricing propagated far beyond the US Treasury market.
The instinct for many investors is to assume central banks will eventually step in to contain the yield move. The official language across four institutions suggests otherwise.
No major central bank has described the current selloff as disorderly. No institution has signalled large-scale bond purchases or imminent easing. The shared characterisation is that higher yields reflect changing fundamentals.
| Central Bank | Key Official | Reported Tone | Hike Probability |
|---|---|---|---|
| Federal Reserve | John Williams, Michael Barr | Data-dependent; prepared to hike if inflation persists | ~40% by end-2026 (CME FedWatch) |
| ECB | Yannis Stournaras | Further tightening “cannot be ruled out” | Not specified |
| Bank of England | Huw Pill | Easing “a way off”; gilt backup validated | Not specified |
| Bank of Japan | Senior officials | 4% JGB “significant but in line with fundamentals” | Gradual normalisation continues |
Huw Pill’s commentary is particularly direct: the BoE Chief Economist framed any easing as “a way off” and explicitly validated the backup in gilt yields as appropriate given persistent domestic price pressures.
CME FedWatch data shows approximately 40% probability of a 25 basis point Fed hike by end-2026. Kalshi prediction markets price over 50% odds of a hike before year-end 2026, fully pricing one hike by March 2027.
Investors positioned for a central bank pivot toward cutting rates face the most immediate reassessment risk. The official tone across all four institutions is aligned: “higher for longer” is the operative framework, and none of the yield moves have triggered the kind of language that precedes intervention.
The FOMC minutes from March 2026 document the Committee’s explicit discussion of inflation persistence and the conditions under which further tightening would be warranted, providing the primary source basis for the data-dependent posture that Fed officials have continued to communicate publicly since.
Three episodes offer the closest analogues, and they form a spectrum rather than a single lesson.
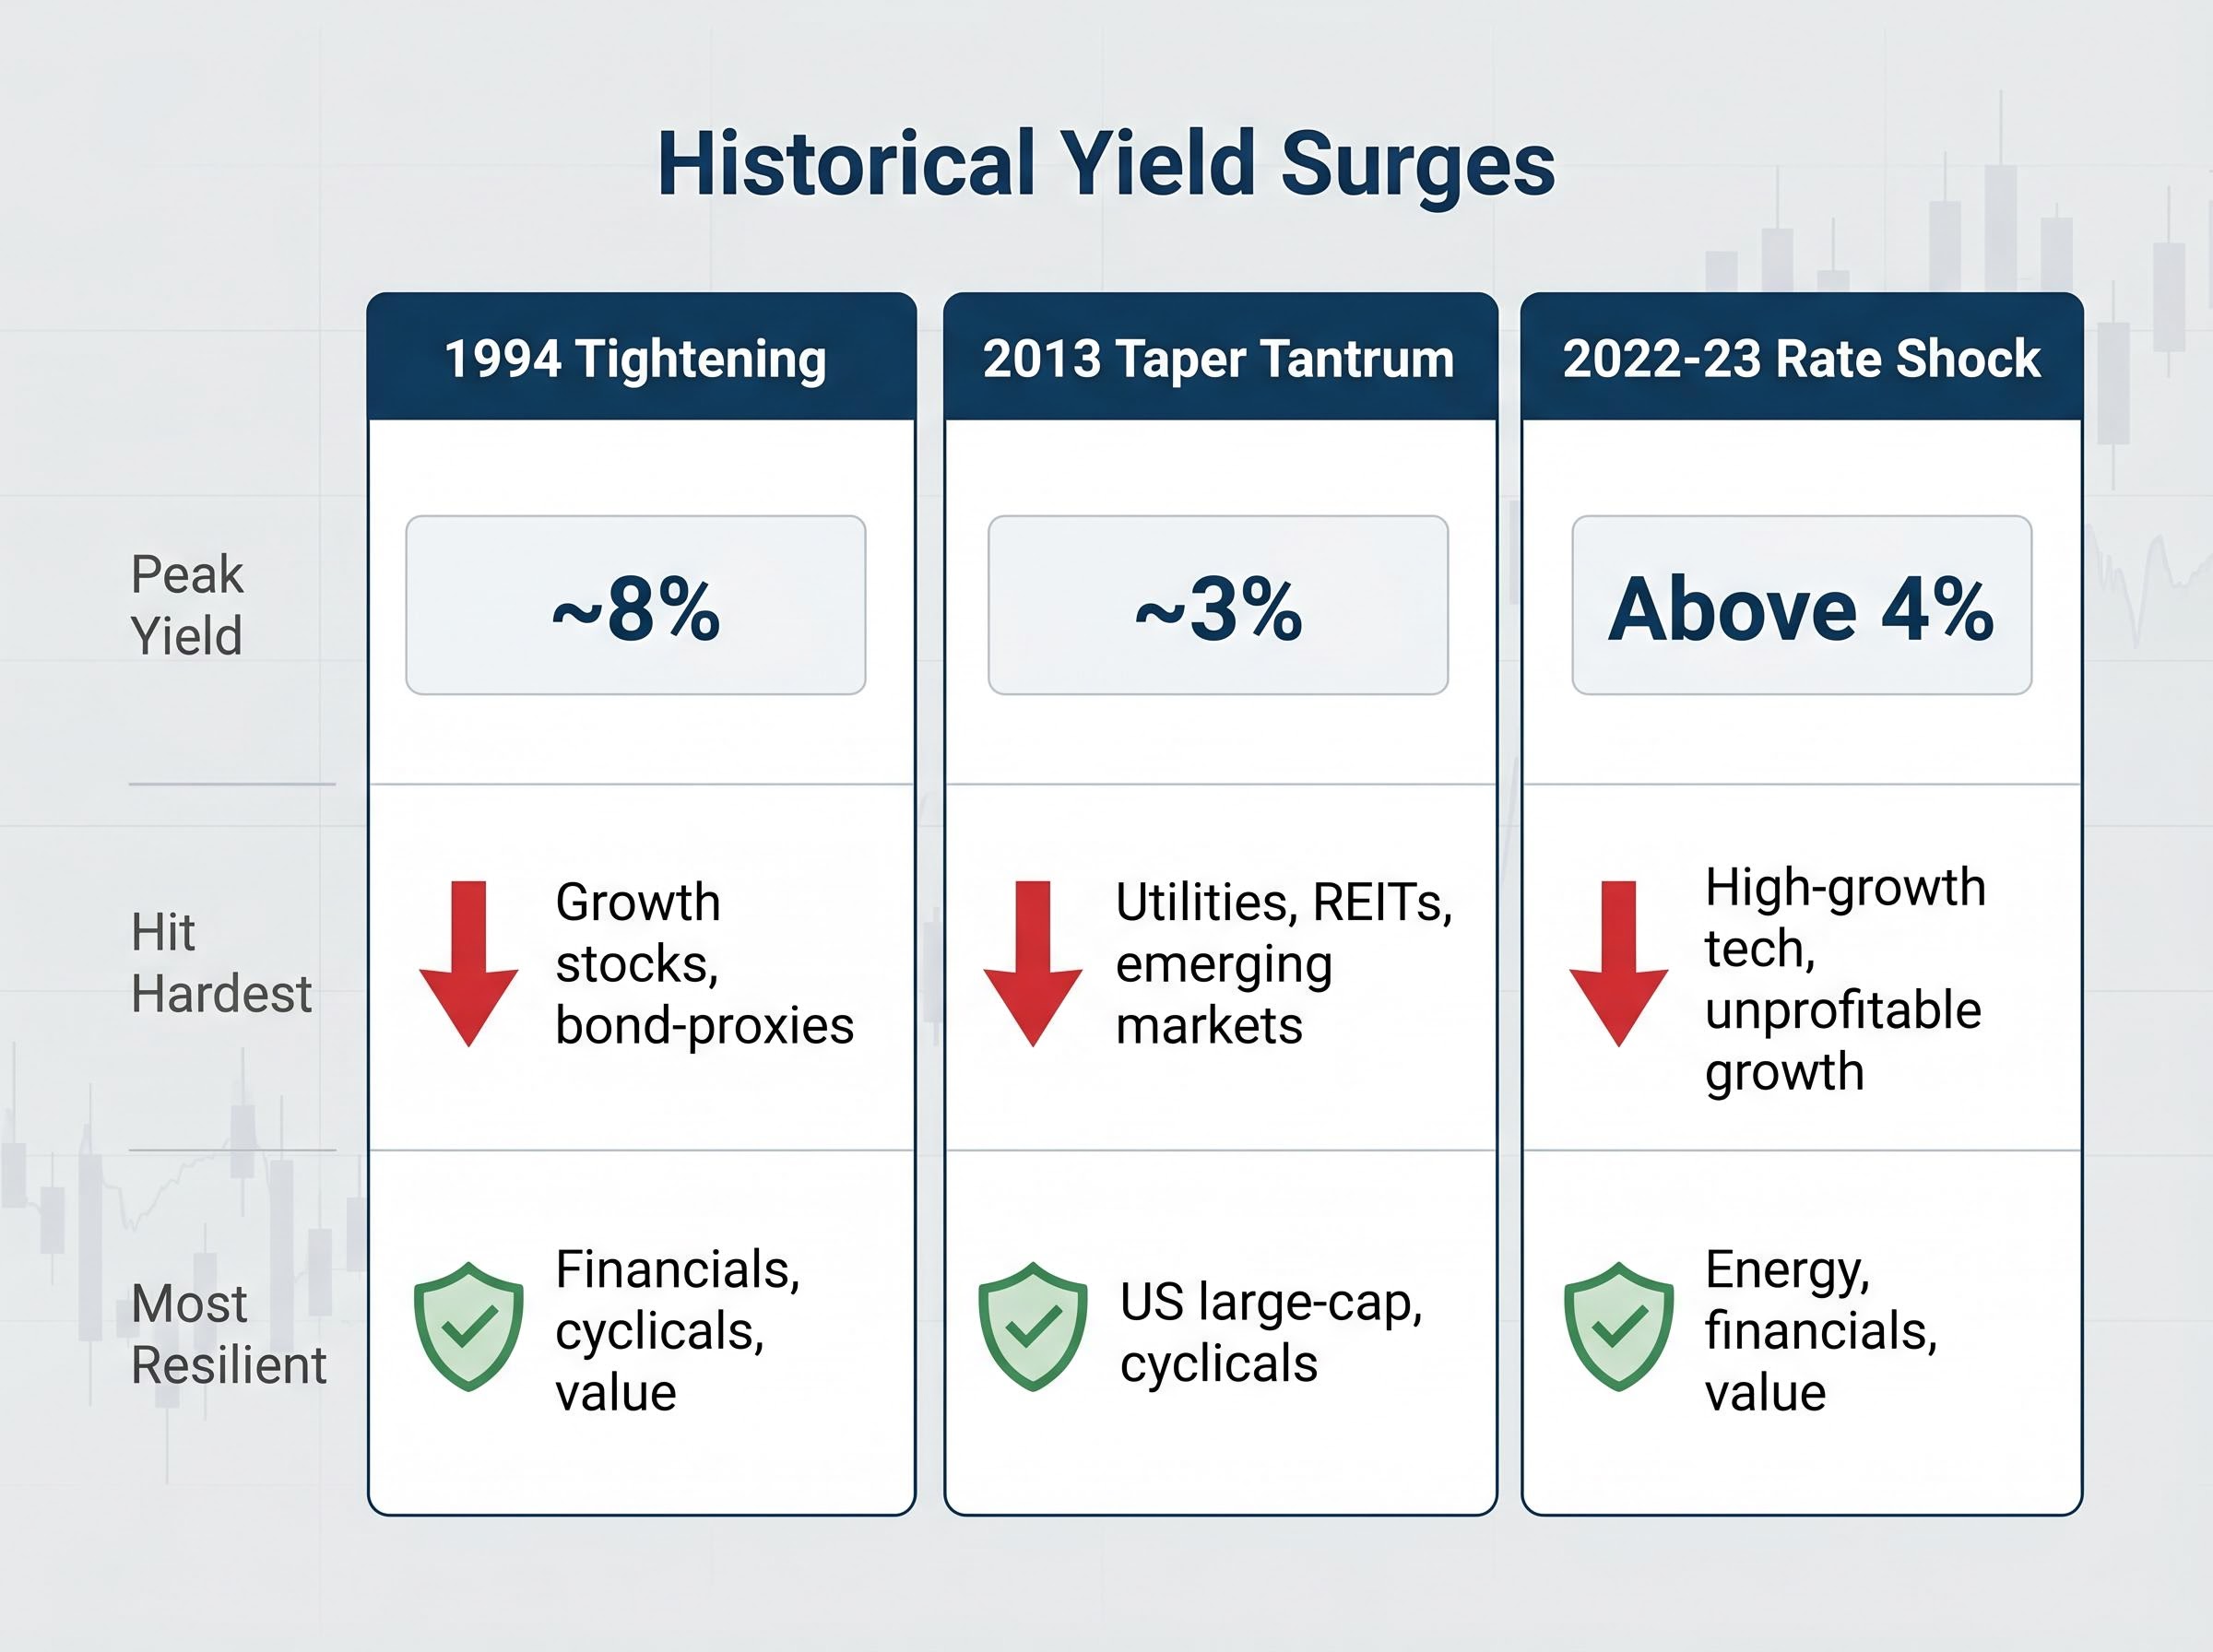
| Episode | 10-Year Peak (Approx.) | Key Equity Impact | Sectors Hit Hardest | Sectors Most Resilient |
|---|---|---|---|---|
| 1994 tightening | ~8% | Equities digested the move; economy stayed strong | Growth stocks, bond-proxies | Financials, cyclicals, value |
| 2013 Taper Tantrum | ~3% | Near-term damage to rate-sensitive names; broad recovery followed | Utilities, REITs, emerging markets | US large-cap, cyclicals |
| 2022-23 rate shock | Above 4% | Severe megacap growth derating; stabilised once terminal rate priced | High-growth tech, unprofitable growth | Energy, financials, value |
The common variable that determined equity resilience across all three episodes was whether the yield surge coincided with a growth slowdown. When nominal GDP held up, broad indices eventually digested the move. When yields rose into slowing growth, the damage was more sustained and more broadly distributed.
The sector-level pattern has been consistent: rapid yield moves drive rotation out of long-duration growth and bond-proxy defensives (utilities, REITs, consumer staples) and into value, financials, and commodity-linked names. This week’s session reflected that pattern precisely: energy up 2.32%, information technology down 1.61%, the Russell 2000 down 2.44%.
US April data points to continued expansion, with industrial production up 0.7% and retail sales up 0.5% month-on-month. That is the central case for equities absorbing the yield move over coming months, following the 1994 and late-2023 template rather than the 2022 derating.
The risk is that energy prices in the $92-101 range begin to erode consumer spending. If that materialises, the growth assumption weakens and the historical template shifts toward the more damaging 2022-style outcome.
The portfolio response to a sustained yield surge centres on three levers, each designed to make sense across a range of outcomes rather than requiring a single forecast to be correct.
The quality filter applies across all three levers: strong balance sheets, stable cash flows, and pricing power are the screening criteria within any rotation move, whether the destination is value, financials, or real assets.
The synchronised global yield move reflects genuine fundamental shifts: persistent inflation, geopolitical energy risk, and no imminent central bank pivot. Portfolios built on a “rates fall soon” assumption face the most structural pressure.
Three uncertainties could alter the trajectory:
Equity complacency and rates market divergence created a visible tension in mid-May 2026 when the S&P 500 reached a record 7,501 on 14 May even as the 10-year Treasury yield hit a year-to-date high of 4.46%, a disconnect that the subsequent session’s broad selloff began to resolve but that may not be fully priced given the VIX remaining below 20.
The appropriate response is not to predict which of these materialises first. It is to ensure the portfolio is not heavily concentrated in positions that require one specific outcome to work. Duration management, sector rotation, and inflation hedging are moves that function across multiple scenarios, not just the “higher for longer” base case.
This article is for informational purposes only and should not be considered financial advice. Investors should conduct their own research and consult with financial professionals before making investment decisions. Past performance does not guarantee future results. Financial projections are subject to market conditions and various risk factors.
Rising bond yields occur when bond prices fall, often driven by higher inflation, stronger economic data, or reduced expectations of central bank rate cuts. They matter because they raise the discount rate applied to future corporate earnings, compressing valuations especially for long-duration growth stocks.
When yields rise, the risk-free rate increases, making future corporate cash flows worth less in present-value terms. This hits high-valuation growth and technology companies hardest, while sectors like energy and financials can benefit from the higher-rate environment.
The synchronised rise reflects a combination of hotter-than-expected US inflation data, elevated energy prices with WTI crude in the $92-101 range, geopolitical supply risk, and the contagion effect of rising US term premia pulling global long-end yields higher.
Investors are weighing three main responses: reducing exposure to long-duration bonds in favour of intermediate maturities (2-7 years), rotating equities from rate-sensitive growth and bond-proxy sectors toward financials and energy, and adding inflation hedges such as TIPS or energy-linked equities.
Based on current official communications, no major central bank has signalled intervention or imminent easing. The Federal Reserve, Bank of England, ECB, and Bank of Japan have all described the yield moves as reflecting changing fundamentals, with CME FedWatch pricing approximately 40% odds of a Fed hike by end-2026.