Why Social Media Stocks Are Mispricing Youth Litigation Risk
11 hrs ago

US equity markets closed at record highs on 14 May 2026, with the S&P 500 crossing 7,500 for the first time. The milestone arrived on the same day the 10-year Treasury yield hit a year-to-date high of 4.461% and futures markets priced a 28% probability of a Federal Reserve rate hike by December. Two macro forces are compounding beneath that surface: a historic oil supply disruption triggered by the Strait of Hormuz closure on 4 March 2026, and a Fed policy environment that has shifted from “cut” to “hold or hike” in response to energy-driven inflation. Neither force is new, but their interaction is intensifying in ways equity markets may not be fully reflecting.
This analysis traces how the oil shock feeds inflation, how inflation locks the Fed into a hawkish posture, how elevated yields compress valuations and squeeze earnings, and what investors should be watching across sectors as these forces play out through the second half of 2026.
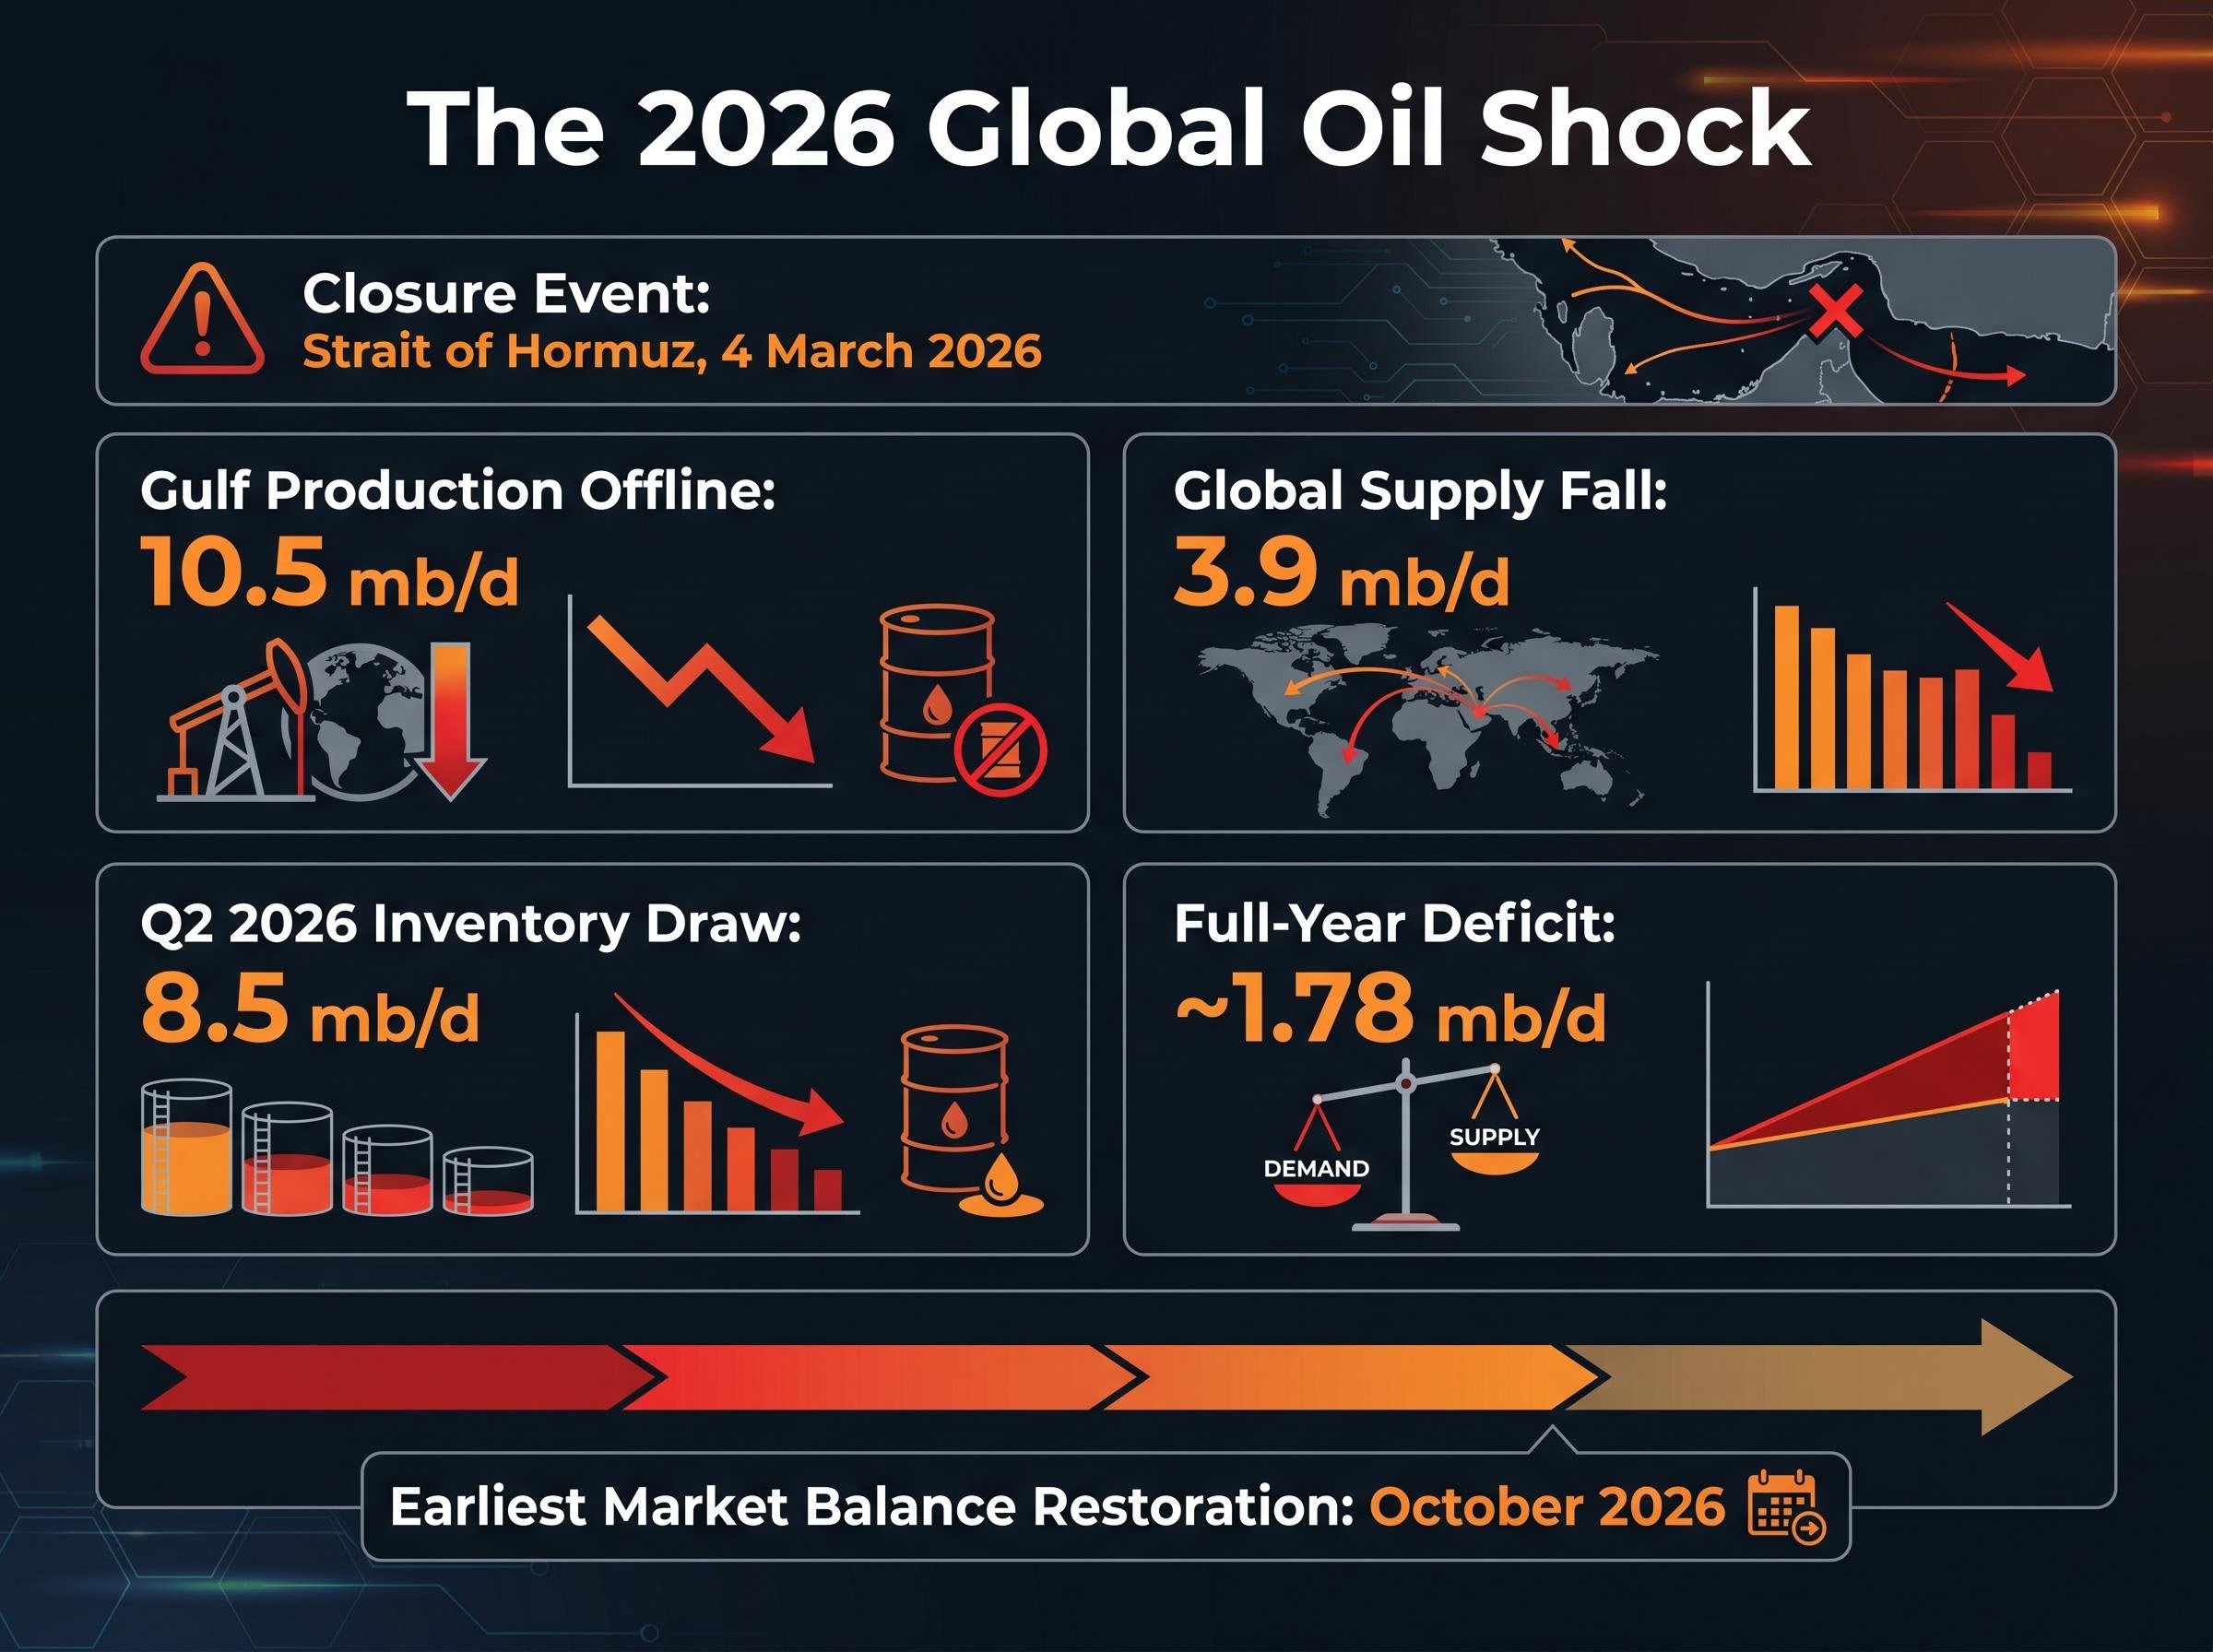
The numbers describe a shock without modern precedent. When the Strait of Hormuz closed on 4 March 2026, it severed the single most concentrated energy transit point on the planet. The International Energy Agency (IEA) characterised the event in its May 2026 Oil Market Report as the largest supply disruption in the history of the global oil market.
“Greatest global energy security challenge in history.” — IEA, May 2026 Oil Market Report
Three complementary metrics capture the scale of what happened, and what remains unresolved:
Partial rerouting through Saudi and UAE pipelines, combined with non-Gulf supply, has softened the disruption. It has not resolved it. Global oil supply is projected to fall 3.9 mb/d against prior 2026 expectations. The IEA forecasts a Q2 2026 inventory draw of 8.5 mb/d, with the steepest draws concentrated in May and June. The full-year demand-supply deficit is projected at approximately 1.78 mb/d. Even a prompt end to the conflict would not restore market balance until at least October 2026, according to the IEA.
| Metric | Value | Time Period | Source |
|---|---|---|---|
| Global supply fall vs. prior forecast | 3.9 mb/d | Full-year 2026 | IEA May 2026 OMR |
| Gulf production offline | 10.5 mb/d | As of May 2026 | IEA May 2026 OMR |
| Q2 inventory draw rate | 8.5 mb/d | Q2 2026 | IEA May 2026 OMR |
| Full-year demand-supply deficit | ~1.78 mb/d | Full-year 2026 | IEA May 2026 OMR |
| Global demand revision | −420,000 bpd | 2026 vs. prior forecast | IEA May 2026 OMR |
Investors pricing a rapid normalisation in oil are working against the quantified data. The deficit is structural through at least Q3 2026, and the IEA’s inventory draw forecast signals physical tightness will intensify before it eases.
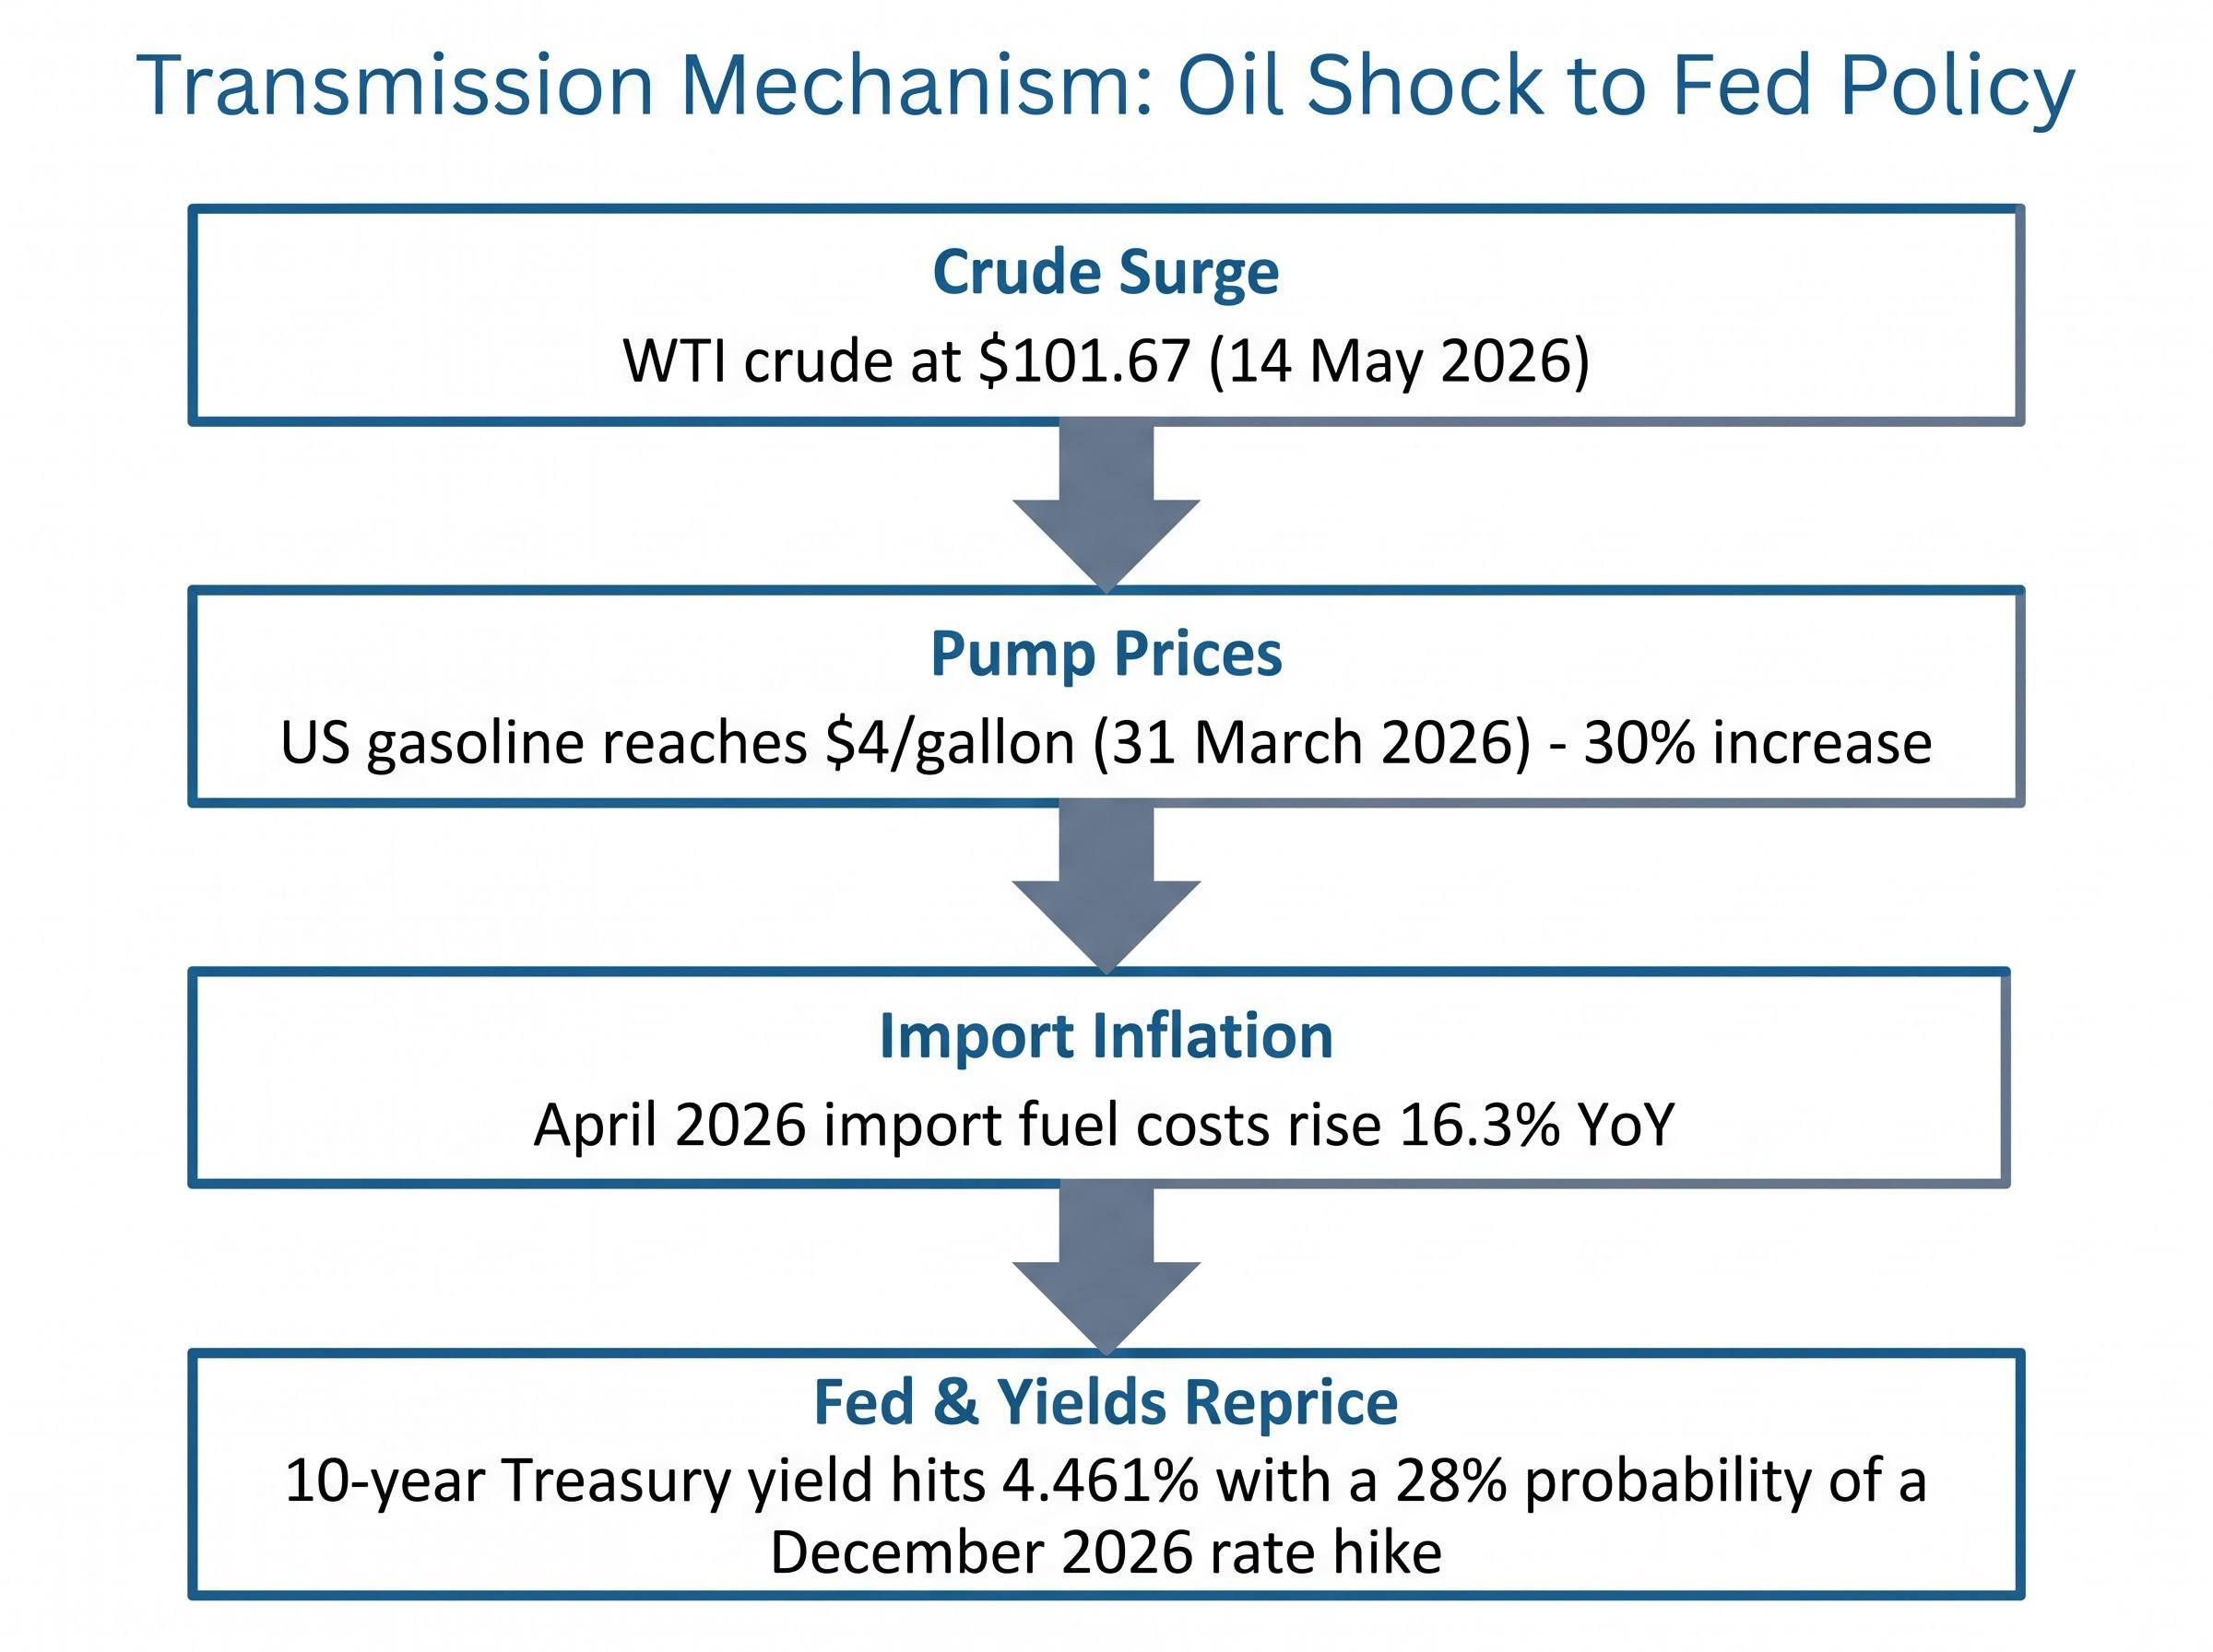
The transmission from crude oil to Fed policy runs through a chain of steps, each one a direct consequence of the last:
The 10-year Treasury yield at 4.461%, a year-to-date high, reflects that repricing in real time.
Fed official Jeff Schmid has characterised persistent inflation as the foremost risk facing the US economy.
Kevin Warsh’s confirmation as incoming Fed Chair adds an institutional layer. Warsh’s historical positioning reflects greater sensitivity to inflation persistence and a higher bar for rate cuts during an oil shock. The combination has effectively handcuffed the Fed: energy-driven inflation keeps CPI elevated, removing the option to cut rates even as growth slows.
The FOMC internal fracture deepens the policy uncertainty: the 29 April decision produced a historic four-way dissent, with hawks outnumbering the lone dovish dissenter three to one, and PCE running at 3.5% against a 2% target while unemployment rose to 4.3%, a dual-mandate conflict that rate tools are structurally ill-equipped to resolve simultaneously.
This dynamic, not the oil price itself, is the primary equity market risk. The Fed’s inability to respond to weakening growth with monetary easing transforms an oil shock into a broader financial conditions tightening event.
The Fed rate outlook repricing has been sharpest at the longer end of the curve, with JPMorgan pushing its first cut forecast back to Q1 2027 and both Morgan Stanley and Pimco publicly flagging the possibility of an outright hike, a distribution of institutional views that makes the 28% December hike probability look conservative rather than aggressive.
When the 10-year Treasury yield rises, it increases the rate investors use to discount future earnings back to present value. A higher discount rate means future cash flows are worth less today, mechanically pushing down the price investors are willing to pay per dollar of earnings.
At 4.461%, the 10-year yield is applying real pressure to price-to-earnings multiples across the market. The effect is most acute for technology and growth names trading at extended multiples, where a larger share of the valuation rests on earnings projected years into the future. A 28% probability of a Fed hike adds further uncertainty to that discount rate calculation, making forward valuations less stable.
The other side of the equation is earnings themselves. Energy-intensive sectors face the most direct margin pressure, and there is a lag between input cost rises and the ability to pass those costs through to customers. Three categories stand out:
The IEA’s global demand contraction of 420,000 bpd signals that top-line growth assumptions built into consensus earnings-per-share estimates for 2026 also face revision. Saudi Arabia’s April crude production fell to 6.316 mb/d, the lowest since 1990 and a 42% contraction since the conflict began, illustrating the production-side severity feeding these dynamics.
| Scenario | Oil Price Assumption | Fed Action | Est. US Growth Impact | Implied Equity Risk |
|---|---|---|---|---|
| Base case | $100-110 WTI avg. | Hold | −0.5 to −1.0 pp vs. pre-war | Modest earnings downgrade; multiple pressure contained |
| Risk case | $120-130 WTI | One or two hikes | Growth stall or mild recession | Material downside; dual compression on P and E |
The stagflation setup attacks equity valuations from both sides simultaneously. Higher yields compress the multiple; margin pressure and slowing demand compress actual earnings.
Oil supply shocks transmit into the broader economy through three channels:
The 1970s stagflation episodes are the closest historical analogue. The IEA describes the 2026 disruption as the largest supply disruption in the history of the global oil market by raw volume, exceeding even 1973 and 1979, though modern economies carry some offset through greater energy efficiency.
“Largest supply disruption in the history of the global oil market.” — IEA, May 2026 Oil Market Report
What makes 2026 structurally different from prior shocks is the combination of speed, scale, and policy constraint. The Q2 inventory draw of 8.5 mb/d (equivalent to roughly 8% of daily global consumption of approximately 102 mb/d) is depleting buffers at an extraordinary rate. The IEA’s explicit projection that even conflict resolution cannot restore market balance until October 2026 removes the possibility of a quick snap-back. And the simultaneous hawkish policy environment, with rate hikes back in the probability distribution, removes the monetary policy buffer that was available during some prior oil shock cycles.
Investors who frame this as a temporary spike are misreading the structural signals. The inventory mathematics and IEA timeline make elevated prices the base case through at minimum Q3 2026, and there is no central bank put available to cushion the growth impact.
The macro forces outlined above produce a portfolio response that follows logically from the data. Institutional positioning is shifting along clear lines.
Energy producers and integrated majors are the most direct beneficiaries. With Brent at approximately $107.50 and WTI at approximately $101.67, and the IEA projecting a 1.78 mb/d full-year deficit, the earnings tailwind for oil and gas is durable rather than speculative.
Defensive sectors, specifically utilities, consumer staples, and healthcare, are attracting a selective overweight as the stagflation-resistant allocation. The characteristics being sought are specific: strong balance sheets, near-term cash flow generation, pricing power sufficient to keep pace with inflation, and low refinancing risk at current yield levels.
Rotation away from rate-sensitive and long-duration growth names is underway, though not yet uniformly reflected in prices. On 14 May 2026, Information Technology was the top-performing sector (up 1.85%), illustrating that AI-driven momentum still dominates daily flows even as macro headwinds build.
| Sector | Direction | Key Reason | Primary Risk |
|---|---|---|---|
| Energy (oil and gas) | Overweight | Sustained price level; 1.78 mb/d deficit | Geopolitical de-escalation; demand destruction |
| Technology / growth | Rotate out | Multiple compression from 4.4%+ yields | Extended valuations vulnerable to discount rate shift |
| Defensives (utilities, staples) | Selective overweight | Stagflation resilience; pricing power | Slower growth offsets defensive premium |
| REITs | Reduce | Real yield sensitivity | 4.461% yield compresses asset values |
| Consumer discretionary | Reduce | Dual headwind: input costs and demand destruction | $4 gasoline erodes household spending |
This rotation pattern is consistent with institutional behaviour during the 2011 and 2022 oil shock episodes. The divergence between AI-driven momentum (evidenced by the S&P 500 at record highs) and macro-driven risk repricing (evidenced by yields at year-to-date highs and a 28% hike probability) creates both risk and opportunity depending on portfolio positioning.
Defence sector overcrowding is one of the less-discussed rotation risks embedded in the current environment: Goldman Sachs, BofA, and Barclays all flagged concentration and overvaluation in April and May 2026, with major names trading at 25x forward multiples versus 18x pre-2022 levels, and historical analogues from 1991 and 2003 showing reversals of 10-30% once budget realities displaced conflict-driven sentiment.
The analysis above describes what has already happened and what the data currently projects. The next 90 days hinge on three specific signposts:
China’s April trade data adds a secondary signal worth monitoring. Exports rose 14.1% year-over-year to a record $359.4 billion; imports jumped 25.3%. Any deterioration in Chinese import demand could amplify the demand destruction already flagged by the IEA.
The VIX closed at 17.26 on 14 May 2026, down 3.41% on the session.
The VIX at 17.26 while 10-year yields sit at year-to-date highs and a 28% rate hike probability is priced into December represents a potential complacency signal: equity volatility pricing has not caught up with the macro risk the rates market is already reflecting.
The S&P 500 closed at 7,501 on 14 May 2026, its 18th record close of the year. The 10-year Treasury yield closed at 4.461% on the same day. Both numbers are facts. Holding them simultaneously is the analytical requirement of this market.
The oil supply disruption is structural through at least Q3 2026 by the IEA’s own timeline, with market balance not restored before October 2026 even under optimistic assumptions. The Fed policy environment has moved from tailwind to headwind regardless of whether a hike actually materialises. The genuine positive signals are real: AI-driven earnings momentum from Cisco and Applied Materials, TSMC’s revised 2030 global chip market forecast of $1.5 trillion (up from $1 trillion), and diplomatic progress at the Trump-Xi summit. These underpin the equity optimism reflected in index levels.
They do not erase the macro overlay. The next 90 days will answer specific questions: whether WTI holds above $100 or breaks toward the relief scenario, whether CPI prints force the Fed’s hand, and whether diplomatic engagement translates into actual supply restoration.
The IEA projects market balance will not be restored until at least October 2026, even with a prompt resolution to the conflict.
Record equity prices and compounding macro risks are not necessarily in contradiction. But they demand that portfolio positioning is calibrated to the specific risks the data identifies, not the surface-level performance of the index.
For investors wanting to stress-test the current index level against independent valuation frameworks, our dedicated guide to US equity valuation signals in 2026 examines the Buffett Indicator at 223.6% (surpassing dot-com peaks), the unfavourable earnings yield versus Treasury yield spread, and the near-absence of margin-of-safety buying opportunities across the market.
This article is for informational purposes only and should not be considered financial advice. Investors should conduct their own research and consult with financial professionals before making investment decisions. Past performance does not guarantee future results. Financial projections are subject to market conditions and various risk factors.
The two primary stock market risks in 2026 are the historic Strait of Hormuz oil supply disruption, which has removed approximately 15% of global crude flows from the market, and a Federal Reserve policy environment that has shifted from rate cuts to hold or hike, with markets pricing a 28% probability of a December 2026 rate increase.
An oil supply shock raises energy-driven inflation, which forces the Fed to keep rates elevated or hike; higher interest rates increase the discount rate applied to future earnings, mechanically compressing price-to-earnings multiples, while simultaneously squeezing corporate margins through higher input costs.
The IEA's May 2026 Oil Market Report projects that even a prompt resolution to the Strait of Hormuz conflict would not restore global oil market balance until at least October 2026, with a full-year demand-supply deficit of approximately 1.78 mb/d and a Q2 2026 inventory draw rate of 8.5 mb/d.
Technology and growth stocks face multiple compression from yields above 4.4%, while consumer discretionary, airlines, and chemicals face a dual headwind of higher input costs and demand destruction; REITs are also under pressure due to their sensitivity to real yields.
The VIX closed at 17.26 on 14 May 2026, a relatively low reading that contrasts sharply with 10-year Treasury yields at year-to-date highs and a 28% rate hike probability priced into December, suggesting equity volatility markets may not yet be reflecting the macro risks already visible in the rates market.