At $10.40 per share, Bendigo and Adelaide Bank (BEN) trades on a price-to-earnings ratio of roughly 12x. The Australian banking sector’s average sits closer to 18x. Multiply BEN’s earnings per share by that sector multiple and the implied value lands at $15.46, a gap of nearly 49%. So is the stock undervalued by half, or is the discount telling investors something more complicated?
PE ratio analysis remains one of the most widely used tools for evaluating ASX bank stocks, yet it is consistently misapplied. Most investors either skip the sector-comparison step or apply a single multiple without questioning whether it fits the company in question. BEN makes a useful live case study precisely because the gap between its current multiple and the sector average is large enough to force the question.
This guide walks through the three-step PE valuation framework as applied to BEN’s current numbers, explains how to interpret the implied sector-adjusted valuation of $15.46, and identifies the structural reasons that gap may not represent a straightforward buying opportunity.
What the PE ratio actually measures (and why banks are a special case)
The PE ratio captures the relationship between a company’s share price and the profit it earns per share. In its simplest form, it answers one question: how many dollars is the market willing to pay for each dollar of a company’s annual earnings?
PE ratio = Share price / Earnings per share
The three components are straightforward:
- Share price: the current market price of one share (for BEN, $10.40 at the 15 May 2026 close)
- Earnings per share (EPS): the company’s annual profit divided by its total shares on issue (BEN’s FY24 EPS: $0.87)
- Resulting ratio: share price divided by EPS (BEN: approximately 12x)
“Earnings” here simply means profit. When BEN earned $0.87 per share in FY24 and the market prices the stock at $10.40, investors are paying roughly 12 times last year’s profit for each share.
Where banks become a special case is in what the PE should be compared against. Australian banks are mature, high-payout, APRA-regulated institutions that behave more like utilities than growth businesses. Comparing BEN’s 12x PE to a technology stock trading at 40x tells investors nothing useful. PE comparisons need to stay within the banking sector. Australian banks collectively represent more than one-third of the S&P/ASX 200 by market capitalisation, which is why understanding how to value them correctly matters for almost every ASX portfolio.
The same PE ratio valuation for ASX bank shares framework applied here to BEN works across any listed bank: NAB’s FY24 cash EPS of $2.292 divided into its $37.37 share price produces a trailing multiple of approximately 16.3x, below the big-four upper range, with a sector-adjusted implied price of $41.27 when the 18x reference is applied.
When big ASX news breaks, our subscribers know first
Three ways to assess whether a PE ratio signals undervaluation
Not all PE assessments are equal. There are three approaches, and they form a progression from least to most rigorous:
- Threshold assessment: Does the number “feel” low? A PE of 12x sounds cheap in isolation.
- Peer comparison: How does it compare to similar businesses? Where does BEN sit relative to CBA, NAB, or BOQ?
- Implied valuation modelling: What share price does the sector average multiple imply for this company’s earnings?
Threshold-based assessment is the weakest of the three. Saying “12x is cheap” ignores whether the company’s earnings quality, growth profile, or return on equity justifies the multiple. A bank with declining margins and flat earnings growth may deserve a low PE. The number alone cannot answer that.
From “does this feel cheap?” to “cheap relative to what?”
The shift from absolute to relative thinking is where PE analysis gains real analytical weight. The same 12x multiple that looks cheap against the entire ASX 200 may look entirely reasonable when placed alongside banking peers.
Consider the spectrum across the sector as of mid-May 2026. CBA trades at approximately 25x on a trailing basis, reflecting a premium franchise with the highest return on equity in the peer group. NAB sits near 18x. Westpac and ANZ fall in the mid-range. BEN and BOQ occupy the low-to-mid-teens, the regional end of the scale. This is a map from premium franchise to regional discount, and BEN’s position at the bottom is neither new nor accidental.
The peer-comparison method leads naturally to its most useful output: implied valuation modelling. If the sector assigns an average multiple of 18x to bank earnings, what price would BEN trade at if it received the same multiple?
Applying the sector PE to BEN: where the $15.46 figure comes from
The calculation requires two inputs: BEN’s earnings per share and the sector average PE. Start with the earnings.
BEN reported FY24 EPS of $0.87. The sector average PE used here is 18x, an illustrative mid-range anchor. NAB sits near this level on a trailing basis, while CBA’s premium of approximately 25x pulls the blended sector average above this figure. For a clean educational framework, 18x serves as a reasonable reference point rather than a precise sector composite.
The arithmetic: $0.87 x 18 = $15.46.
That is the share price BEN would trade at if the market assigned it the same PE as the broader banking sector. Against BEN’s current price of $10.40, the gap is approximately 49%.
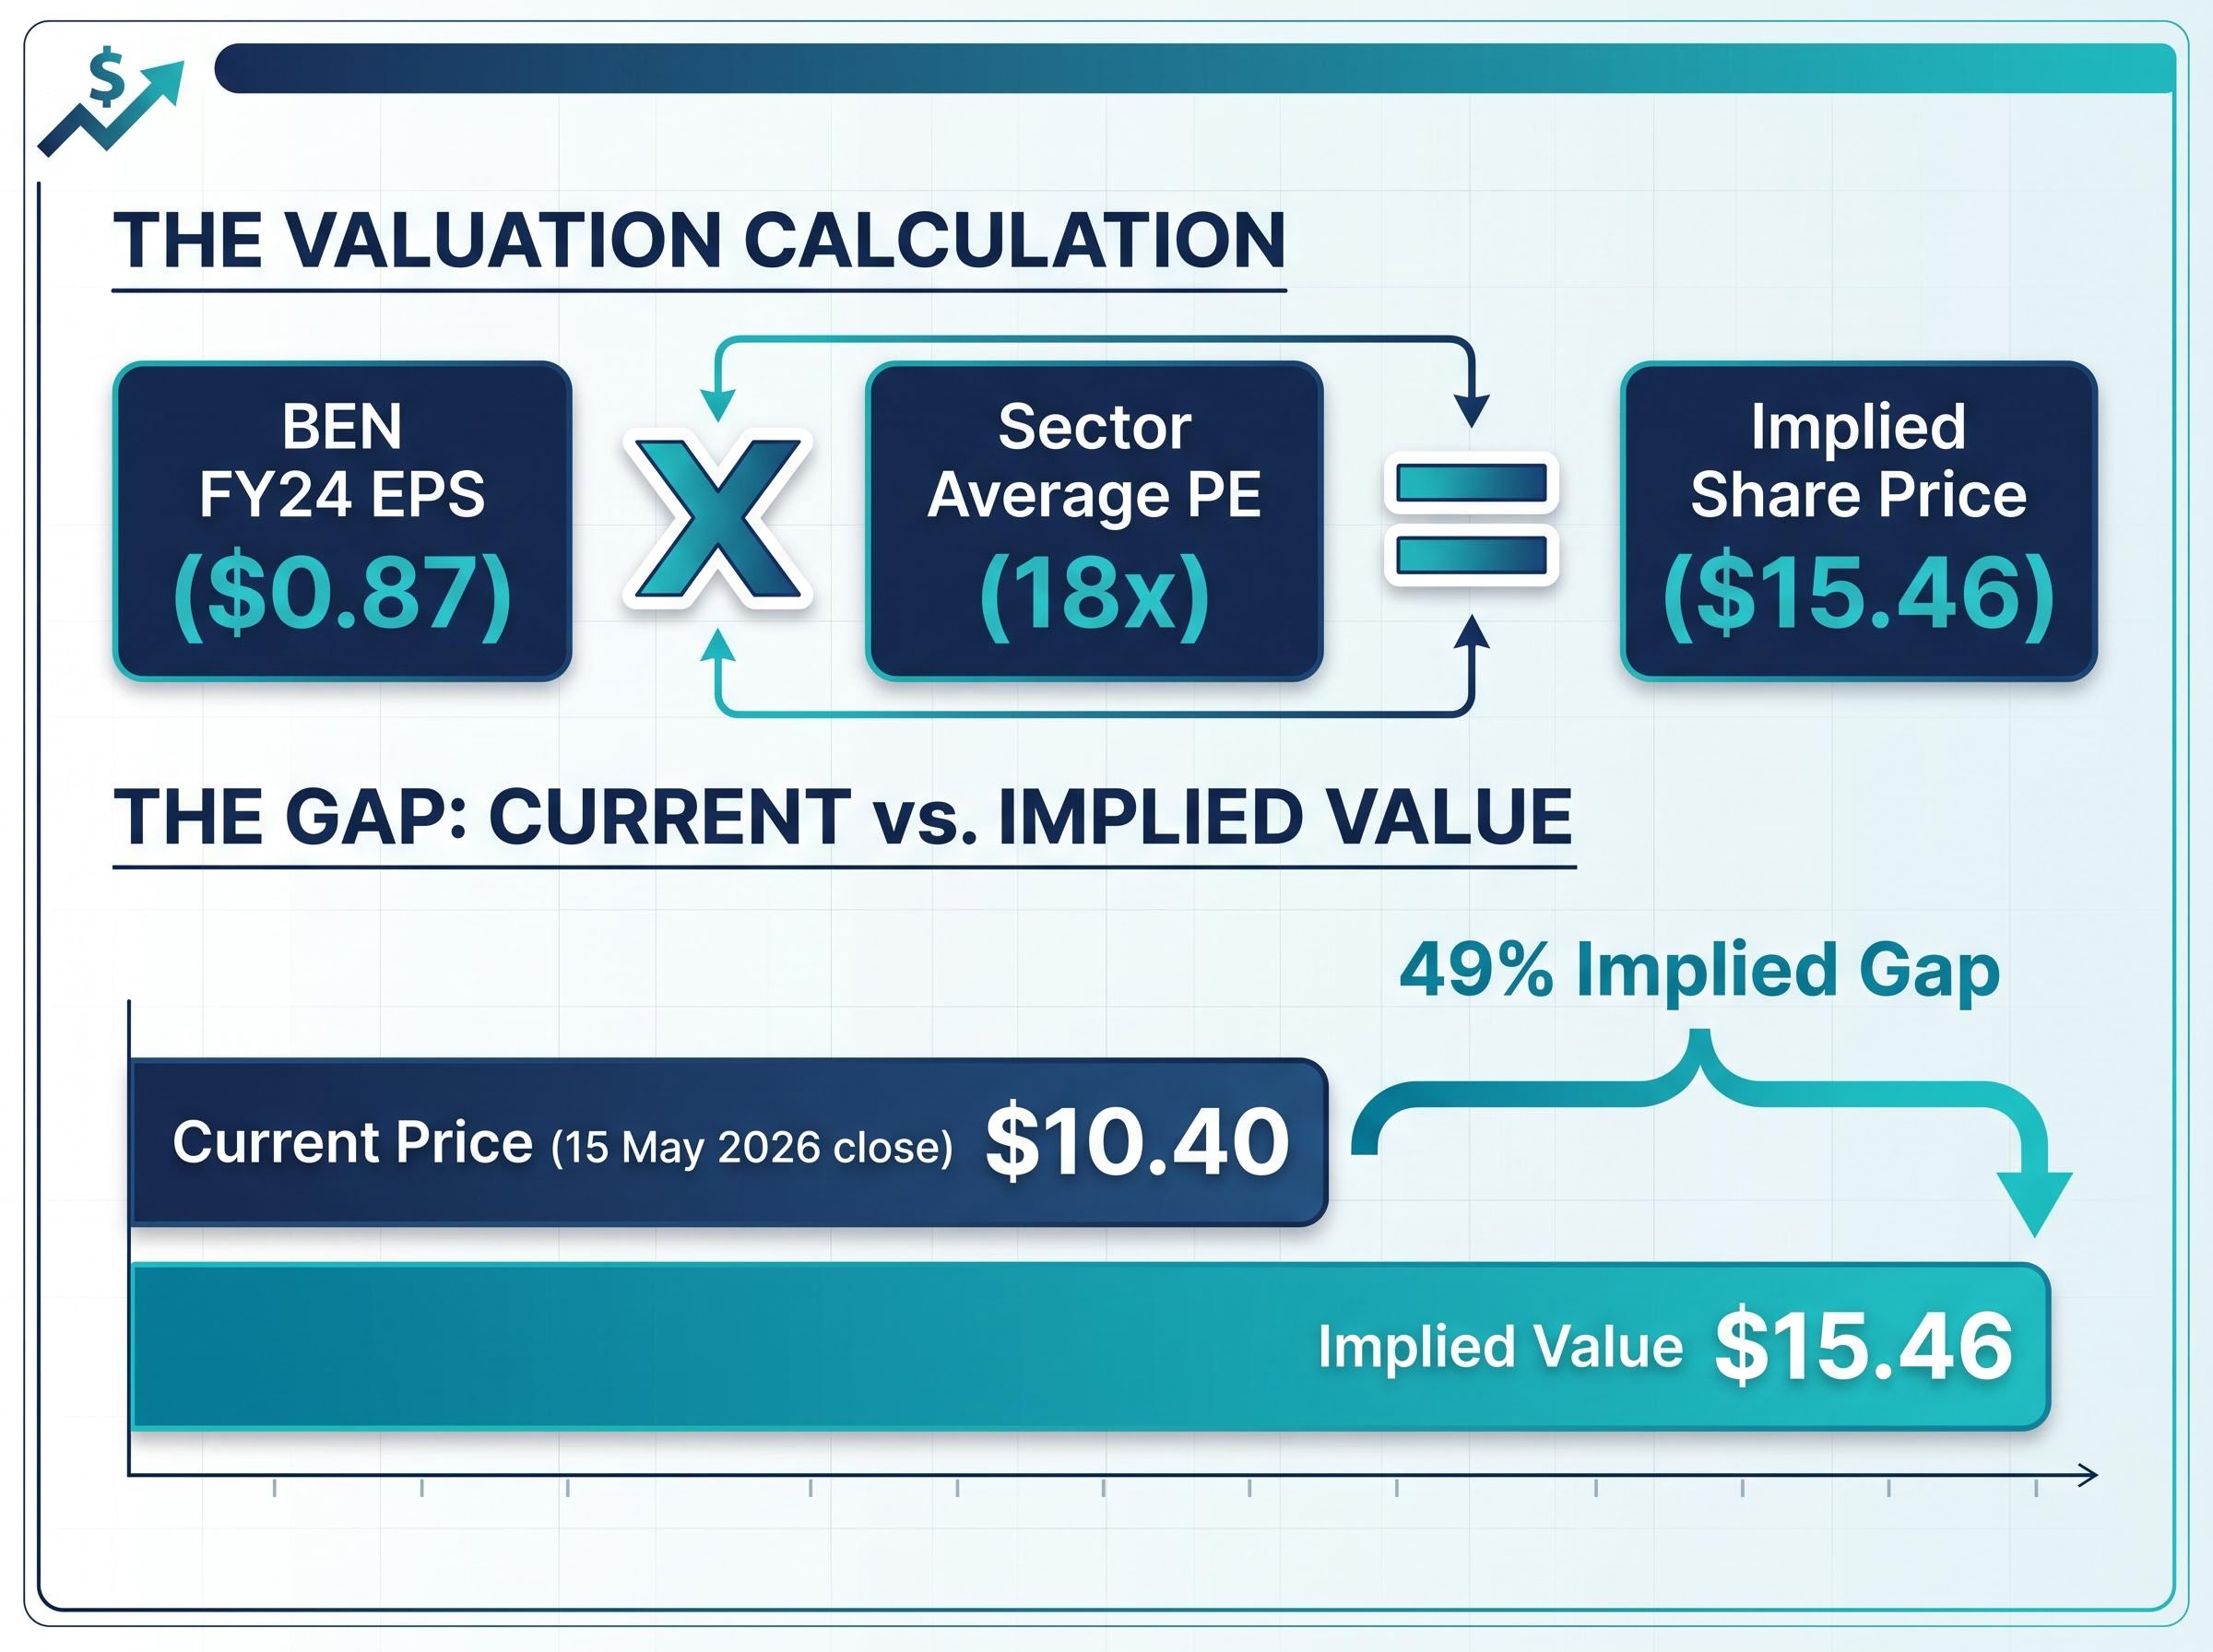
At the sector average PE of 18x, BEN’s EPS of $0.87 implies a share price of $15.46.
To place that gap in context, consider where each major bank sits on the PE spectrum:
| Bank | Approximate trailing PE | Position relative to BEN |
|---|---|---|
| CBA | ~25x | Significant premium |
| NAB | ~18x | Sector reference level |
| WBC / ANZ | Mid-range | Moderate premium |
| BEN | ~12x | Current subject |
| BOQ | Low-to-mid teens | Comparable regional |
This is the quantitative centrepiece of the framework. With an updated EPS figure and a current sector PE, any investor can replicate this calculation for any ASX-listed bank.
The $15.46 figure is not a price target. It represents what BEN’s share price would be if the market valued its earnings at the same multiple it assigns to the sector average. The next question is whether BEN deserves that multiple.
Why the discount may be structural, not a mispricing
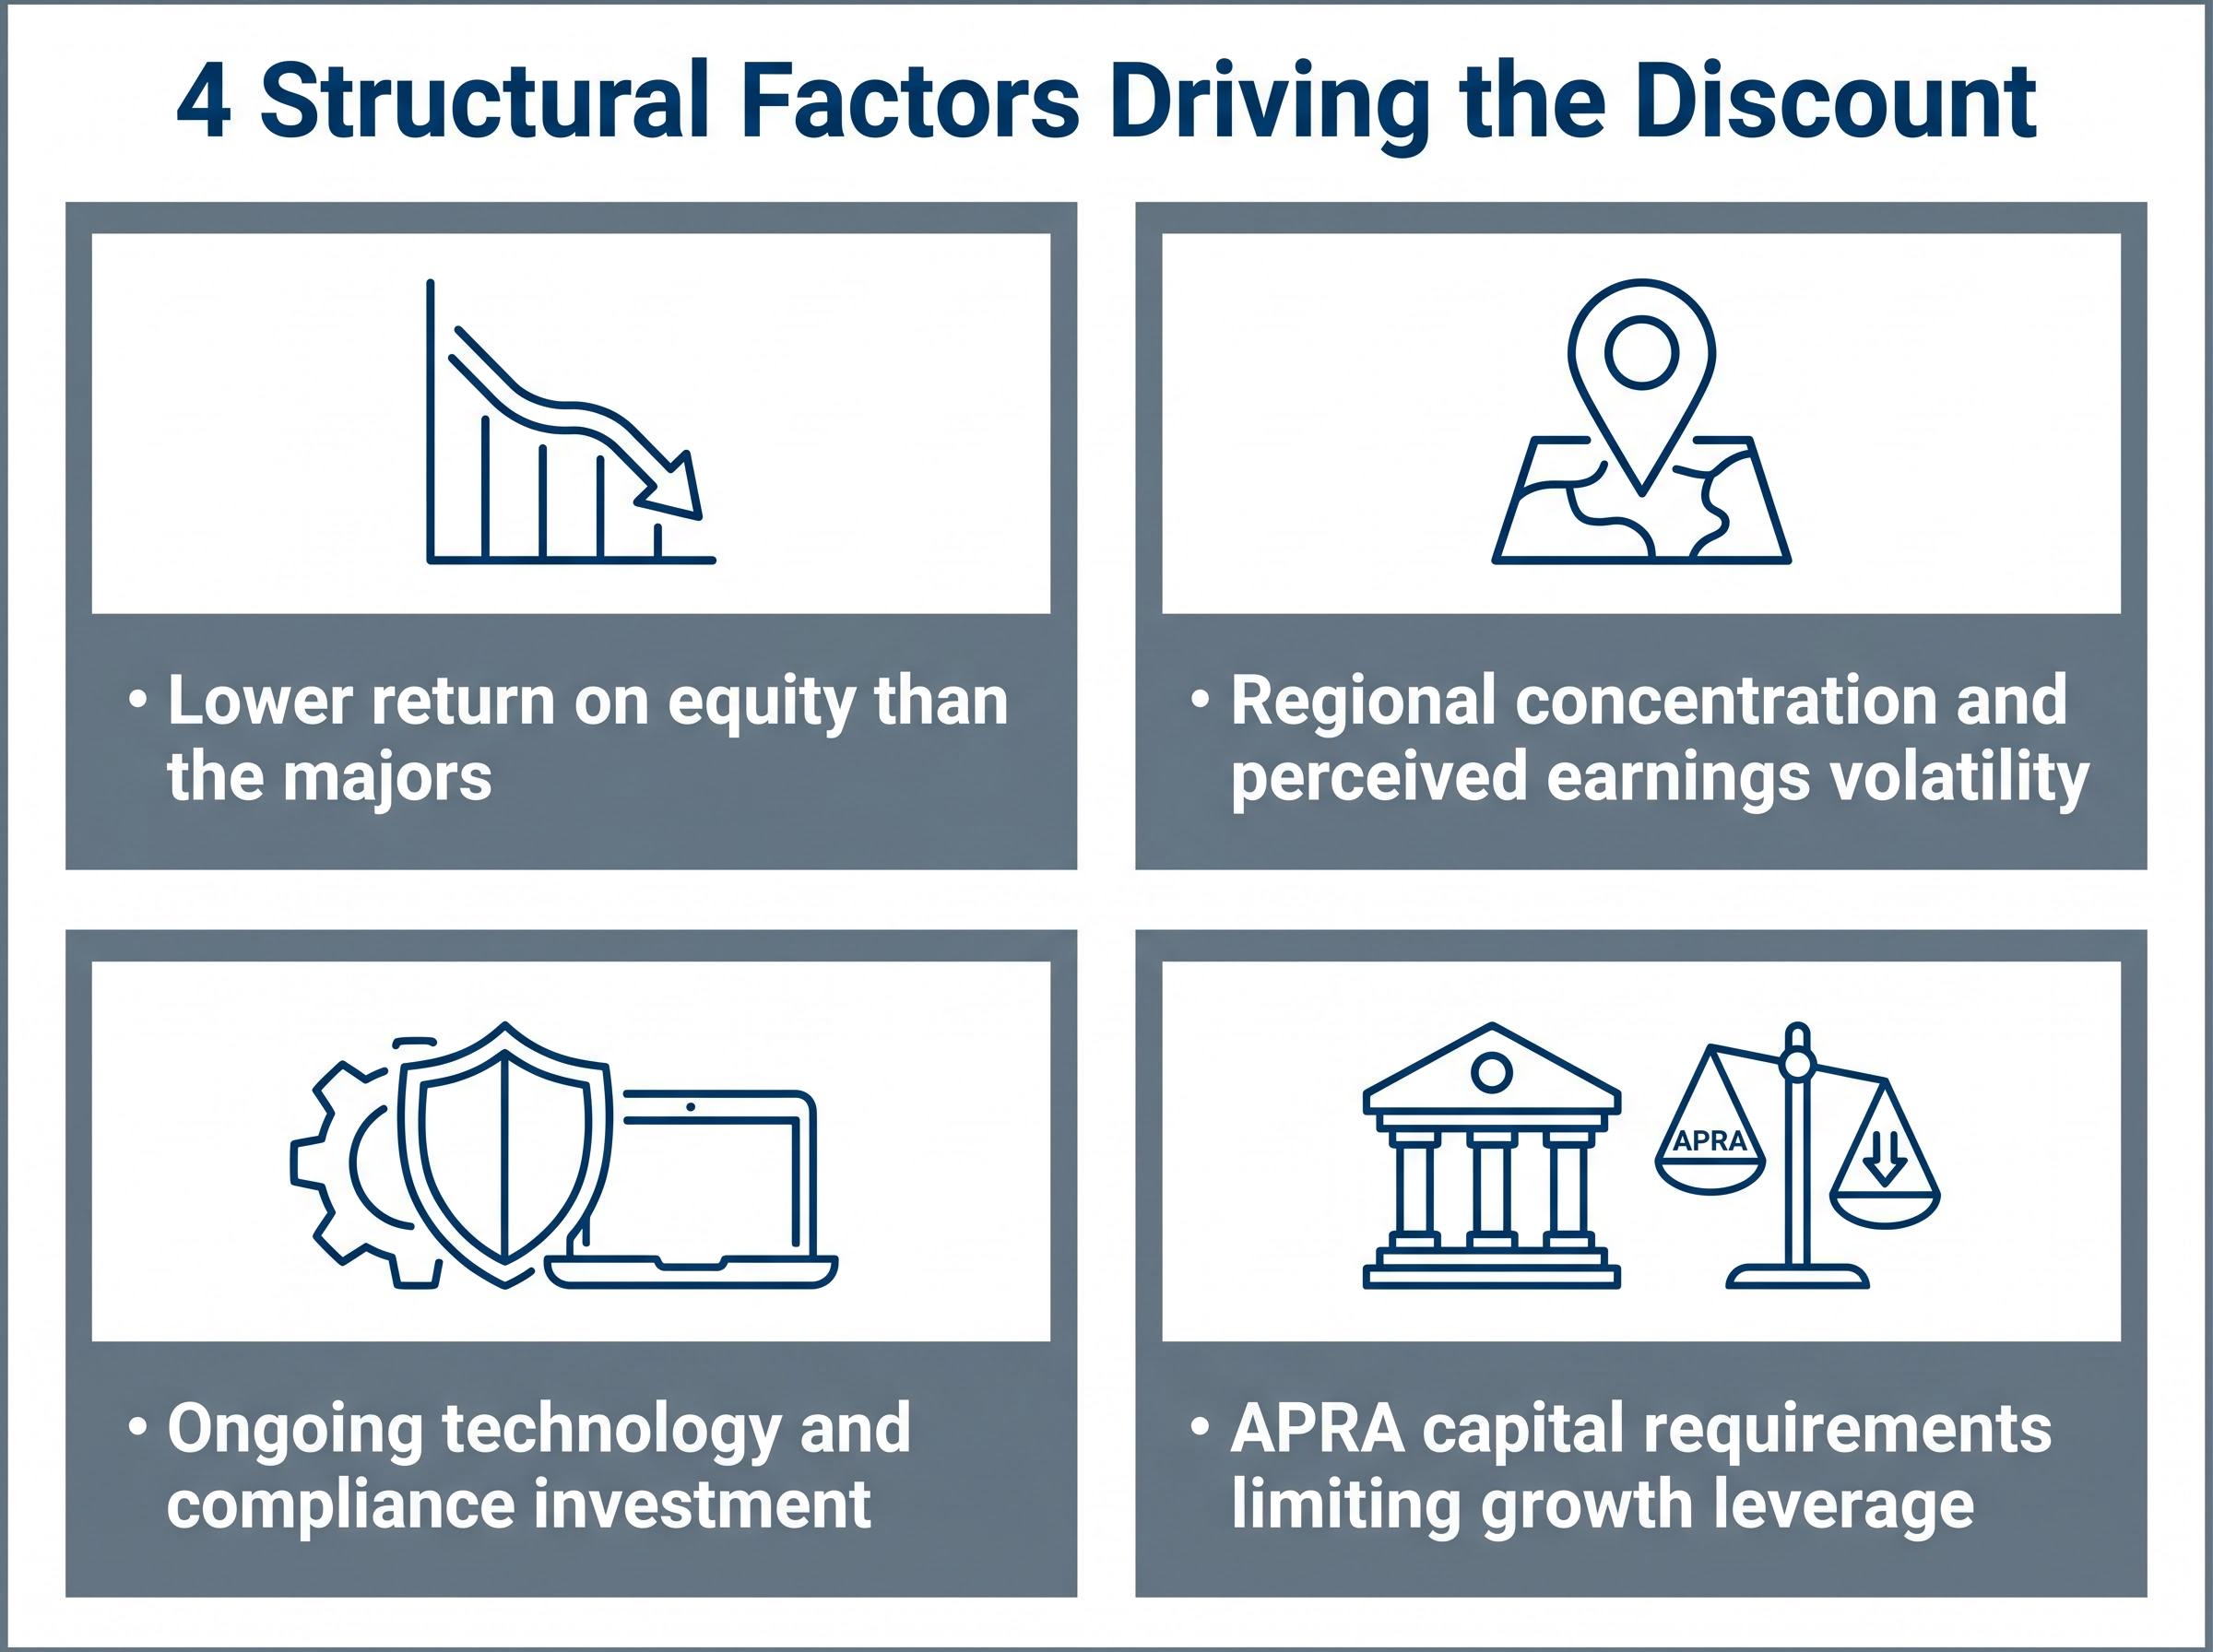
A 49% implied gap between current price and sector-adjusted value is large enough to demand explanation. Four structural factors account for the persistent discount:
- Lower return on equity than the majors. BEN’s smaller scale and regional concentration produce a lower ROE, and ROE is the single most important driver of PE multiples across the banking sector. CBA’s premium multiple reflects its consistently higher returns.
- Regional concentration and perceived earnings volatility. A more geographically concentrated loan book exposes BEN to localised economic conditions, adding perceived risk relative to the diversified majors.
- Ongoing technology and compliance investment. Management commentary from 1H FY25 updates highlighted continued spending on digital platforms and risk systems, holding back near-term EPS growth.
- APRA capital requirements limiting growth leverage. Regulatory capital adequacy requirements constrain the balance sheet leverage available to all Australian banks, but the constraint binds more tightly on smaller institutions with less capacity to generate organic capital.
This regional bank discount has persisted across multiple market cycles for both BEN and BOQ, suggesting it reflects structural differences in franchise quality and profitability rather than temporary market mispricing.
A dividend discount model for BEN applied with different discount rate and growth assumptions produces an output range of $7.22 to $32.50 per share, a spread that illustrates how qualitative judgment about the rate cycle, NIM trajectory, and earnings durability drives model outputs more than the formula itself.
Broker commentary through 2025-26 has characterised BEN with “Hold” or “Neutral” ratings, with price targets only modestly above the prevailing share price. The consensus implies limited upside rather than a strong buy case.
What a PE ratio cannot tell you about a bank
The PE ratio has three specific blind spots that are particularly relevant when valuing banks:
- It ignores earnings cyclicality. Bank profits are highly sensitive to net interest margins, which shift with the rate cycle. BEN’s 1H FY25 updates noted NIM pressure from deposit competition and fixed-rate loan roll-offs. A PE calculated on earnings that are above or below mid-cycle may overstate or understate true value.
- It does not adjust for provisioning levels. Credit quality at BEN remains sound with low impairments, but very low bad-debt charges are unlikely to persist indefinitely. A PE applied to EPS that benefits from unusually low provisions may overstate the stock’s cheapness.
- It says nothing about balance sheet quality or capital adequacy. Banks are balance-sheet businesses. A low PE means little if the balance sheet carries hidden stress.
RBA research on interest rates and bank profitability finds that net interest margin compression during rate cycles affects smaller banks more acutely than the major franchises, a pattern consistent with the NIM pressure BEN flagged in its 1H FY25 updates from deposit competition and fixed-rate loan roll-offs.
Dividend yield and price-to-book (P/B) serve as useful cross-checks alongside PE. A bank trading on a low PE with a high, sustainable yield and a discounted P/B presents a different proposition from one where only the PE looks attractive.
The next major ASX story will hit our subscribers first
What this valuation gap means for investors assessing BEN today
The PE framework produces a clear quantitative output: BEN at approximately 12x versus a sector reference of 18x, implying a $15.46 price if the discount closed entirely. The current price of $10.40 sits 49% below that figure.
Whether that gap represents genuine opportunity depends on one question: can BEN’s ROE trajectory and earnings quality justify a re-rating toward the sector average, or does the current multiple fairly reflect the bank’s economics relative to its peers?
The evidence sits on both sides. BEN’s stable dividends and sound credit quality support a value thesis, particularly for income-oriented investors. Against that, the absence of strong EPS growth expectations, ongoing margin pressure, and sustained technology investment explain why the market has not moved to close the discount.
The PE result is a starting point for deeper analysis, not a standalone buy or sell signal. Three qualitative checks form the necessary next layer:
- Macroeconomic conditions: Employment levels, residential property prices, and consumer confidence all feed directly into regional bank earnings.
- Management quality and strategic direction: Whether BEN’s ongoing investment in technology and simplification translates into improved returns will determine whether the multiple can re-rate.
- Dividend sustainability: Cross-checking the dividend yield and payout ratio against earnings quality provides a reality test on the income thesis.
For readers wanting to extend the framework beyond a single metric, our full explainer on ASX bank valuation methods covers PE, price-to-book, dividend discount models, and discounted cash flow analysis in a single integrated guide, with worked examples that show how franking credits and APRA capital requirements alter the outputs for Australian investors.
A 49% gap between current price and sector-adjusted implied value does not automatically signal undervaluation. It signals that the market assigns BEN a structurally lower multiple than the majors, and the investor’s job is to determine whether that discount is excessive, fair, or insufficient.
A gap of 49% is a question, not an answer
The PE framework applied to BEN reveals a material gap between its current share price and its sector-adjusted implied value. Interpreting that gap correctly, however, requires understanding both the mechanics of the calculation and the structural reasons the discount exists.
The three-step process, threshold assessment, peer comparison, and implied valuation modelling, is a reusable framework. With an updated EPS figure and a current sector PE, it applies to any ASX bank stock. The mechanics do not change; only the inputs do.
PE analysis is one layer of a broader bank valuation toolkit. Dividend yield and price-to-book offer natural companion metrics, while qualitative judgment about management execution, macroeconomic conditions, and earnings cyclicality provides the final filter. No single ratio answers the valuation question in isolation.
For investors who want to move from quantitative output to conviction, our dedicated guide to qualitative bank valuation covers the seven dimensions professional analysts examine before trusting any model number: management credibility, loan-book discipline, NIM durability, governance history, franking credit eligibility, balance sheet quality, and the discipline of reading the strongest bear case before committing capital.
This article is for informational purposes only and should not be considered financial advice. Investors should conduct their own research and consult with financial professionals before making investment decisions. Past performance does not guarantee future results. Financial projections are subject to market conditions and various risk factors.