VAS vs VHY: Why the Lower-Yield ETF Wins in Retirement
4 hrs ago

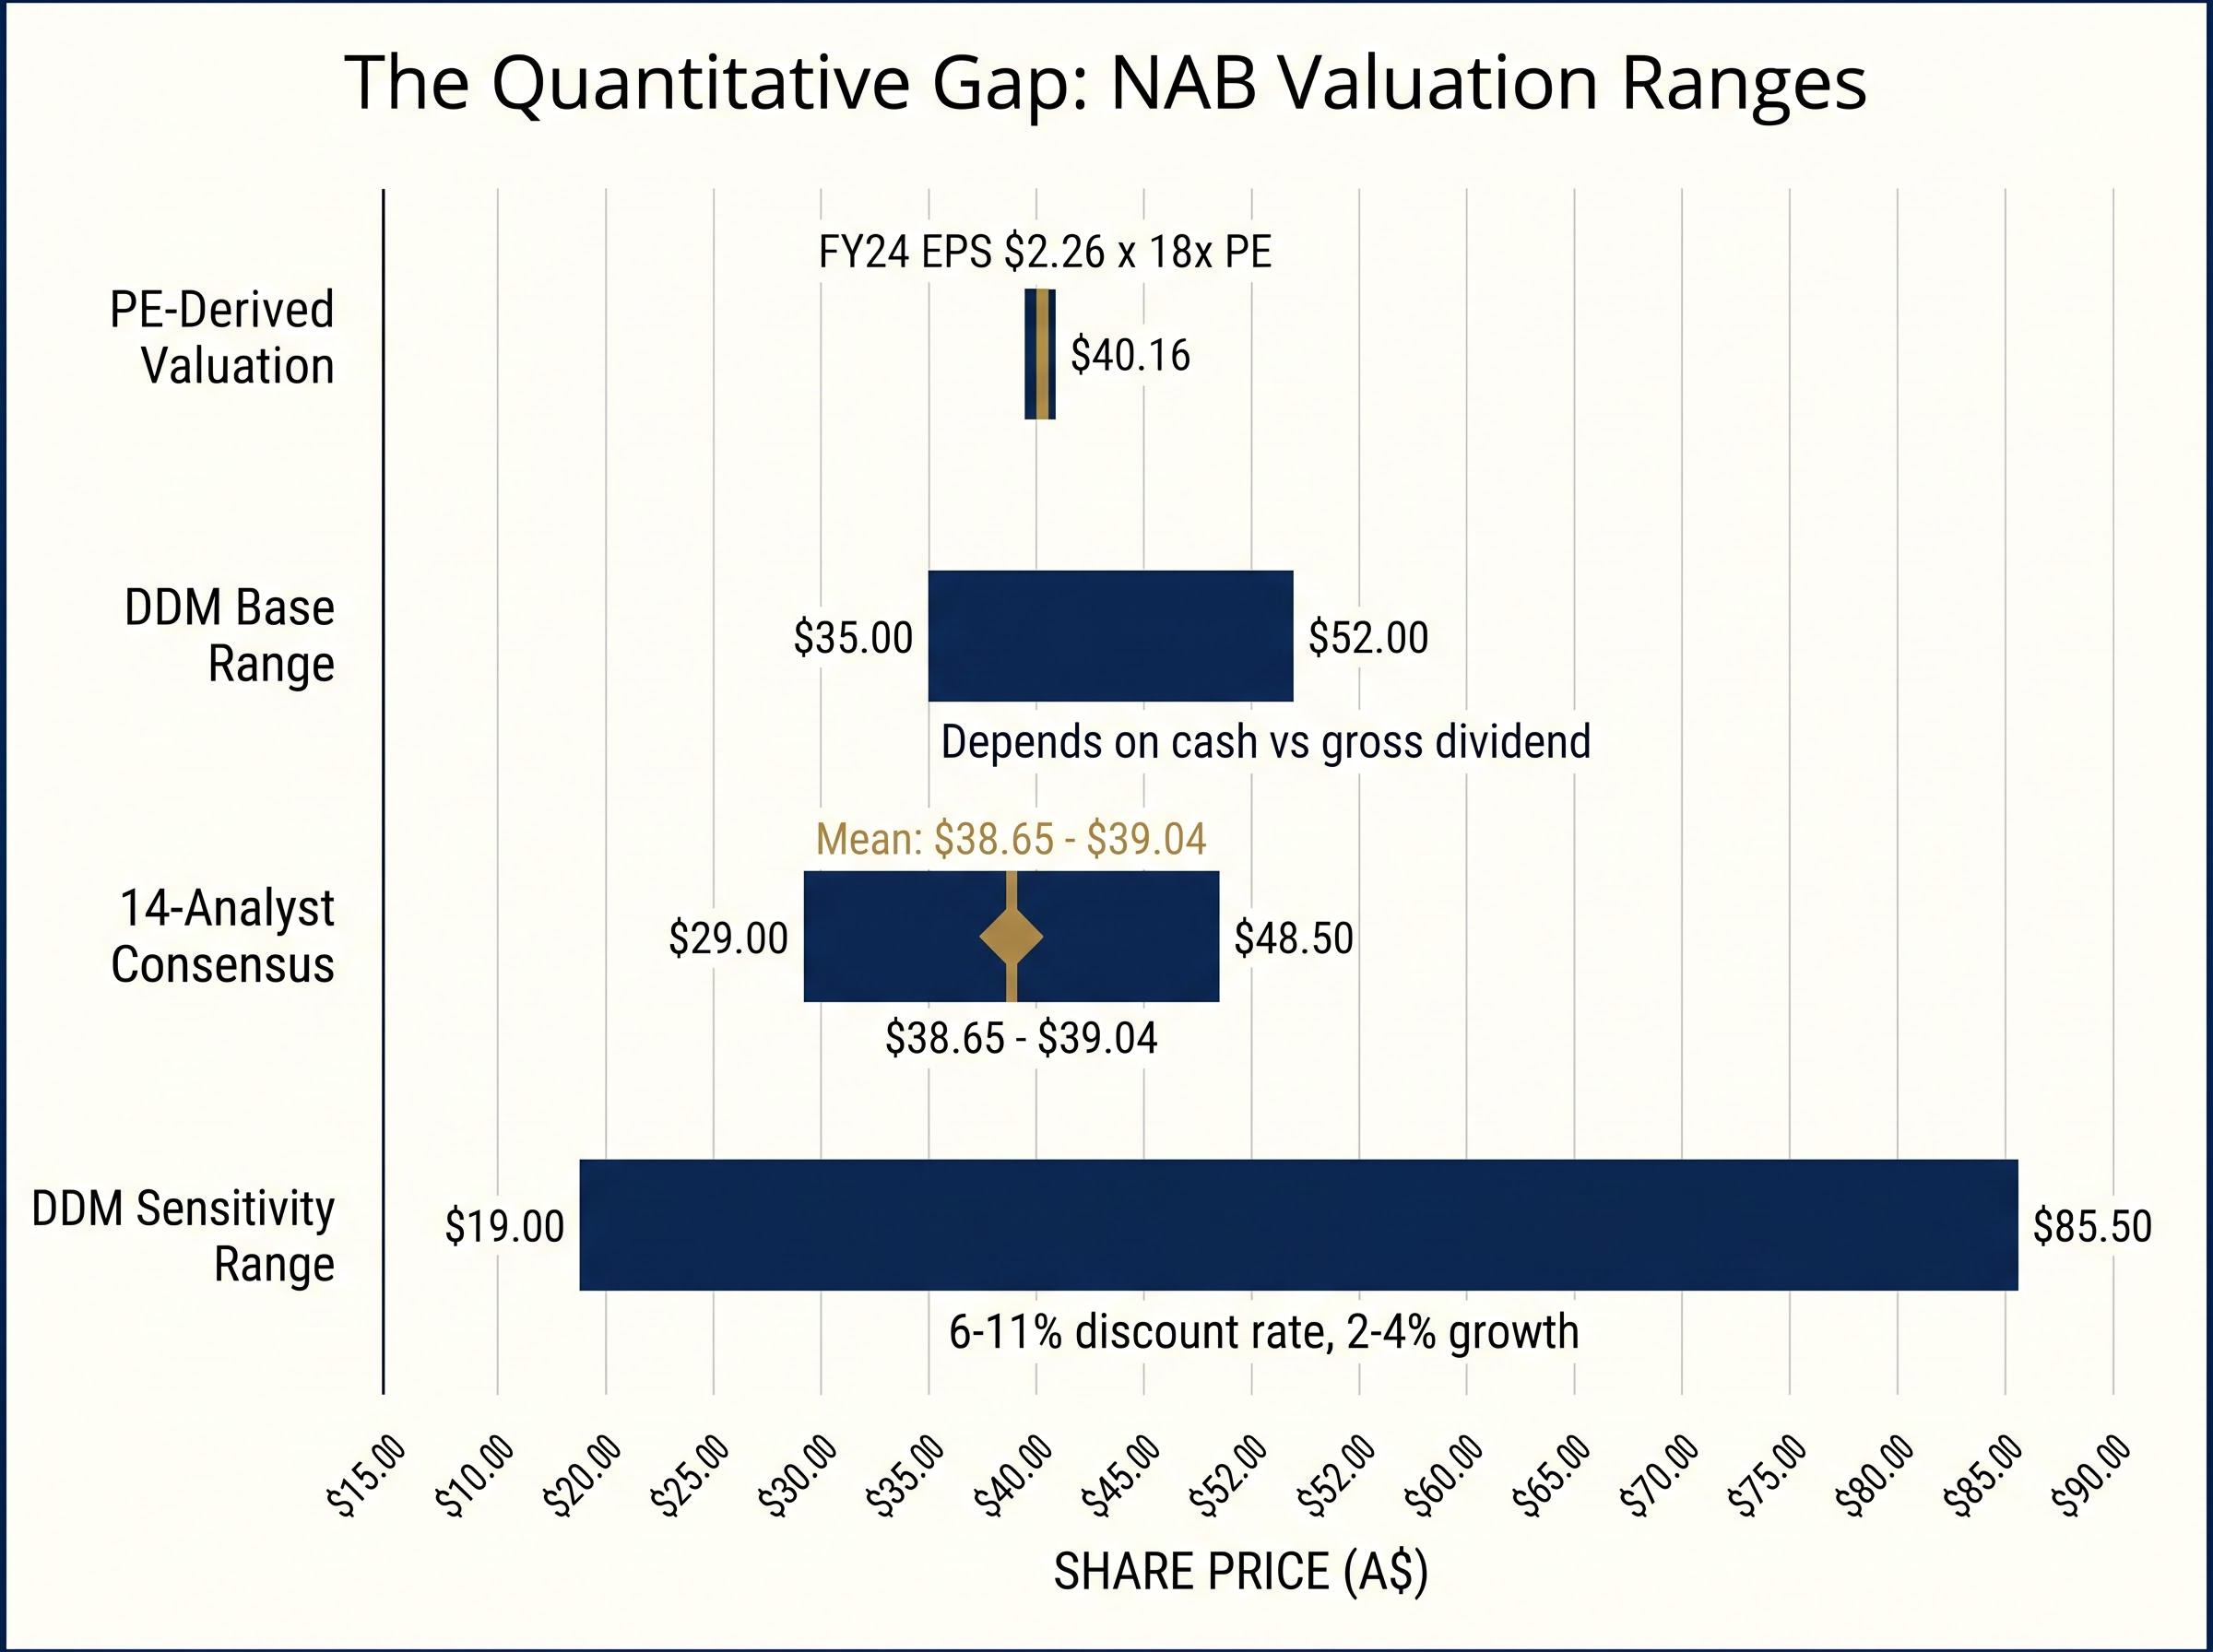
An investor runs the numbers on National Australia Bank (NAB) and arrives at a price-to-earnings valuation of roughly $40 per share. A dividend discount model produces a range of $35 to $52. The numbers look plausible. But the analyst consensus mean sits at $38.65 to $39.04, the range spans $29.00 to $48.50, and fourteen professionals cannot agree on direction. If the quantitative inputs are the same inputs everyone else is using, what separates investors who get these decisions right from those who do not? ASX bank stocks, including NAB, CBA, ANZ, and Westpac, account for roughly one-third of the Australian equities market by capitalisation. For yield-focused investors, they are unavoidable. But the financial models most commonly applied to them, PE multiples and dividend discount models, are blunt instruments. They say nothing about management credibility, loan-book discipline, or whether the board is telling investors what they need to hear. This guide provides a practical qualitative research framework to use after the numbers are done. By the end, the reader will know what to read, what to look for, and how to stress-test conviction before committing capital.
NAB’s analyst consensus, as of mid-May 2026, illustrates the problem precisely. Fourteen analysts produce a mean 12-month price target of approximately $38.65 to $39.04. The range runs from $29.00 at the bearish end to $48.50 at the bullish end. These professionals are working from broadly similar quantitative inputs and arriving at wildly different conclusions.
The core quantitative outputs most investors have in hand look like this:
These three outputs are close enough to feel reassuring. They are also wide enough to be inconclusive.
The PE multiple and dividend discount model are the most commonly applied ASX bank stock valuation methods, but each carries structural limitations specific to banking: reported earnings can shift materially on a single provision movement, and DDM outputs are acutely sensitive to the discount rate assumption used rather than to the bank’s underlying operating trajectory.
A DDM sensitivity table for NAB produces valuations ranging from $19.00 to $85.50, depending on discount rate (6% to 11%) and growth rate (2% to 4%) assumptions. That is not a margin of safety. It is a confession that the model alone cannot resolve the question.
The spread between the most bearish and most bullish analyst targets is not random noise. It reflects genuine disagreement about qualitative factors that the numbers cannot capture: how long margins hold, whether the loan book is as clean as provisions suggest, and whether management is guiding honestly. Quantitative models are inputs to a decision. They are not the decision itself.
Banks are fundamentally opaque compared to most other businesses. The quality of a loan book, the credibility of provisions, and the prudence of underwriting standards are not visible on a balance sheet without interpretation. A retailer’s inventory sits in a warehouse. A bank’s risk sits in the judgment calls of thousands of lending officers, and the only window into those calls is qualitative.
ASX bank stocks represent approximately one-third of the Australian equities market by capitalisation. Qualitative literacy about this sector is not a niche skill; it is broadly relevant to anyone holding Australian equities. Analyst commentary throughout 2025 returned repeatedly to the same themes: margin durability, underwriting discipline, credit quality timing, and guidance credibility. These are not quantitative inputs. They are judgment calls.
APRA’s credit risk management standards require authorised deposit-taking institutions to maintain documented frameworks for assessing, approving, and monitoring credit exposures, which means the loan-book quality that qualitative analysts are trying to read from annual reports is itself shaped by regulatory obligations that set a minimum floor for disclosure and provisioning practice.
Seven qualitative dimensions govern whether the numbers will hold up over time:
The difference between a board that governs and a board that rubber-stamps is visible in how a bank responds to its own failures. Incentive structures reveal whether executives are rewarded for short-term lending volume or long-term asset quality. Accountability for compliance failures, or the absence of it, signals how seriously risk culture is embedded.
Communication credibility is where qualitative analysis earns its keep. Candid reporting carries specific markers: explicit risk acknowledgement, consistent language across different sections of the same report, and guidance that holds up against subsequent outcomes. Evasive reporting also has markers: defensive language around arrears, vague margin commentary, and heavy emphasis on “disciplined growth” without supporting detail.
The same discipline applies to management language in earnings documents across reporting formats: investor relations teams deliberately sequence metrics to front-load favourable results, and the Q&A section of an analyst call, where responses are unrehearsed, reveals shifts in confidence through hedging language and metric switching that scripted prepared remarks never surface.
Three years of annual reports is the recommended minimum baseline. One year captures a snapshot. Three years reveals whether management’s words have matched their outcomes over a cycle that includes at least one period of stress.
The task is not to read every page. It is to read three specific sections with a specific purpose. In the letter to shareholders, look for tone and specificity: does the CEO name specific risks, or does the letter read like a press release? In the risk section, check whether risks named the previous year were managed, still present, or quietly dropped from the list. In the commentary accompanying financial results, assess whether margin pressure, arrears, or provisions are acknowledged plainly or obscured behind generalities.
The cross-referencing discipline is where signal emerges. Compare what management said about net interest margins, credit quality, and loan growth in Year 1 with what they reported in Year 2 and Year 3. If guidance was credible, the trajectory should be consistent. If it was not, the divergence will be visible.
Evasion flags:
Credibility flags:
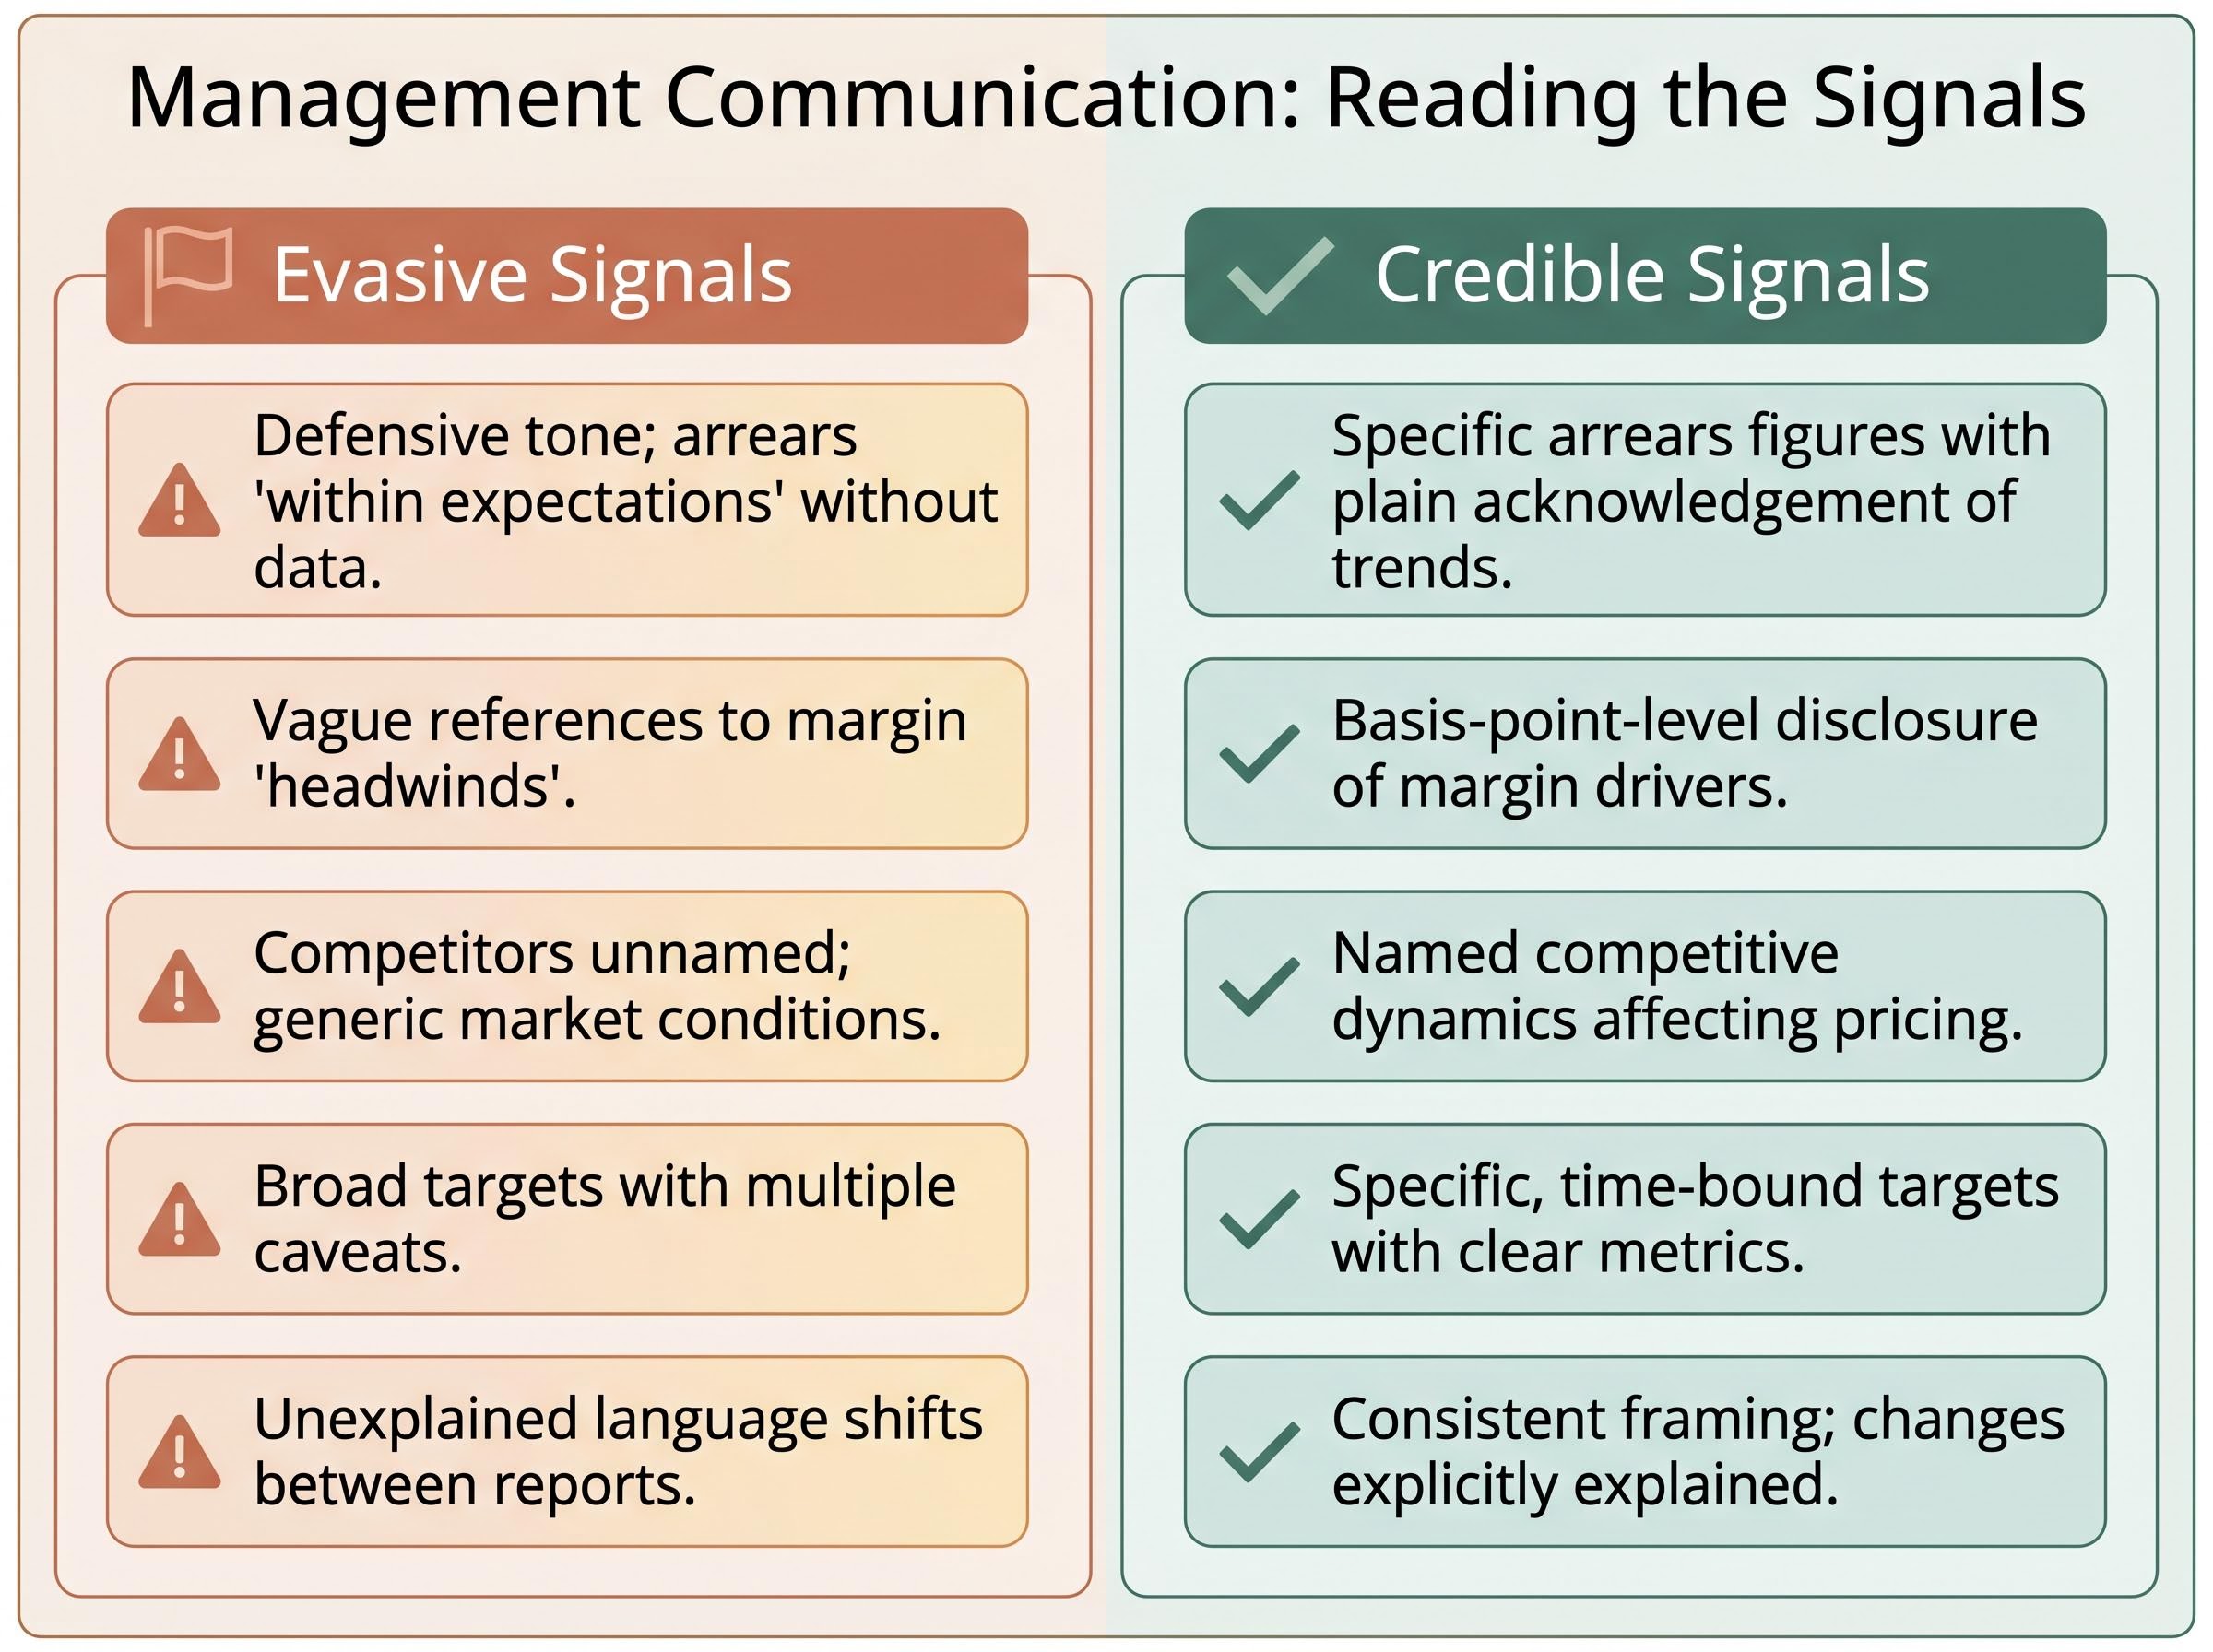
| Dimension | Evasive Signal | Credible Signal |
|---|---|---|
| Language around arrears | Defensive or dismissive tone; arrears described as “within expectations” without data | Specific arrears figures cited with plain acknowledgement of trends |
| Margin commentary | Vague references to “headwinds” without quantified impact | Basis-point-level disclosure of margin movement and drivers |
| Competitive threat acknowledgement | Competitors unnamed; market conditions described generically | Named competitive dynamics and their effect on pricing or volumes |
| Guidance specificity | Broad targets with multiple caveats and no measurable benchmarks | Specific, time-bound targets with clear metrics for success |
| Cross-report consistency | Language shifts between interim and full-year without explanation | Consistent framing across reports; changes in outlook explicitly explained |
The most valuable analyst reports to read first on NAB are not the ones that confirm the bullish thesis. They are the ones rated Hold or Underperform. Not because those analysts are necessarily right, but because they have built the strongest structural case for why the bullish thesis could fail.
As of mid-May 2026, overall analyst sentiment on NAB tilts toward Hold/Underperform among the 14-analyst consensus. That tilt is itself a data point worth taking seriously.
Five bearish themes have recurred across 2025 ASX bank commentary:
Seeking the strongest case against a position is how conviction becomes earned rather than assumed. The investors who avoid the most expensive mistakes are not those who found the best bullish case; they are those who found the best bearish case and chose to invest anyway.
The practical sourcing method is straightforward. Livewire Markets publishes fund-manager interviews where both bullish and bearish theses on banks are debated openly. Morningstar Australia research notes provide moat and risk assessment. AFR commentary archives cover results analysis with sector context. The reader should look for a named analyst or fund manager who has published a thesis that contradicts the consensus, and read it carefully before deciding it is wrong.
The qualitative framework covered in the preceding sections can be distilled into a ten-point pre-commitment checklist. This is not a guarantee of a correct decision. It is a process for ensuring the decision is made with eyes open rather than on the basis of a single number.
The ninth point is not trivial. NAB’s DDM valuation changes materially depending on whether the $1.69 cash dividend or the $2.44 gross dividend (inclusive of franking credits) is used. An investor who is ineligible for full franking credit refunds but models the gross dividend is overstating the stock’s value to them personally.
Franking credit eligibility is not a binary consideration: pension-phase SMSF members receive the credit as a direct ATO cash refund, while investors in accumulation phase or on high marginal tax rates see a materially different after-tax outcome, and an investor who is ineligible for full franking credit refunds but models the gross dividend will systematically overstate the stock’s value to their specific circumstances.
Four platforms serve as starting points for the qualitative research this checklist requires. Morningstar Australia provides moat assessment and risk analysis with a long-term valuation lens. Livewire Markets hosts fund-manager and analyst debates that surface competing theses on individual banks. ASX Investor Update publishes sector commentary and investor education. The Australian Financial Review covers results analysis with the specificity that earnings-season commentary demands.
Morningstar Australia and the AFR involve subscription access for deeper research. That cost is itself a qualitative investment discipline worth acknowledging: the most useful analysis is rarely free, and the willingness to pay for it signals a seriousness about the process.
For readers who want to extend this analytical discipline to interim and full-year results as they are released, our dedicated guide to reading earnings reports beyond headline numbers covers how to track the gap between non-GAAP and GAAP earnings across consecutive periods, how disappearing KPIs signal deteriorating performance before it reaches headline figures, and how to cross-reference cash flow against reported income to test whether stated earnings quality holds up.
PE ratios and dividend discount models are legitimate and useful tools. They earn the right to sit at the centre of a valuation process. But they are inputs to qualitative judgment, not substitutes for it.
Running the numbers earns the right to ask the harder questions. Has management been candid? Is the loan book as clean as provisions suggest? Is the bear case priced in, or has the market assumed it away? The harder questions are where the actual edge lives.
An investor who has already run a NAB valuation and worked through the qualitative checklist above is in a fundamentally different position from one who stopped at the PE calculation or the DDM output. One has done arithmetic. The other has done analysis.
This article is for informational purposes only and should not be considered financial advice. Investors should conduct their own research and consult with financial professionals before making investment decisions.
A dividend discount model estimates a stock's intrinsic value by discounting expected future dividends back to the present. For NAB, this model produces a wide valuation range of $35 to $52 depending on the dividend input used, and a sensitivity table spanning $19.00 to $85.50 across different discount and growth rate assumptions, illustrating why the model alone cannot resolve the investment question.
NAB's valuation changes materially depending on whether the $1.69 cash dividend or the $2.44 gross dividend inclusive of franking credits is used as the model input. Investors who are ineligible for full franking credit refunds but model the gross dividend will systematically overstate the stock's value to their personal circumstances.
Key qualitative factors include management communication credibility, loan-book quality and concentration risk, net interest margin durability, credit quality and impairment trends, strategy execution, and governance and risk culture. These dimensions determine whether the quantitative numbers in a valuation model will hold up over time.
As of mid-May 2026, fourteen analysts covering NAB produce a mean price target of approximately $38.65 to $39.04, with individual targets ranging from $29.00 at the bearish end to $48.50 at the bullish end. This spread reflects genuine disagreement about qualitative factors such as margin durability, loan-book quality, and management guidance credibility that quantitative models cannot capture.
Review three years of annual reports and focus on the letter to shareholders, the risk section, and the financial commentary accompanying results. Look for whether named risks from prior years were managed or quietly dropped, whether margin and arrears commentary is specific and quantified, and whether guidance from earlier years holds up against subsequently reported outcomes.