Two ASX blue-chip stocks, both yielding around 3.6% to 4.0%, both appearing on defensive income lists, and both carrying household-name recognition. On the surface, Telstra and Transurban look interchangeable. Look closer at three specific financial metrics, and they tell very different stories about balance sheet risk, capital efficiency, and income reliability.
Retail investors screening for quality ASX blue-chips often encounter this problem. A crowded field of mature companies with similar yield profiles can make surface-level comparison, based on sector label, brand familiarity, or headline dividend, feel like enough. It rarely is. Without a structured process for ASX stock analysis, meaningful differences in financial health and risk profile stay hidden until they matter most.
This guide walks through a practical three-metric screening framework, built on debt-to-equity ratio, average dividend yield, and return on equity, and applies it to Telstra (ASX: TLS) and Transurban (ASX: TCL) using FY24 reported figures and the latest available data. The goal is not a verdict on either company. It is a replicable process that works on any mature stock.
Why three metrics are enough to start (and what they cannot tell you)
Screening does not need to be complicated. Three metrics can do a surprising amount of filtering work, but only if an investor understands what each one is actually measuring rather than treating them as boxes to tick.
These are not arbitrary choices. Each metric serves as a proxy for a distinct investor concern:
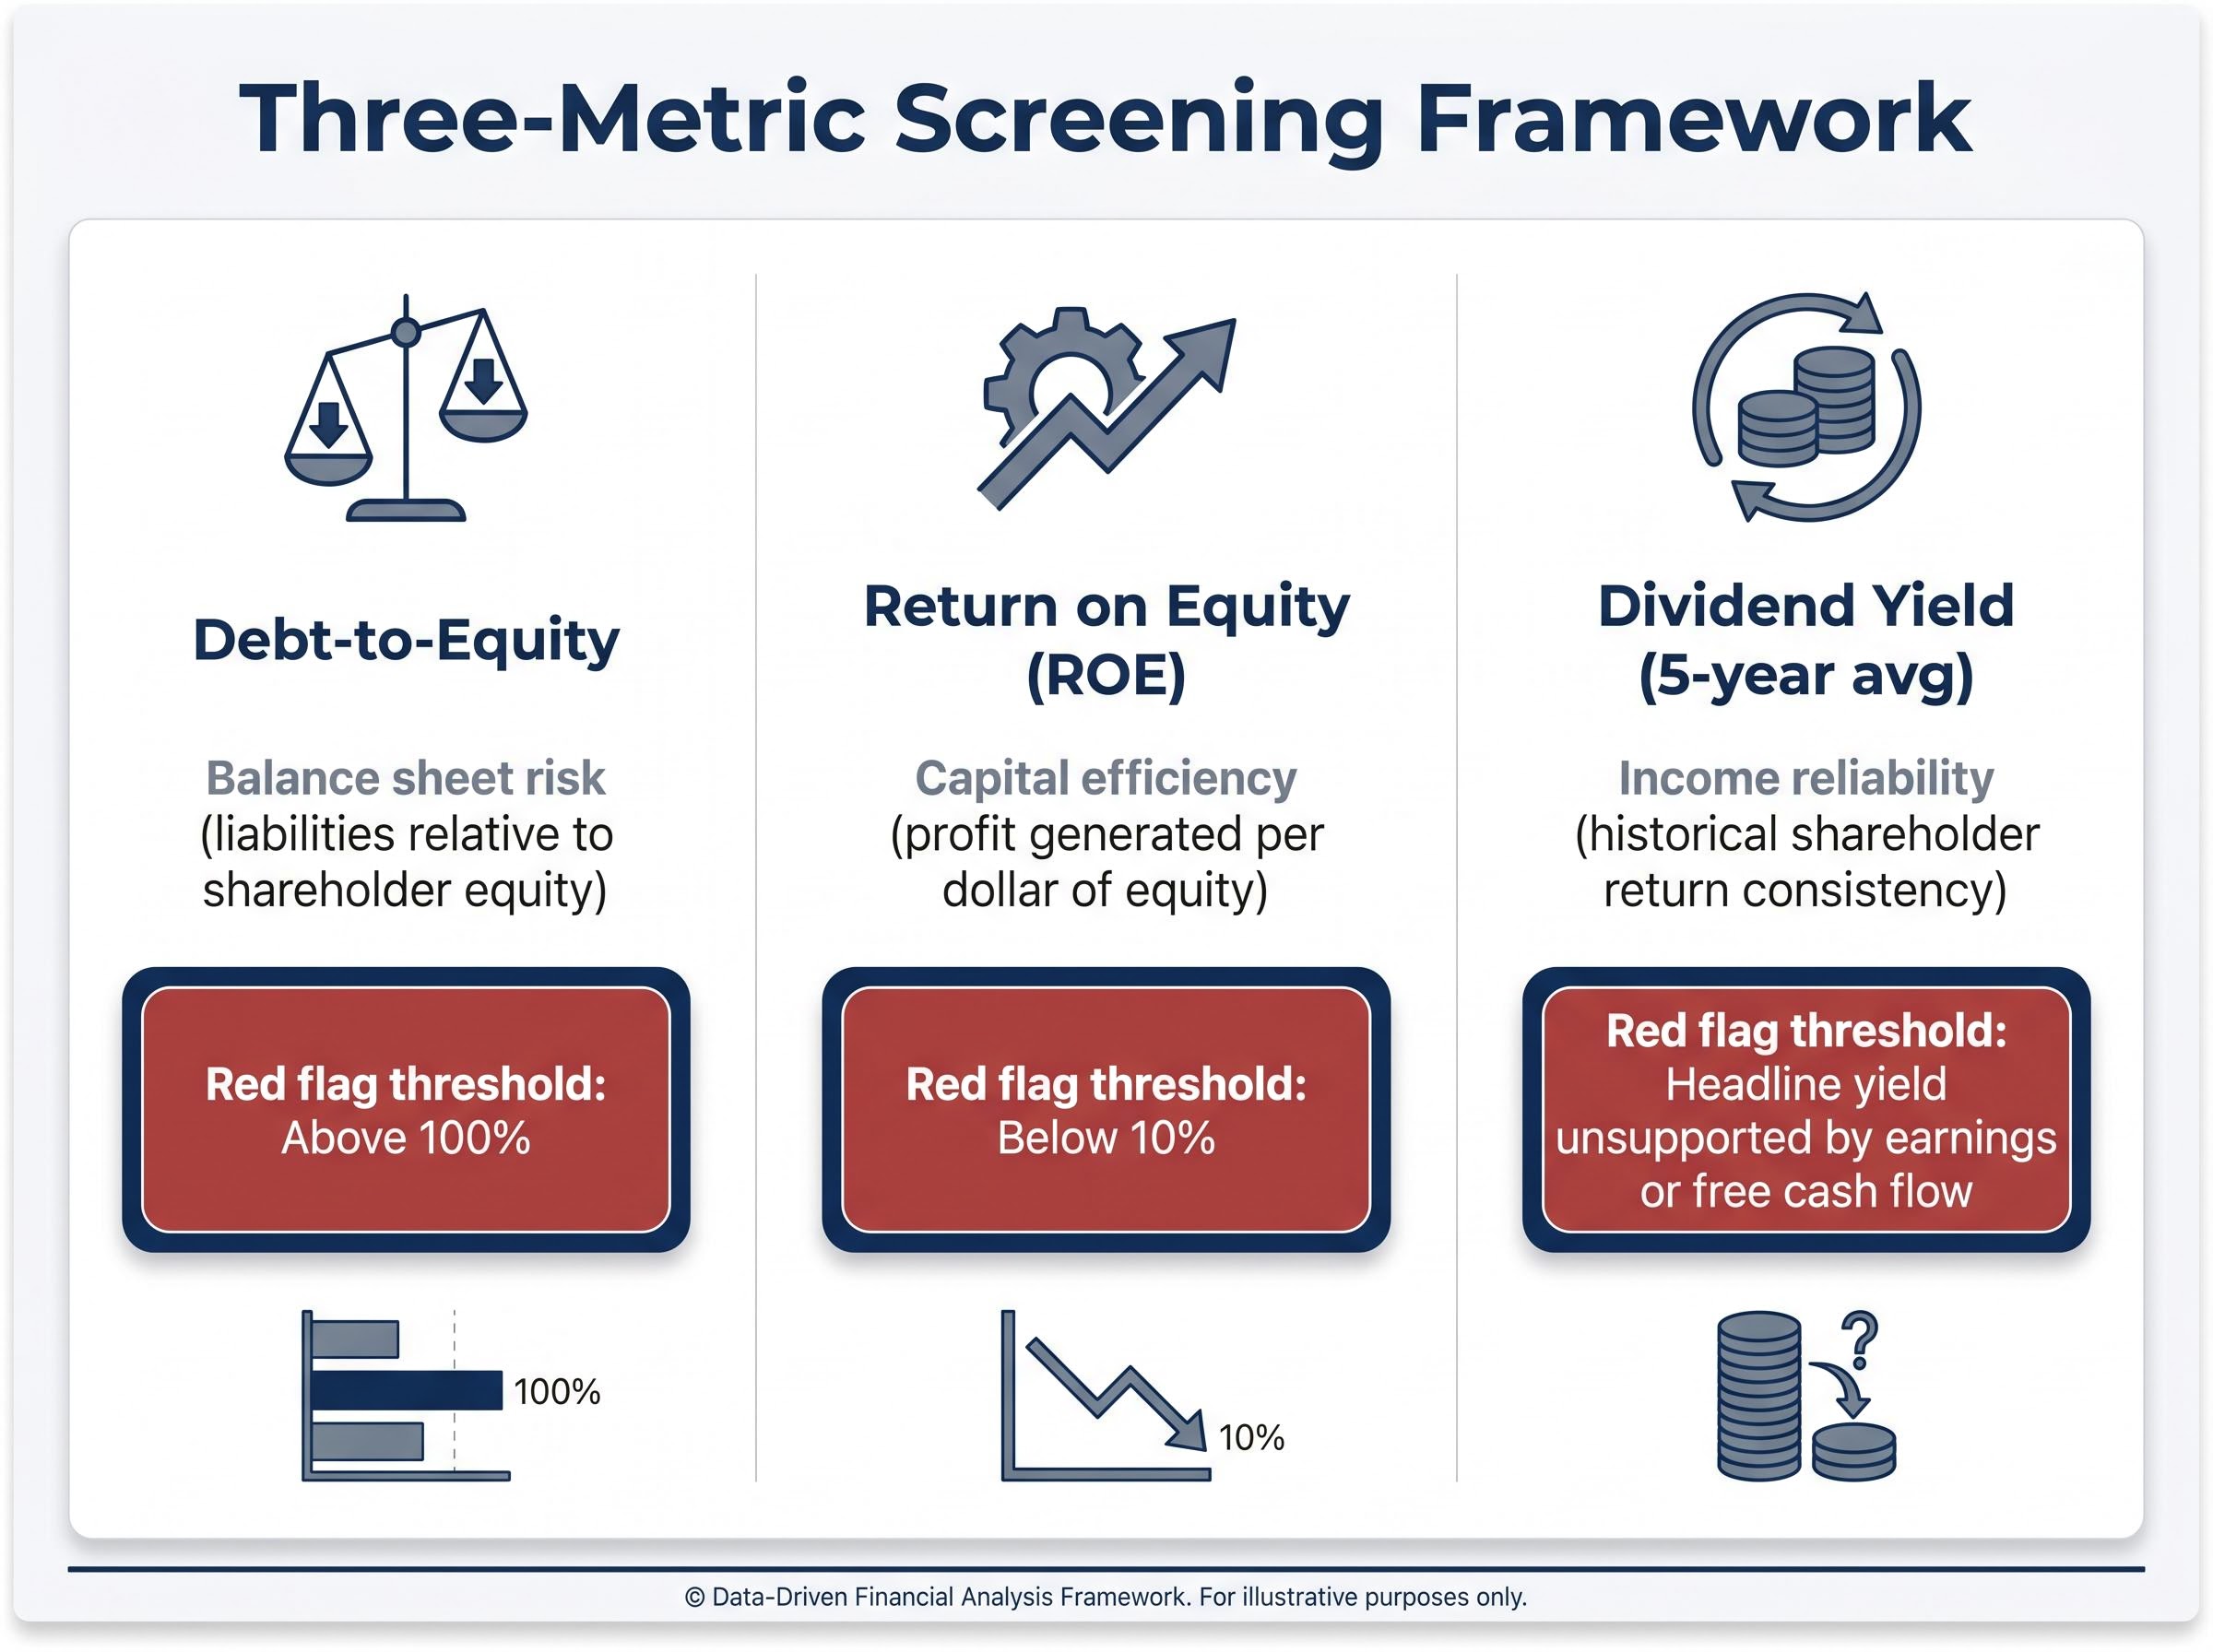
- Debt-to-equity ratio: Balance sheet risk. How much of the company’s funding comes from borrowing relative to shareholder equity, and what that implies for resilience under financial stress.
- Return on equity (ROE): Capital efficiency. How effectively management converts each dollar of shareholder equity into profit.
- Dividend yield (five-year average): Income reliability. What the company has historically returned to shareholders, smoothed over time to reduce the distortion of a single strong or weak year.
Reference threshold: An ROE of 10% or above is widely used as a quality benchmark for mature ASX companies, referenced across ASX investor education resources and analytical frameworks from sources including Intelligent Investor and InvestSMART.
Quality investing screens formalise the same intuition behind the ROE threshold in this framework: they filter for companies with high return on equity, stable earnings, and low financial leverage, and in late 2025 the valuation gap between quality-screened stocks and the broader ASX 200 narrowed toward its 10-year average, improving the entry-point case for investors already oriented toward balance-sheet-conscious selection.
The three metrics work as a first filter, not a final verdict. A stock that passes all three is not automatically a buy; one that fails is not automatically a sell. More importantly, the same metric can mean very different things in different sectors. A debt-to-equity ratio of 200% at a technology company signals something fundamentally different from the same ratio at a regulated toll-road operator. That distinction will matter when the framework meets Transurban.
When big ASX news breaks, our subscribers know first
The framework explained: debt, returns, and income as a system
These three metrics are most useful when read as a system rather than three isolated numbers. Each qualifies the interpretation of the others.
Debt-to-equity measures total liabilities against total shareholder equity. A ratio above 100% means a company carries more debt than equity on its balance sheet, a conventional flag for elevated financial risk that warrants deeper investigation. Higher leverage amplifies both upside and downside; it also increases sensitivity to interest-rate movements and refinancing conditions.
ASX balance sheet analysis adds a further layer to debt-to-equity screening because the ratio responds to how liabilities are classified: under AASB 16, lease obligations now appear on the balance sheet for infrastructure and retail companies, meaning investors who rely only on the headline debt figure can materially understate true leverage without examining the underlying asset and liability categories.
| Metric | What it measures | Red flag threshold |
|---|---|---|
| Debt-to-Equity | Balance sheet risk: liabilities relative to shareholder equity | Above 100% |
| Return on Equity (ROE) | Capital efficiency: profit generated per dollar of equity | Below 10% |
| Dividend Yield (5-year avg) | Income reliability: historical shareholder return consistency | Headline yield unsupported by earnings or free cash flow |
When high leverage is structural, not a warning sign
Not all debt carries the same risk. Regulated infrastructure operators typically employ project-finance structures where borrowing is non-recourse, asset-backed, and tied to long-dated concessions. This is fundamentally different from corporate-level debt at a cyclical business. Staggered maturities and interest-rate hedging reduce near-term solvency risk even when headline gearing ratios look alarming. The distinction matters for Transurban’s numbers.
Productivity Commission infrastructure financing research confirms that high and stable asset returns allow regulated infrastructure operators to carry significantly more debt relative to equity than cyclical businesses, a structural feature that lowers the overall cost of capital rather than signalling financial distress.
ROE measures how effectively management converts shareholder equity into profit. Asset-heavy businesses, those holding large physical infrastructure on their balance sheets, naturally produce lower accounting ROE because the denominator (equity tied up in long-life assets and associated depreciation) is structurally large. A low ROE in an infrastructure company may reflect accounting mechanics rather than poor management.
Dividend yield, meanwhile, is a starting point rather than a conclusion. The yield-trap risk emerges when headline yield looks attractive but is not supported by earnings or free cash flow. Checking payout ratio and cash-flow coverage is what separates sustainable income from a payout that may be cut.
A company with strong ROE, manageable debt, and a well-covered yield is a meaningfully different proposition from one with a high headline yield, low ROE, and elevated gearing. The system matters.
Telstra by the numbers: a quality telco that earns its blue-chip label
Telstra broadly passes the three-metric framework on its FY24 results, with one metric sitting right on the threshold line.
| Metric | FY24 | FY25 / Latest | Framework threshold |
|---|---|---|---|
| Debt-to-Equity | 99.4% | 119.14% | Below 100% |
| ROE | 10.7% | 14.75% (TTM) | Above 10% |
| 5-Year Avg Dividend Yield | ~3.72-3.77% (fully franked) | Covered by earnings and cash flow | |
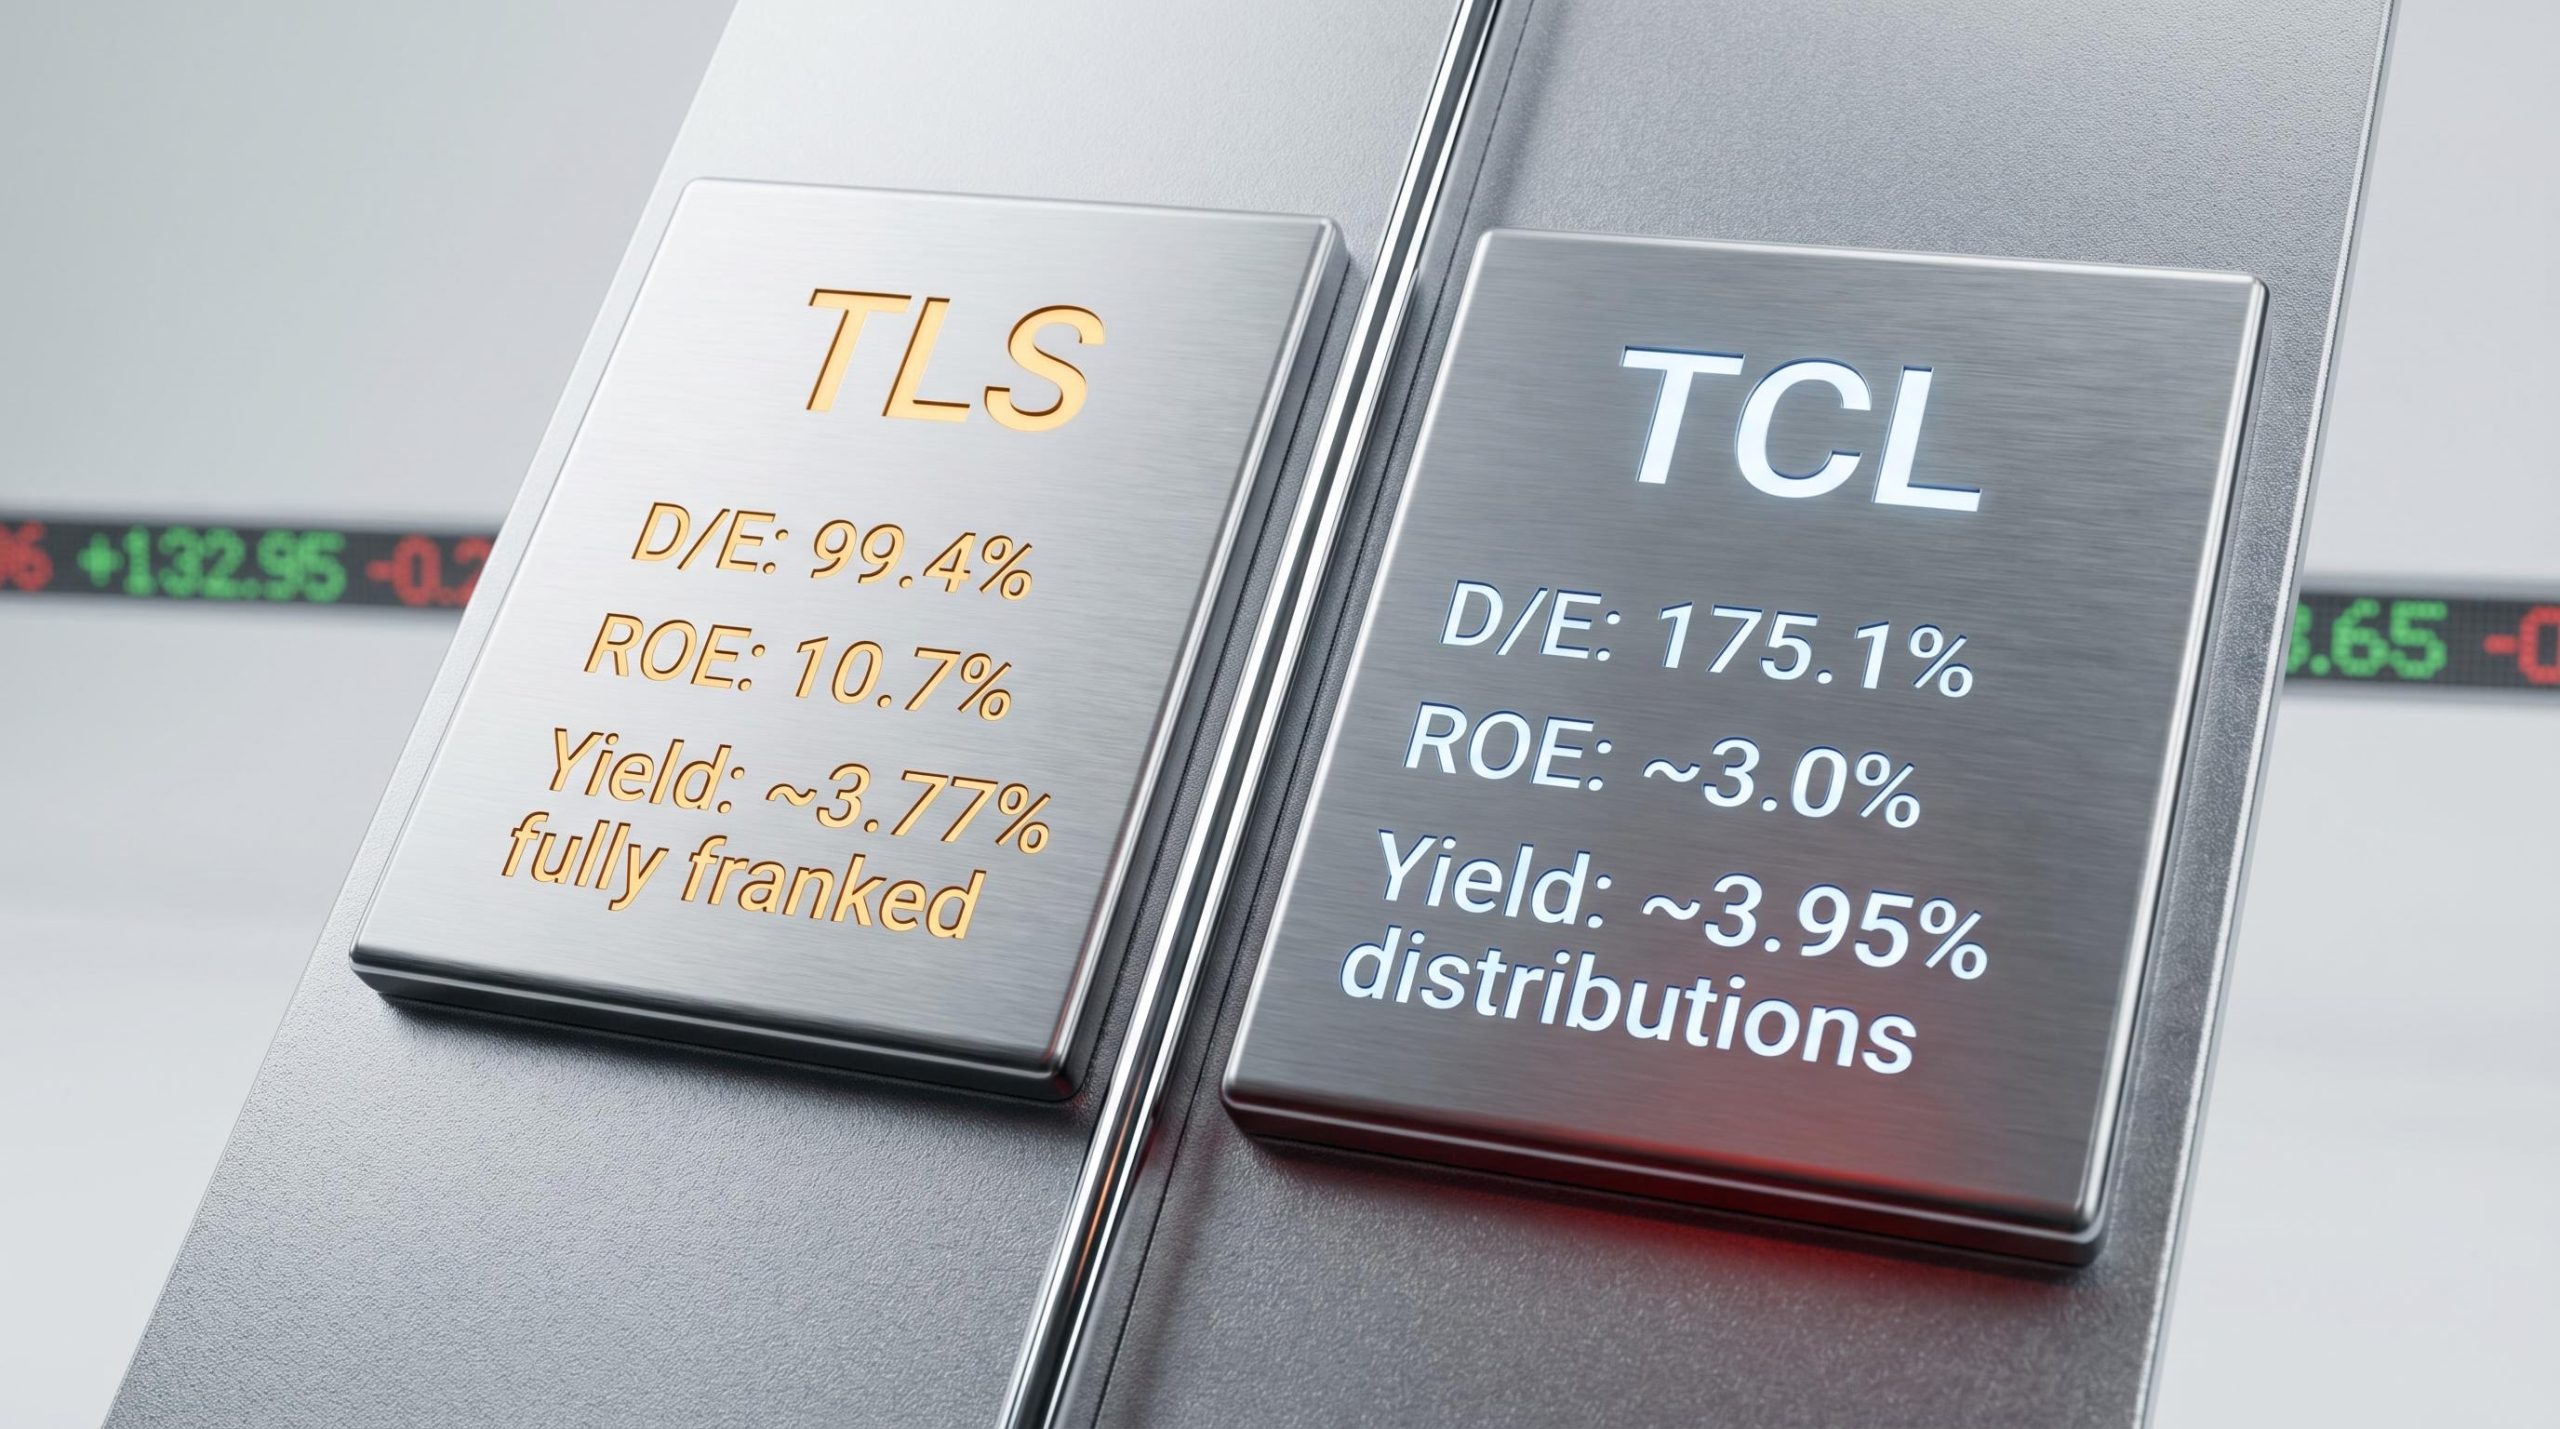
In FY24, Telstra’s debt-to-equity came in at 99.4%, just below the 100% threshold. ROE registered 10.7%, meeting the quality benchmark. The five-year average yield of approximately 3.72-3.77%, fully franked, sits comfortably in competitive territory for a mature income stock.
The FY25 trailing twelve-month figures complicate the picture in an instructive way. ROE improved to 14.75%, a meaningful step above subdued prior expectations. Debt-to-equity, however, has risen to 119.14%, crossing the 100% line.
Notable: Telstra’s TTM ROE of 14.75% represents a material improvement relative to the FY24 result of 10.7%, and sits well above the consensus trajectory heading into FY25.
Does that threshold breach warrant concern? Context helps. Telstra’s business model generates recurring subscription revenue across 22.5 million retail mobile accounts. Network coverage reaches 99.6% of Australia’s population, with 5G availability exceeding 85% (based on 2023 data). Mobile price discipline and cost-control programmes provide cash flow stability that supports the dividend. The share price was trading within 1.5% of its 52-week high at the time of source publication in May 2026.
A metric crossing a threshold mid-period, as debt-to-equity has here, should prompt monitoring rather than alarm when underlying cash flows remain stable. That is the kind of nuance a structured screening process makes visible.
Transurban by the numbers: where the framework hits its limits
Now for the company that makes the framework earn its keep. Transurban’s raw metrics, taken at face value, look bad.
| Metric | FY24 | Latest (Dec 2025) | Framework threshold |
|---|---|---|---|
| Debt-to-Equity | 175.1% | ~228.43% | Below 100% |
| ROE | ~3.0% | Low (not specified) | Above 10% |
| 5-Year Avg Distribution Yield | ~3.95% (distributions, not franked) | Covered by earnings and cash flow | |
Debt-to-equity at 175.1% in FY24, rising to approximately 228.43% as of December 2025. ROE at roughly 3.0%, well below the 10% benchmark. On a standard screen, Transurban fails two of three metrics.
The distribution yield of approximately 3.95% is competitive, but the company pays distributions via a trust structure rather than fully franked dividends, a distinction that matters for after-tax income comparison with Telstra.
Three structural factors explain why accounting ROE is depressed for a toll-road operator like Transurban:
- Large asset base: The company holds 22 urban motorway assets across Australia, Canada, and the United States, creating a massive equity denominator.
- Depreciation-heavy accounting: Long-dated concessions generate high annual depreciation charges that compress reported net profit.
- Sustained capital expenditure: Ongoing concession development requires continuous reinvestment, keeping assets (and the equity base) elevated.
Inflation-linked toll escalations provide a meaningful offset to the high leverage, delivering revenue visibility that a standard debt-to-equity reading cannot capture. The share price rose approximately 3.0% from the start of 2025 to May 2026, reflecting steady rather than distressed market pricing.
The real risk Transurban’s leverage number is flagging
The standard ROE screen is not wrong to flag Transurban. It is identifying a genuine risk, just not the one most investors assume.
Infrastructure-style gearing, the combination of non-recourse project debt, government-backed concessions, and CPI-indexed pricing, is precisely the structural feature that allows Transurban and similar operators to sustain leverage ratios that would represent a serious warning flag in a cyclical industrial or consumer business.
Higher-for-longer interest rates create valuation compression for long-duration infrastructure equity. Even when distributions remain steady and traffic volumes hold, rising bond yields increase the discount rate applied to future cash flows. That compresses equity multiples regardless of operating performance.
Transurban’s staggered debt maturities and interest-rate hedging manage near-term refinancing risk. They do not eliminate long-term exposure to a sustained shift in the rate environment. This is the risk the leverage number is pointing toward: not imminent solvency concern, but sensitivity to how long elevated rates persist.
TLS vs TCL side by side: applying the framework to make a decision
Placing the two companies in direct comparison sharpens the framework’s output.
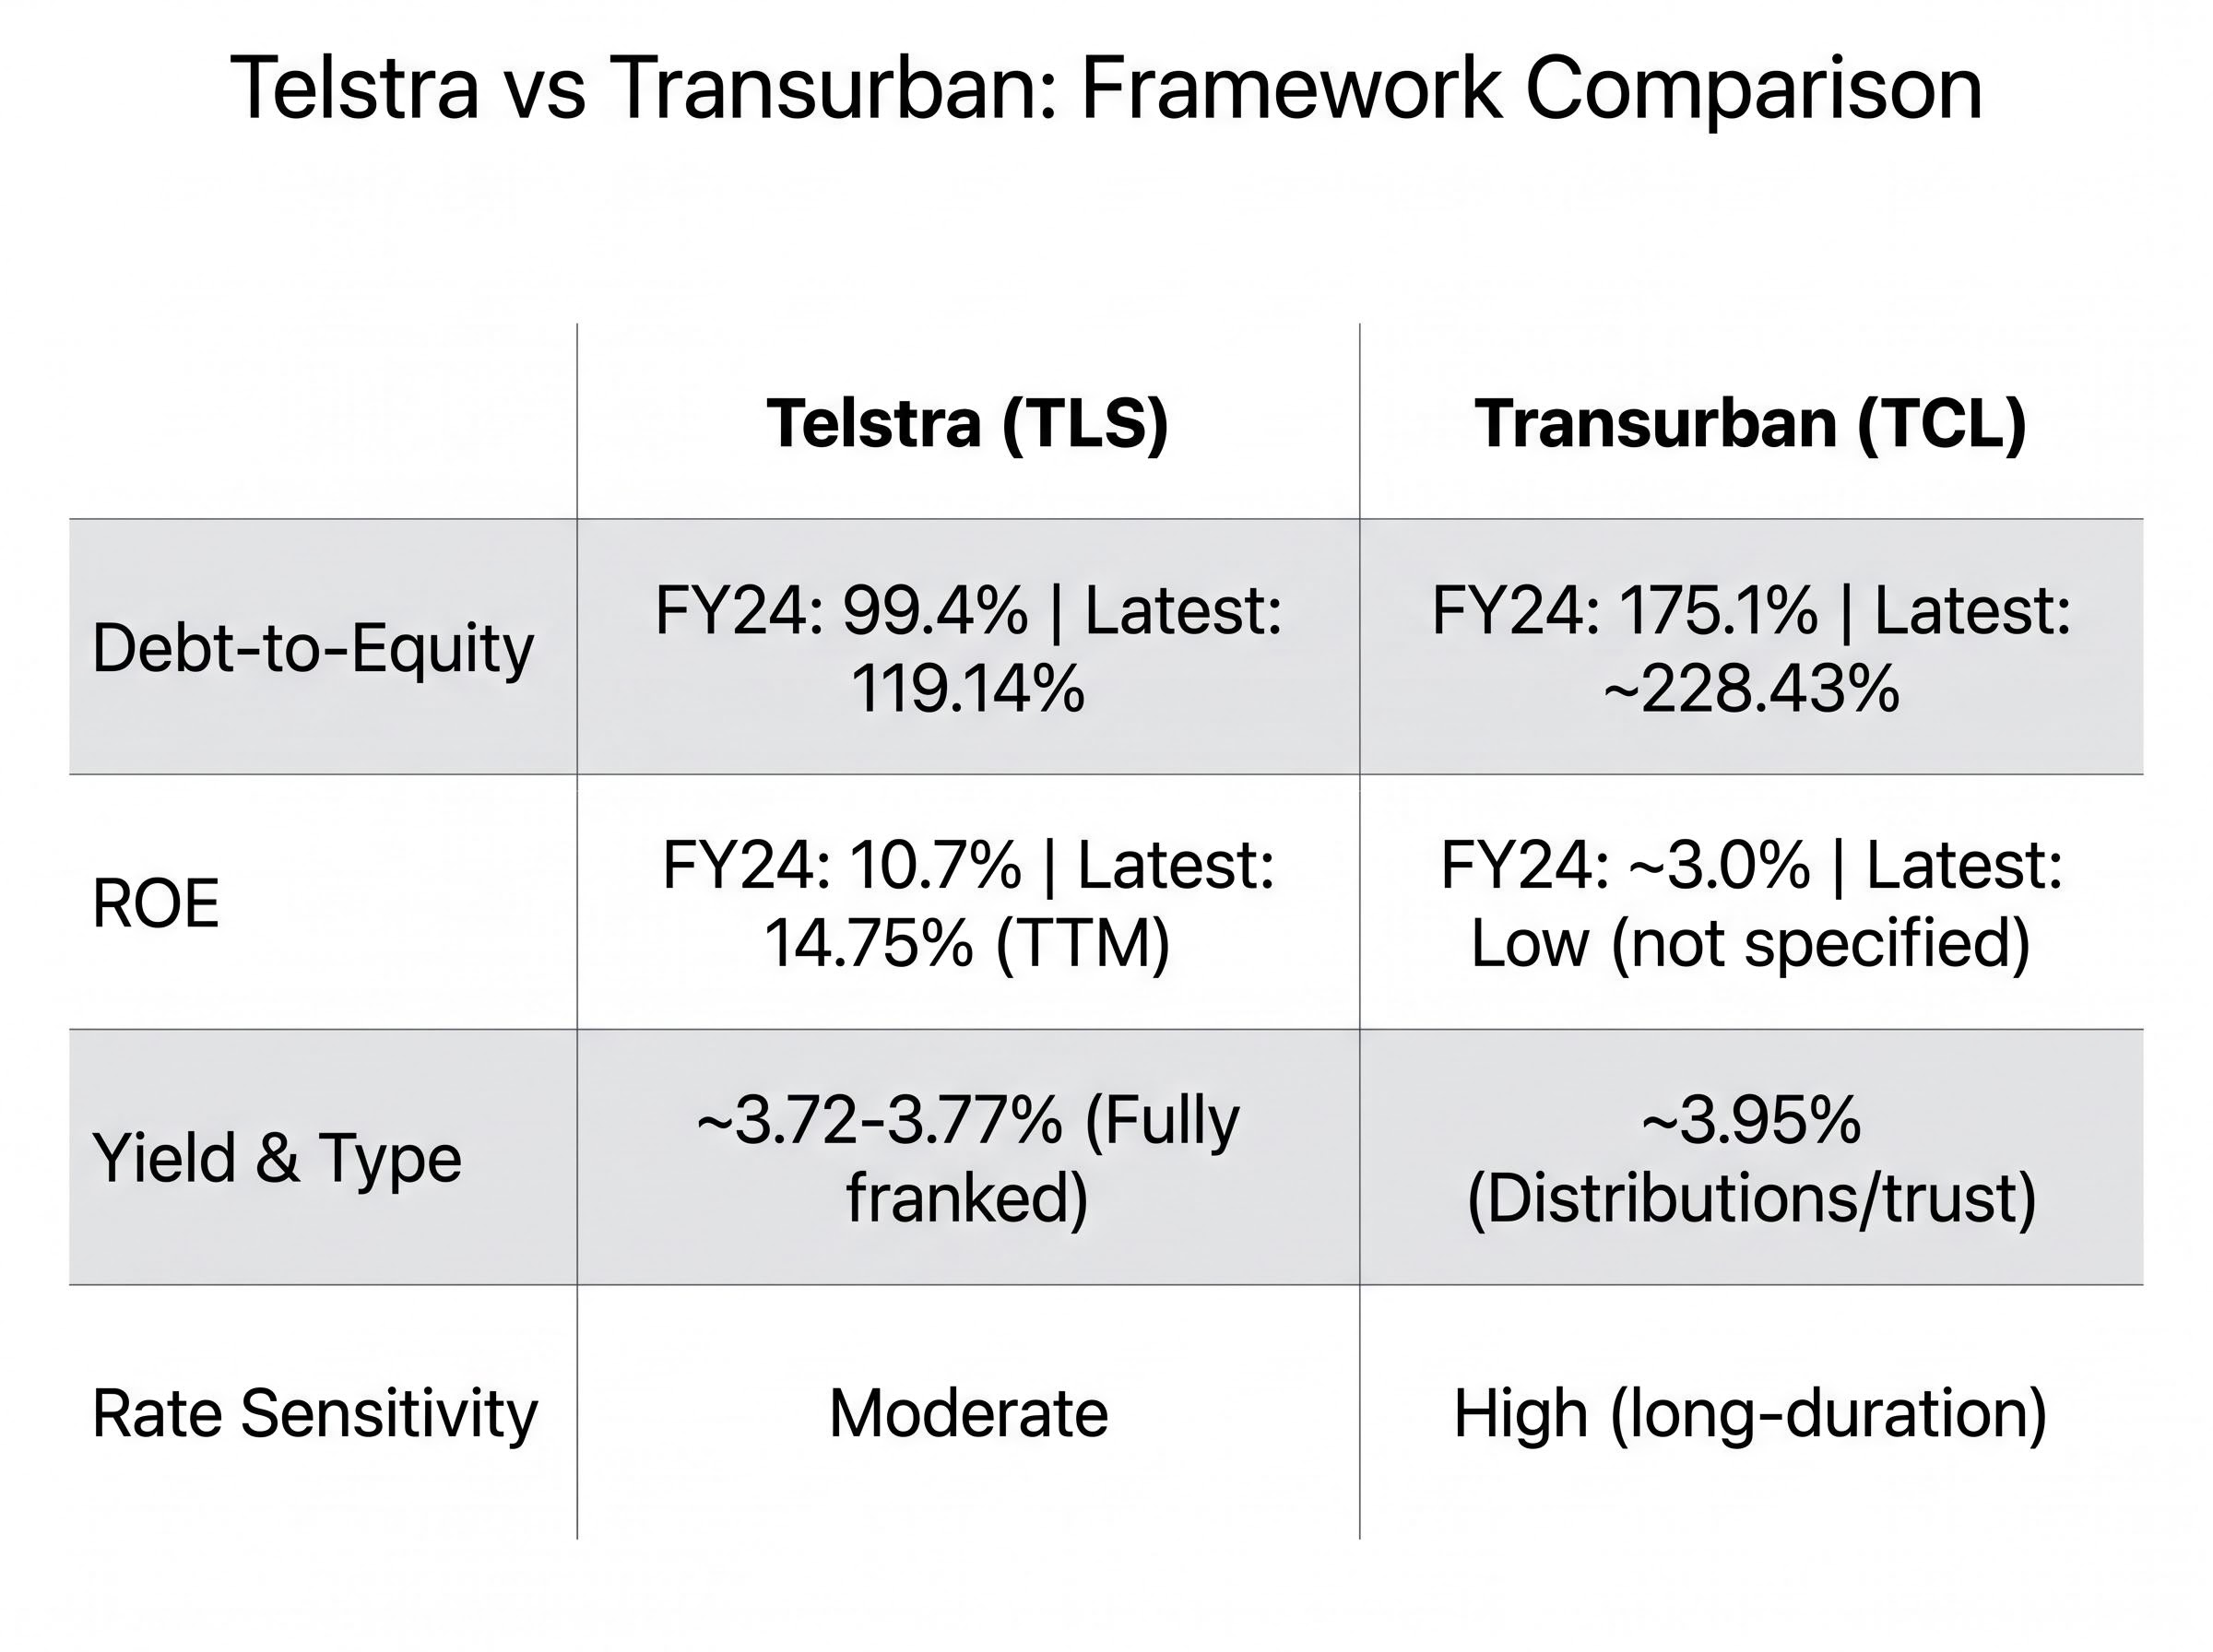
| Metric | Telstra (TLS) | Transurban (TCL) |
|---|---|---|
| Debt-to-Equity (FY24) | 99.4% | 175.1% |
| Debt-to-Equity (Latest) | 119.14% | ~228.43% |
| ROE (FY24) | 10.7% | ~3.0% |
| ROE (Latest) | 14.75% (TTM) | Low (not specified) |
| 5-Year Avg Yield | ~3.72-3.77% | ~3.95% |
| Dividend Type | Fully franked | Distributions (trust) |
| Rate Sensitivity | Moderate | High (long-duration) |
| ROE vs 10% Threshold | Passes | Fails |
Both companies appear regularly in “defensive income” and “top ASX dividend” coverage. The framework reveals they carry meaningfully different risk profiles beneath that shared label.
Telstra broadly passes a generic quality-plus-income screen. ROE is above the benchmark and improving. Leverage has crossed the 100% line but remains moderate for a stable telco with recurring subscription revenue. Fully franked dividends deliver a material after-tax advantage for Australian investors in higher tax brackets.
The ATO franking credit rules establish the gross-up and credit approach that applies when Australian investors receive fully franked dividends, a mechanism that delivers a material after-tax advantage relative to trust distributions, which carry no franking credits regardless of the underlying cash yield.
Transurban fails on two of three standard metrics but passes a sector-adjusted income screen, provided the investor explicitly accepts infrastructure-style gearing and the interest-rate sensitivity that accompanies it. The distribution yield is slightly higher, but the trust structure means no franking credits.
Investor suitability distinction: Telstra suits a quality-plus-income preference where the investor prioritises balance sheet comfort and franking credits. Transurban suits a long-duration income preference where the investor accepts infrastructure gearing and higher rate sensitivity in exchange for inflation-linked revenue visibility.
Neither conclusion is a buy or sell recommendation. The framework’s value lies in surfacing the right questions, not producing automatic verdicts.
A replicable process: how to run this screen on any ASX blue-chip
The Telstra and Transurban examples demonstrate the framework in action. Here is the process distilled into steps that apply to any mature ASX stock.
- Retrieve the three metrics from a freely accessible source: debt-to-equity ratio, return on equity, and five-year average dividend yield.
- Check each against its threshold: debt-to-equity below 100%, ROE above 10%, and yield supported by earnings and free cash flow.
- Identify which failures warrant sector-context investigation rather than automatic exclusion. Infrastructure, property trusts, and other asset-heavy sectors may carry structurally high gearing or low accounting ROE that reflects business model mechanics rather than financial weakness.
- Assess yield sustainability via payout ratio and cash-flow coverage rather than headline yield alone.
- Consider franking or distribution structure for the Australian after-tax income comparison. Fully franked dividends and trust distributions deliver different outcomes depending on marginal tax rate.
Freely accessible data sources for Australian investors include:
- ASX company announcements and annual reports
- Yahoo Finance and CommSec for key financial statistics
- Rask Media for metric summaries and screening tools
The FY24 figures used in this guide were sourced from company results; more recent trailing figures are available through these platforms.
What this framework cannot replace
- Backward-looking metrics: ROE and debt-to-equity reflect what has already happened, not what management is planning or the competitive environment is demanding.
- Sector exceptions: Infrastructure, property trusts, and other capital-intensive sectors require additional context that default thresholds do not capture.
- Qualitative assessment: Management quality, competitive positioning, and macroeconomic conditions sit outside the scope of three financial ratios and require separate analysis before any investment decision.
This framework is one component of analysis, not a complete valuation.
Numbers first, context always: the investor’s starting point, not the finish line
Two companies that look similar on headline yield and defensive-sector labelling can carry meaningfully different risk profiles. The three-metric framework is the mechanism for surfacing that difference.
Telstra broadly passes a standard screen, with improving ROE and moderate leverage supported by recurring cash flows. Transurban requires sector-adjusted interpretation but reveals a specific and identifiable interest-rate risk rather than a financial quality failure. Both are legitimate income holdings; they suit different investors with different risk tolerances.
The five-step process outlined above works on any mature ASX blue-chip. The next stock on a watchlist is a good place to start.
ASX dividend ETFs offer an alternative pathway for income investors who find the stock-level screening process time-intensive: VHY, for example, applies its own yield and liquidity filters across the ASX and carried 88.60% franking on its most recent distribution, delivering a grossed-up effective yield of approximately 6.87% for eligible investors without the need for individual company analysis.
This article is for informational purposes only and should not be considered financial advice. Investors should conduct their own research and consult with financial professionals before making investment decisions.