
ResMed Share Price at 52% Discount: Opportunity or Value Trap?
1 hr ago

Bank of Queensland shares were trading at $6.21 in May 2026, and two standard valuation models both suggested the stock was cheap. A price-to-earnings approach implied fair value of $7.29. A dividend discount model produced a blended estimate of approximately $7.19. Yet a majority of covering brokers rated BOQ a Hold. That gap, between “cheap on the model” and “proceed with caution,” is the tension worth resolving.
ASX bank stocks collectively represent roughly 30% of the market by capitalisation. They attract investors who know how to read a PE ratio but may not know what questions to ask once the headline number looks appealing. BOQ is a concentrated case study in why valuation alone is insufficient for banking stocks.
What follows is a structured, evidence-based analysis of the qualitative and operational factors sitting beneath BOQ’s price tag, grounded in the bank’s actual recent data. This is not a buy or sell recommendation. It is a due diligence framework applied to a live example, built to be reused the next time a regional bank looks cheap on a spreadsheet.
Two conventional valuation approaches point in the same direction. Both suggest BOQ is undervalued relative to its current share price of $6.21.
The dividend discount model mechanics that produce BOQ’s blended estimate of approximately $7.19 are highly sensitive to two inputs: the assumed dividend growth rate and the required return applied to a bank mid-transformation, and small shifts in either assumption can move the output by several dollars per share.
The models agree. The professionals do not.
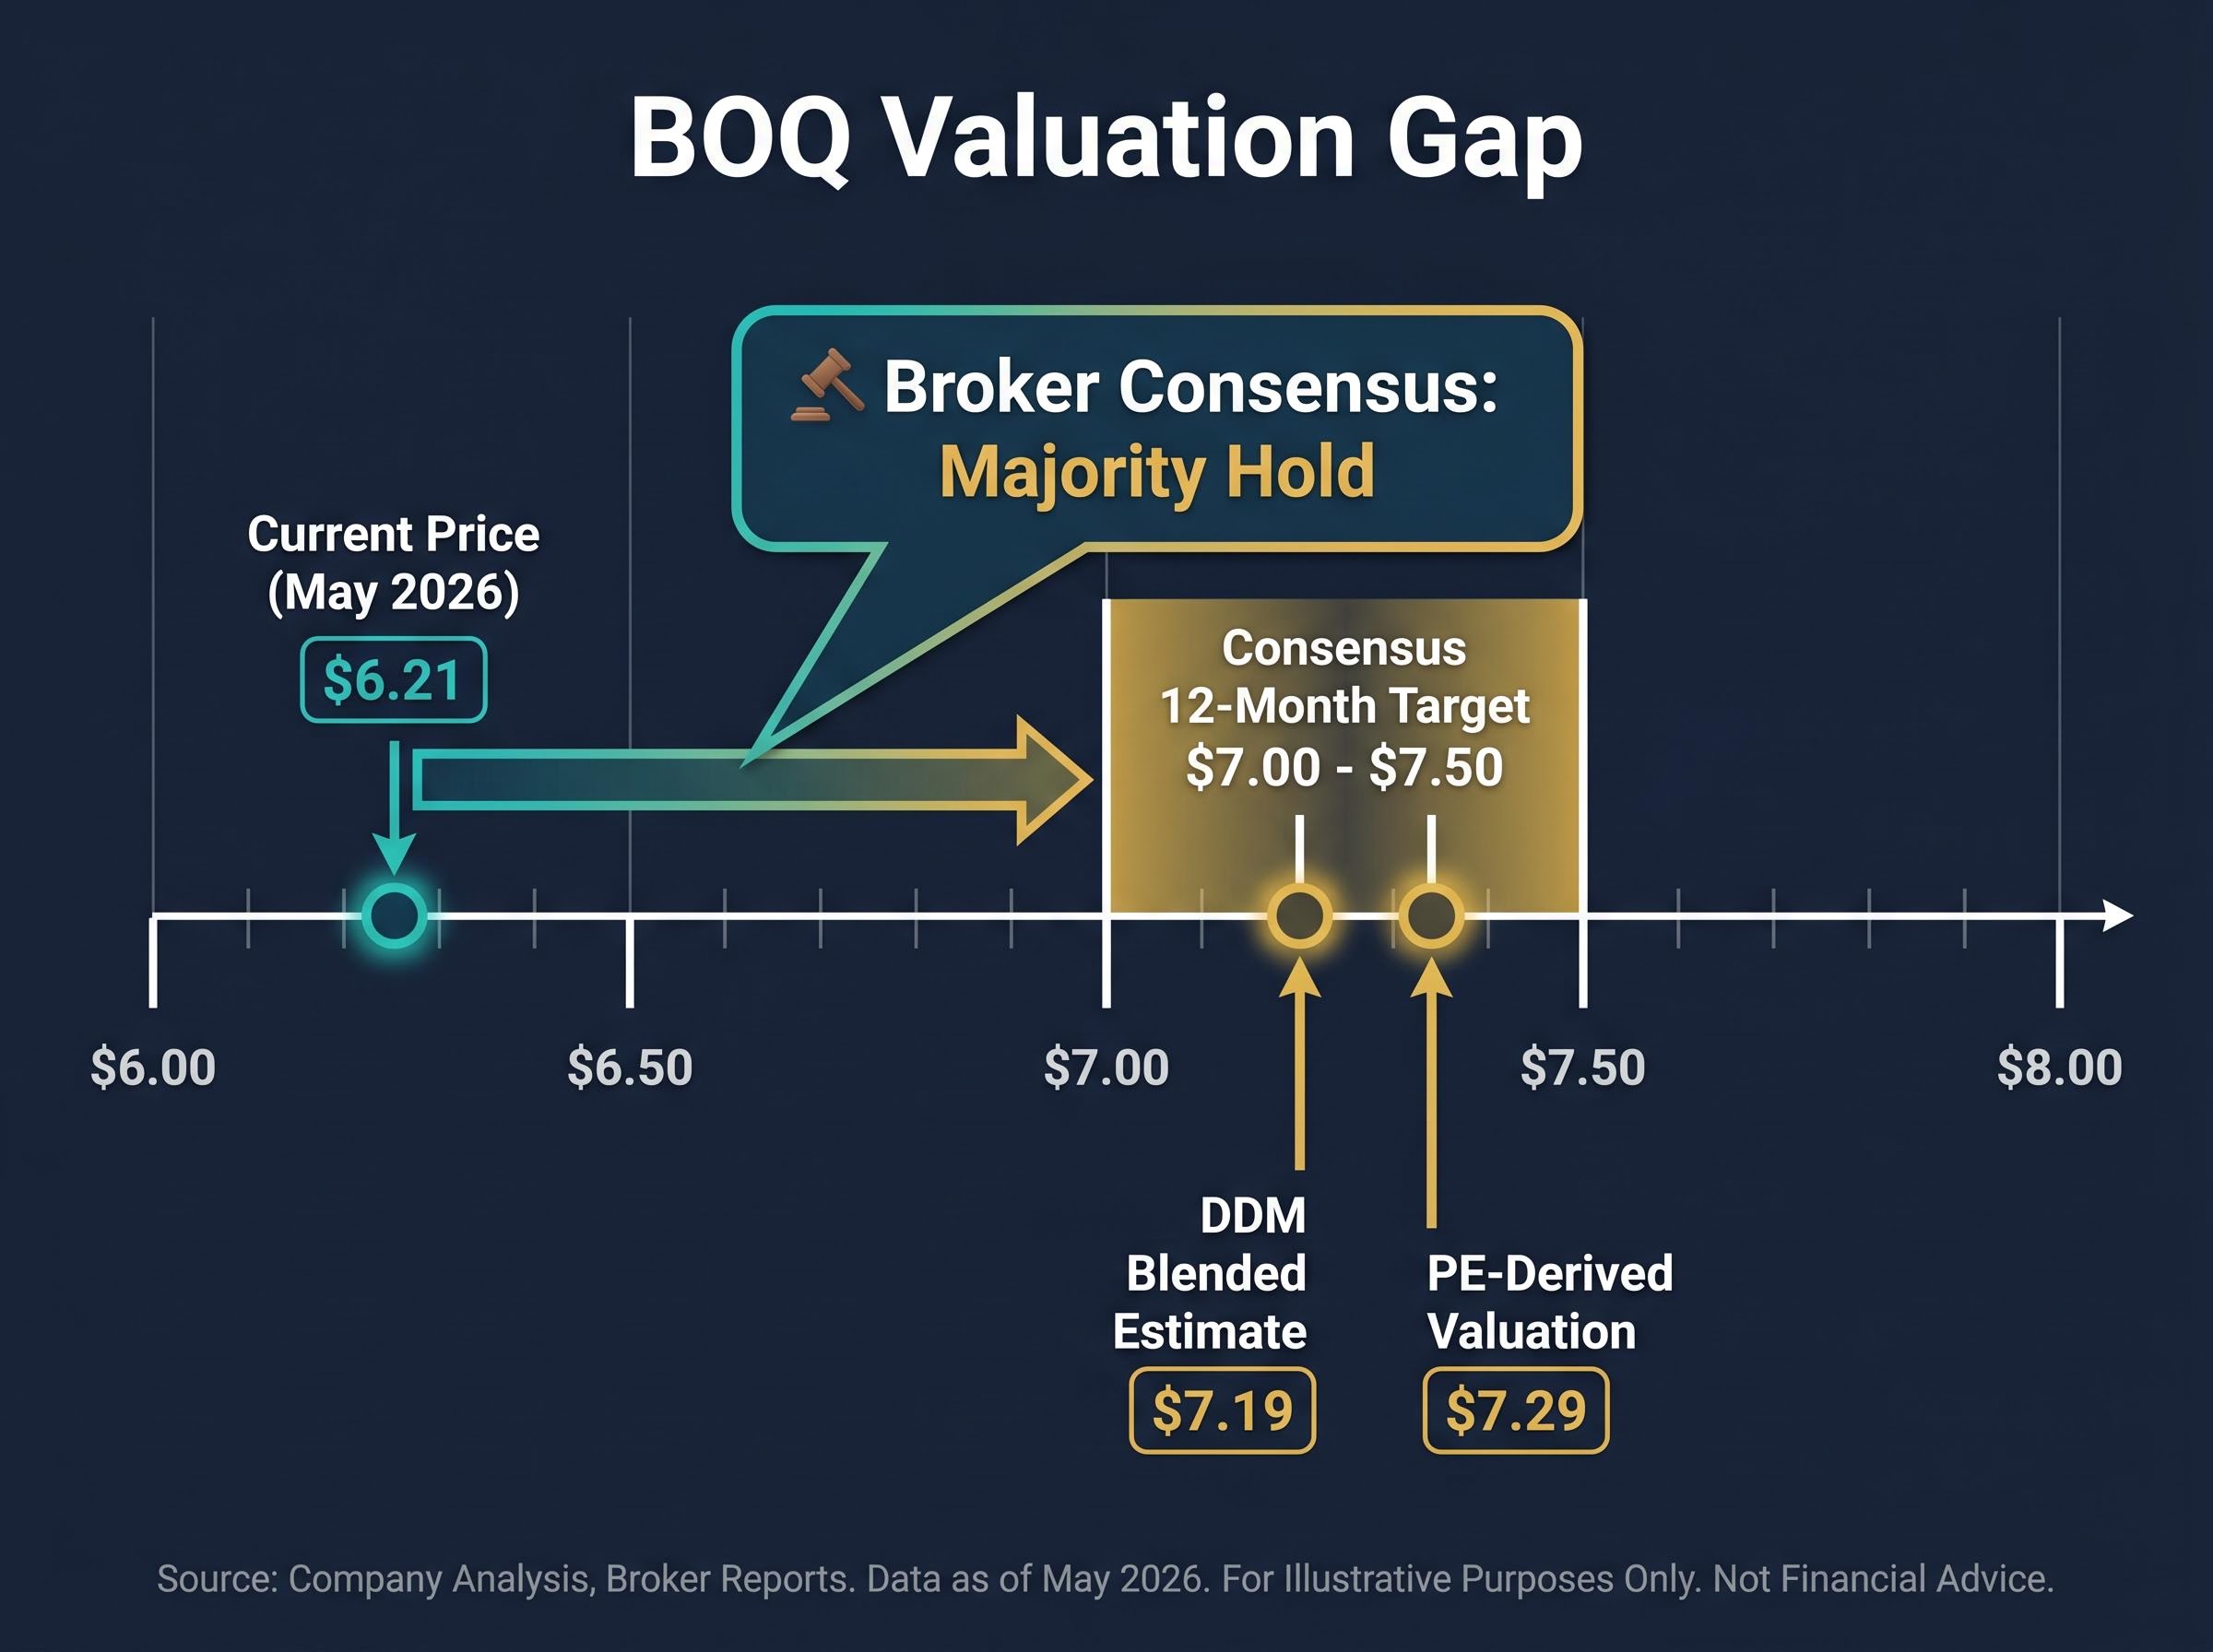
Broker consensus as of early 2026 places the majority of covering analysts at Hold, a minority at Buy, and a small minority at Sell. The consensus 12-month price target sits at approximately $7.00-$7.50, implying mid-teens percentage upside from current levels, yet the modal recommendation remains restraint rather than conviction.
For banking stocks specifically, the quality of the number matters as much as the number itself. A cheap PE is only meaningful if the earnings that produce it are durable, and durability at a regional bank depends on margin resilience, regulatory standing, and management execution. The sections that follow examine each.
The PE ratio limitations for bank stocks are most acute when earnings quality is in question: a reported EPS figure that includes favourable provisioning releases, one-off gains, or suppressed credit losses can produce a multiple that looks cheap against sector history while understating the true risk embedded in the loan book.
Before buying any individual stock, an investor needs a credible thesis for why it will outperform the simplest available alternative. For Australian equity investors, that alternative is often the Vanguard Australian Shares Index ETF (VAS), a diversified, low-cost product with a management expense ratio of just 0.07%.
The comparison over multiple horizons is unflattering for BOQ.
| Metric | BOQ | VAS | Notes |
|---|---|---|---|
| 1-year total return | Modest positive, roughly tracking index | Approximately 10-15% positive | BOQ delivered comparable or slightly inferior returns with materially higher volatility |
| 3-year annualised total return | Materially below ASX 200 | Mid-single-digit positive | BOQ shareholders would have been better off in a low-cost index ETF |
| 5-year annualised total return | Well below ASX 200 and major-bank peers | Mid-single-digit positive | Dividend cuts in earlier years compounded BOQ’s underperformance |
| Dividend reliability | Variable; prior cuts | Consistent quarterly distributions | VAS reflects aggregate market dividend stream |
| Volatility | Materially higher | Broad market average | Single-stock concentration amplifies drawdown risk |
VAS has clearly outperformed BOQ over 3- and 5-year horizons. Over one year, the comparison is at best comparable, with BOQ delivering that return at significantly higher risk.
Before buying BOQ, define the outperformance thesis. What is the specific, evidence-based reason this stock will beat a 0.07% MER index ETF from this starting point? If the answer is not clear, the historically stronger choice has been the ETF.
The point is not that VAS is always the right answer. It is that VAS is the hurdle rate. A regional bank stock needs to clear it.
Net interest margin, or NIM, is the spread between what a bank earns on its loans and what it pays on its deposits, expressed as a percentage of its earning assets. It is the single most important operating metric for a retail bank because it captures the profitability of the bank’s core activity: lending money at a higher rate than the cost of funding it.
Regional banks like BOQ are structurally more NIM-sensitive than the major banks. Their funding bases are less diversified, they rely more heavily on term deposits (which reprice faster in a competitive market), and they lack the scale advantages that help larger institutions absorb margin pressure. A 10 basis point move in NIM at BOQ has a proportionally larger earnings impact than it would at Commonwealth Bank or Westpac.
The trajectory tells an evolving story.
| Reporting Period | Statutory/Cash NIM | Change (bps) | Key Driver |
|---|---|---|---|
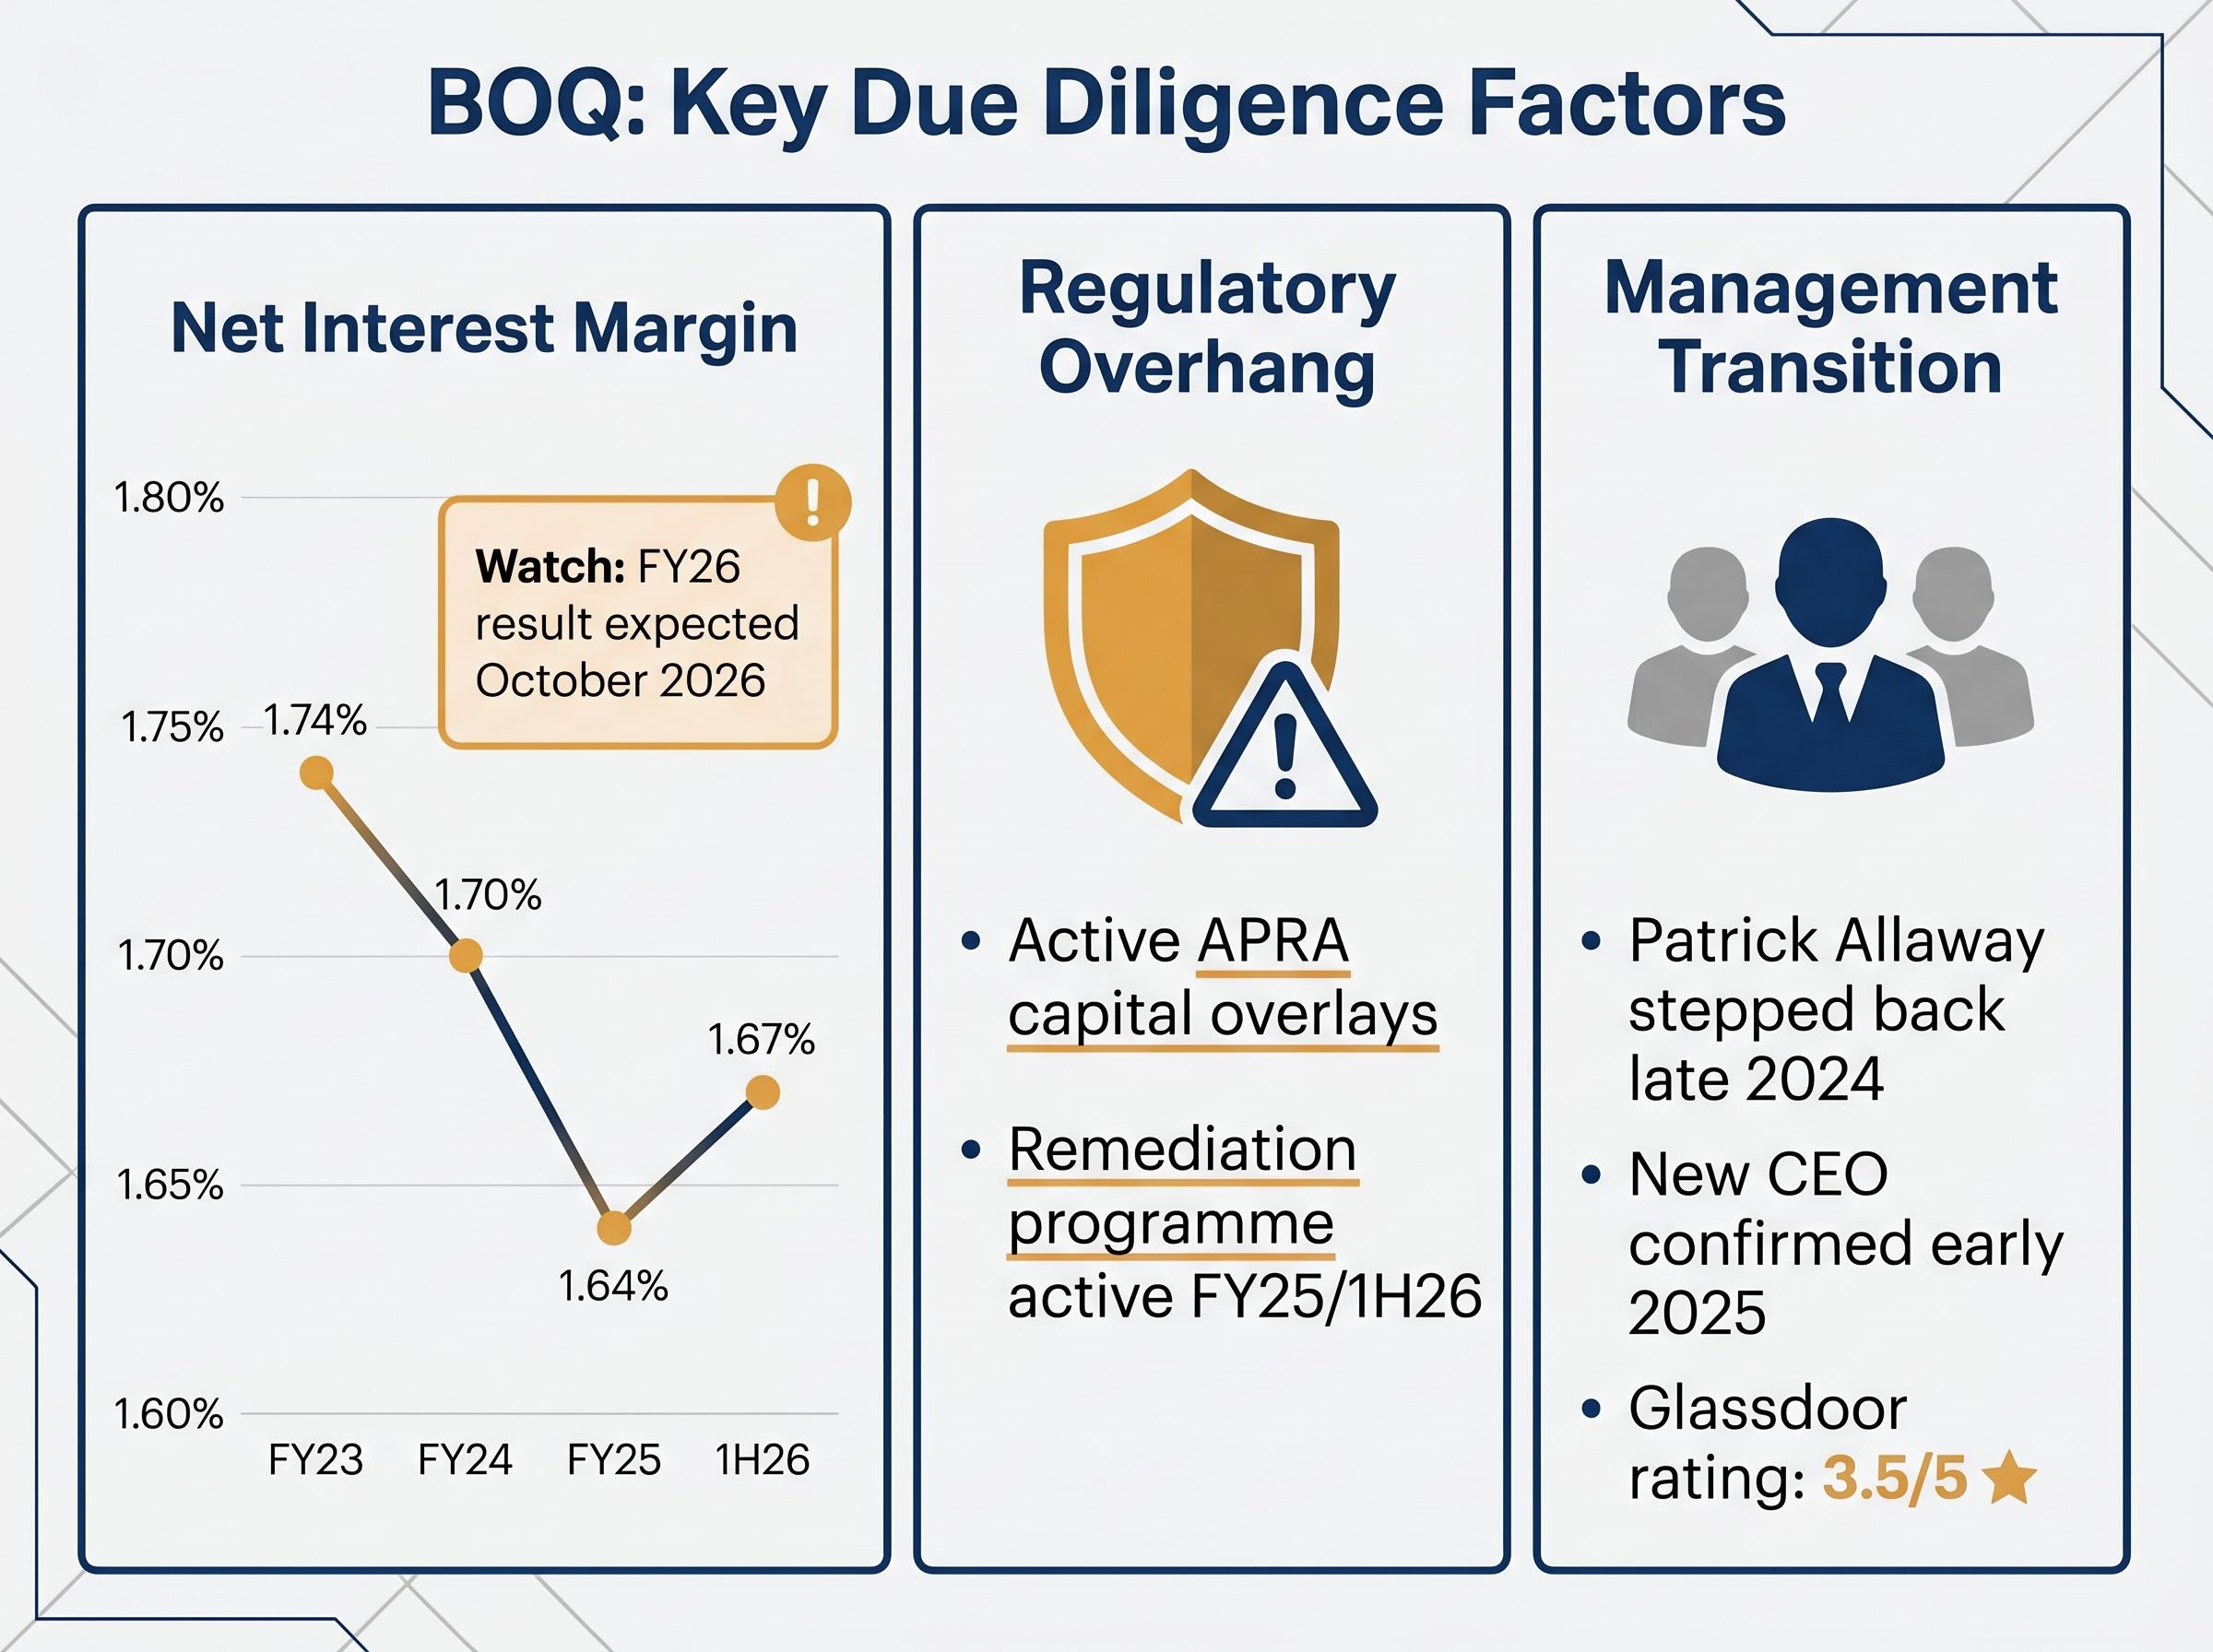
| FY23 | 1.74% | N/A | Baseline before competitive mortgage repricing accelerated |
| FY24 | 1.70% | -4 | Mortgage competition, deposit repricing, customer migration to higher-yielding products |
| FY25 | 1.64% | +8 on FY24 | Reversal of compression trend; stabilisation emerging |
| 1H26 (cash) | 1.67% | +10 on 1H25; -3 on 2H25 | Year-on-year improvement; half-on-half softening signals ongoing competitive pressure |
The improvement from FY24 through FY25 and into 1H26 is real. But it is modest. A NIM of 1.67% remains thin by historical standards, and the 3 basis point decline from 2H25 to 1H26 illustrates that the recovery is not entrenched.
A thin NIM means limited buffer against competitive pressure and deposit repricing. If mortgage discounting intensifies or deposit costs rise further, BOQ’s earnings can compress quickly. Full FY26 NIM guidance remains pending, expected with the full-year result in approximately October 2026. That disclosure will be the next meaningful data point for assessing whether BOQ’s margin trajectory is genuinely improving or merely stabilising at a structurally inferior level.
The gap between a bank’s headline profit and the metrics that drive its share price is a recurring feature of bank results reporting, illustrated most recently when NAB’s share price fell nearly 3% on a result that showed underlying profit growth of 6.4%, because analysts focused on ROE, NIM movement, and CET1 headroom rather than the top-line number.
The Australian Prudential Regulation Authority (APRA) has maintained BOQ under heightened supervision following findings of risk-management and operational-resilience weaknesses identified prior to 2024. APRA imposed additional operational risk capital overlays, effectively requiring BOQ to hold more capital than its peers as a buffer against non-financial risks, and mandated a formal remediation programme.
BOQ’s results documents confirm the bank is continuing to deliver on an APRA-approved remediation plan as of FY25 and 1H26. No new enforcement actions, such as fines or enforceable undertakings, have been publicly announced since 2024. APRA’s thematic publications on operational resilience continue to reference the need for smaller and regional banks to strengthen non-financial risk management.
APRA’s court enforceable undertaking with BOQ, agreed in May 2023, formalised the requirement for BOQ to hold a $50 million operational risk capital add-on and submit a remediation plan, establishing the regulatory baseline that continues to constrain the bank’s capital position and dividend capacity through 2026.
The regulatory situation imposes three distinct investor costs:
BOQ remains in remediation mode, with APRA capital overlays in place pending sustained improvement. The bank has not moved into financial advice or wealth management, which limits one specific regulatory risk vector, but the core remediation obligation remains a live drag on earnings quality and management focus.
No valuation model captures these dynamics with precision. They are qualitative drags that reduce the probability that model-derived fair values will be realised within the model’s assumed timeframe.
BOQ’s executive and board composition has changed substantially across 2023-2025. Patrick Allaway stepped back from the CEO role in late 2024, and a new chief executive was confirmed via ASX release in early 2025 as part of a governance reset aligned with the APRA remediation programme. The CFO role and senior risk and compliance leadership positions also turned over during this period.
Board renewal has been deliberate. New non-executive directors with risk, technology, and regulatory experience were appointed, and BOQ’s corporate governance statements frame the renewal as supporting transformation and risk-management uplift. The volume of change is intentional rather than chaotic. Yet multiple senior appointments in a short period create execution risk; institutional memory thins, and new leaders need time to build internal credibility.
Employee sentiment data offers a ground-level view of how the transformation is landing.
Glassdoor data shows BOQ rated at approximately 3.5 out of 5, with CEO approval in the mid-60s percent. SEEK and Indeed ratings sit in the mid-3s out of 5, consistent with Glassdoor. These platforms aggregate reviews across multiple years and are directional rather than precise.
The signal is this: sustained mid-3s ratings during a major transformation programme suggest execution risk is real. The workforce is not in crisis, but it is under strain. For positions held over a decade, the quality and stability of the executive team and the health of the operating culture matter more than any single year’s earnings. BOQ’s current data signals a bank mid-transition, not one that has landed on the other side.
The analytical threads above converge into five specific questions an investor should be able to answer before committing capital to BOQ, or any ASX-listed regional bank.
A satisfactory set of answers for BOQ today would need to address how margin recovery sustains against competitive headwinds, when APRA overlays lift, and whether the technology migration delivers cost savings on schedule. Investors who cannot form a view on all three may find that the Hold consensus reflects an honest reading of the risk.
For investors wanting a full-length worked example of how qualitative factors intersect with quantitative models across a Big Four bank, our dedicated guide to qualitative bank valuation applies seven dimensions including management credibility, loan-book discipline, and the bear case thesis to NAB’s analyst consensus, which itself spans from $29.00 to $48.50 across 14 professionals.
BOQ may be cheap on conventional metrics. The PE-derived valuation of $7.29 and the DDM estimate of approximately $7.19 both imply meaningful upside from $6.21. The broker consensus price target of $7.00-$7.50 confirms that even professional analysts see room for the share price to move higher if execution proceeds on plan.
The complication is what “on plan” requires. A thin NIM of 1.67%, active APRA remediation, leadership mid-transition, and a VAS benchmark that has outperformed over 3- and 5-year horizons create a risk profile the headline valuation does not capture.
The upside case is real but contingent. It requires NIM stability, APRA overlay removal, and successful technology migration. Investors should monitor two leading indicators above all others: the NIM figure in the FY26 full-year result, expected approximately October 2026, and any update on APRA overlay status.
The valuation model is where analysis starts, not where it ends. For BOQ, and for every ASX regional bank, the deeper work begins after the spreadsheet says “buy.”
This is not a verdict against BOQ specifically. It is a demonstration of the analytical work all ASX regional bank investors should perform. The model provides a number. The due diligence determines whether that number is earned.
This article is for informational purposes only and should not be considered financial advice. Investors should conduct their own research and consult with financial professionals before making investment decisions. Past performance does not guarantee future results. Financial projections are subject to market conditions and various risk factors.
Net interest margin (NIM) is the spread between what a bank earns on loans and what it pays on deposits, expressed as a percentage of earning assets. For BOQ, it is the single most important operating metric because a thin NIM of 1.67% leaves limited buffer against competitive mortgage pricing and rising deposit costs.
APRA imposed a $50 million operational risk capital add-on on BOQ following findings of risk-management weaknesses, formalised via a court enforceable undertaking in May 2023. The overlay remains in place as of 1H26, pending demonstrated sustainable improvement in BOQ's remediation programme.
BOQ has materially underperformed the Vanguard Australian Shares Index ETF (VAS) over both 3-year and 5-year horizons, with earlier dividend cuts compounding the gap. VAS charges just 0.07% in management fees and has delivered mid-single-digit annualised returns over those periods while carrying lower volatility.
A blended dividend discount model estimate places BOQ's fair value at approximately $7.19, though the range is wide, from $3.89 to $17.50, depending on assumed dividend growth rates and required returns applied to a bank mid-transformation.
The two leading indicators to watch are the NIM figure in BOQ's FY26 full-year result, expected around October 2026, and any APRA update on the removal of capital overlays, since both directly affect earnings power and dividend capacity.


