VAS vs VHY: Why the Lower-Yield ETF Wins in Retirement
2 hrs ago

Netwealth Group is growing faster than most companies on the ASX, yet it pays a minimal dividend and its near-term earnings look modest relative to its share price. So how do investors actually value it? For Australian investors accustomed to assessing stocks through dividend yield or price-to-earnings (P/E) ratios, high-growth platform businesses like Netwealth (ASX: NWL) present a genuine analytical challenge. The conventional metrics either produce misleading signals or do not apply cleanly to a business still compounding its asset base at scale. This article explains what the price-to-sales ratio is, why it serves as the more appropriate starting point for businesses like Netwealth, and what NWL’s current multiple of 21.53x, sitting roughly 2.19x below its five-year historical average, may or may not be telling investors right now.
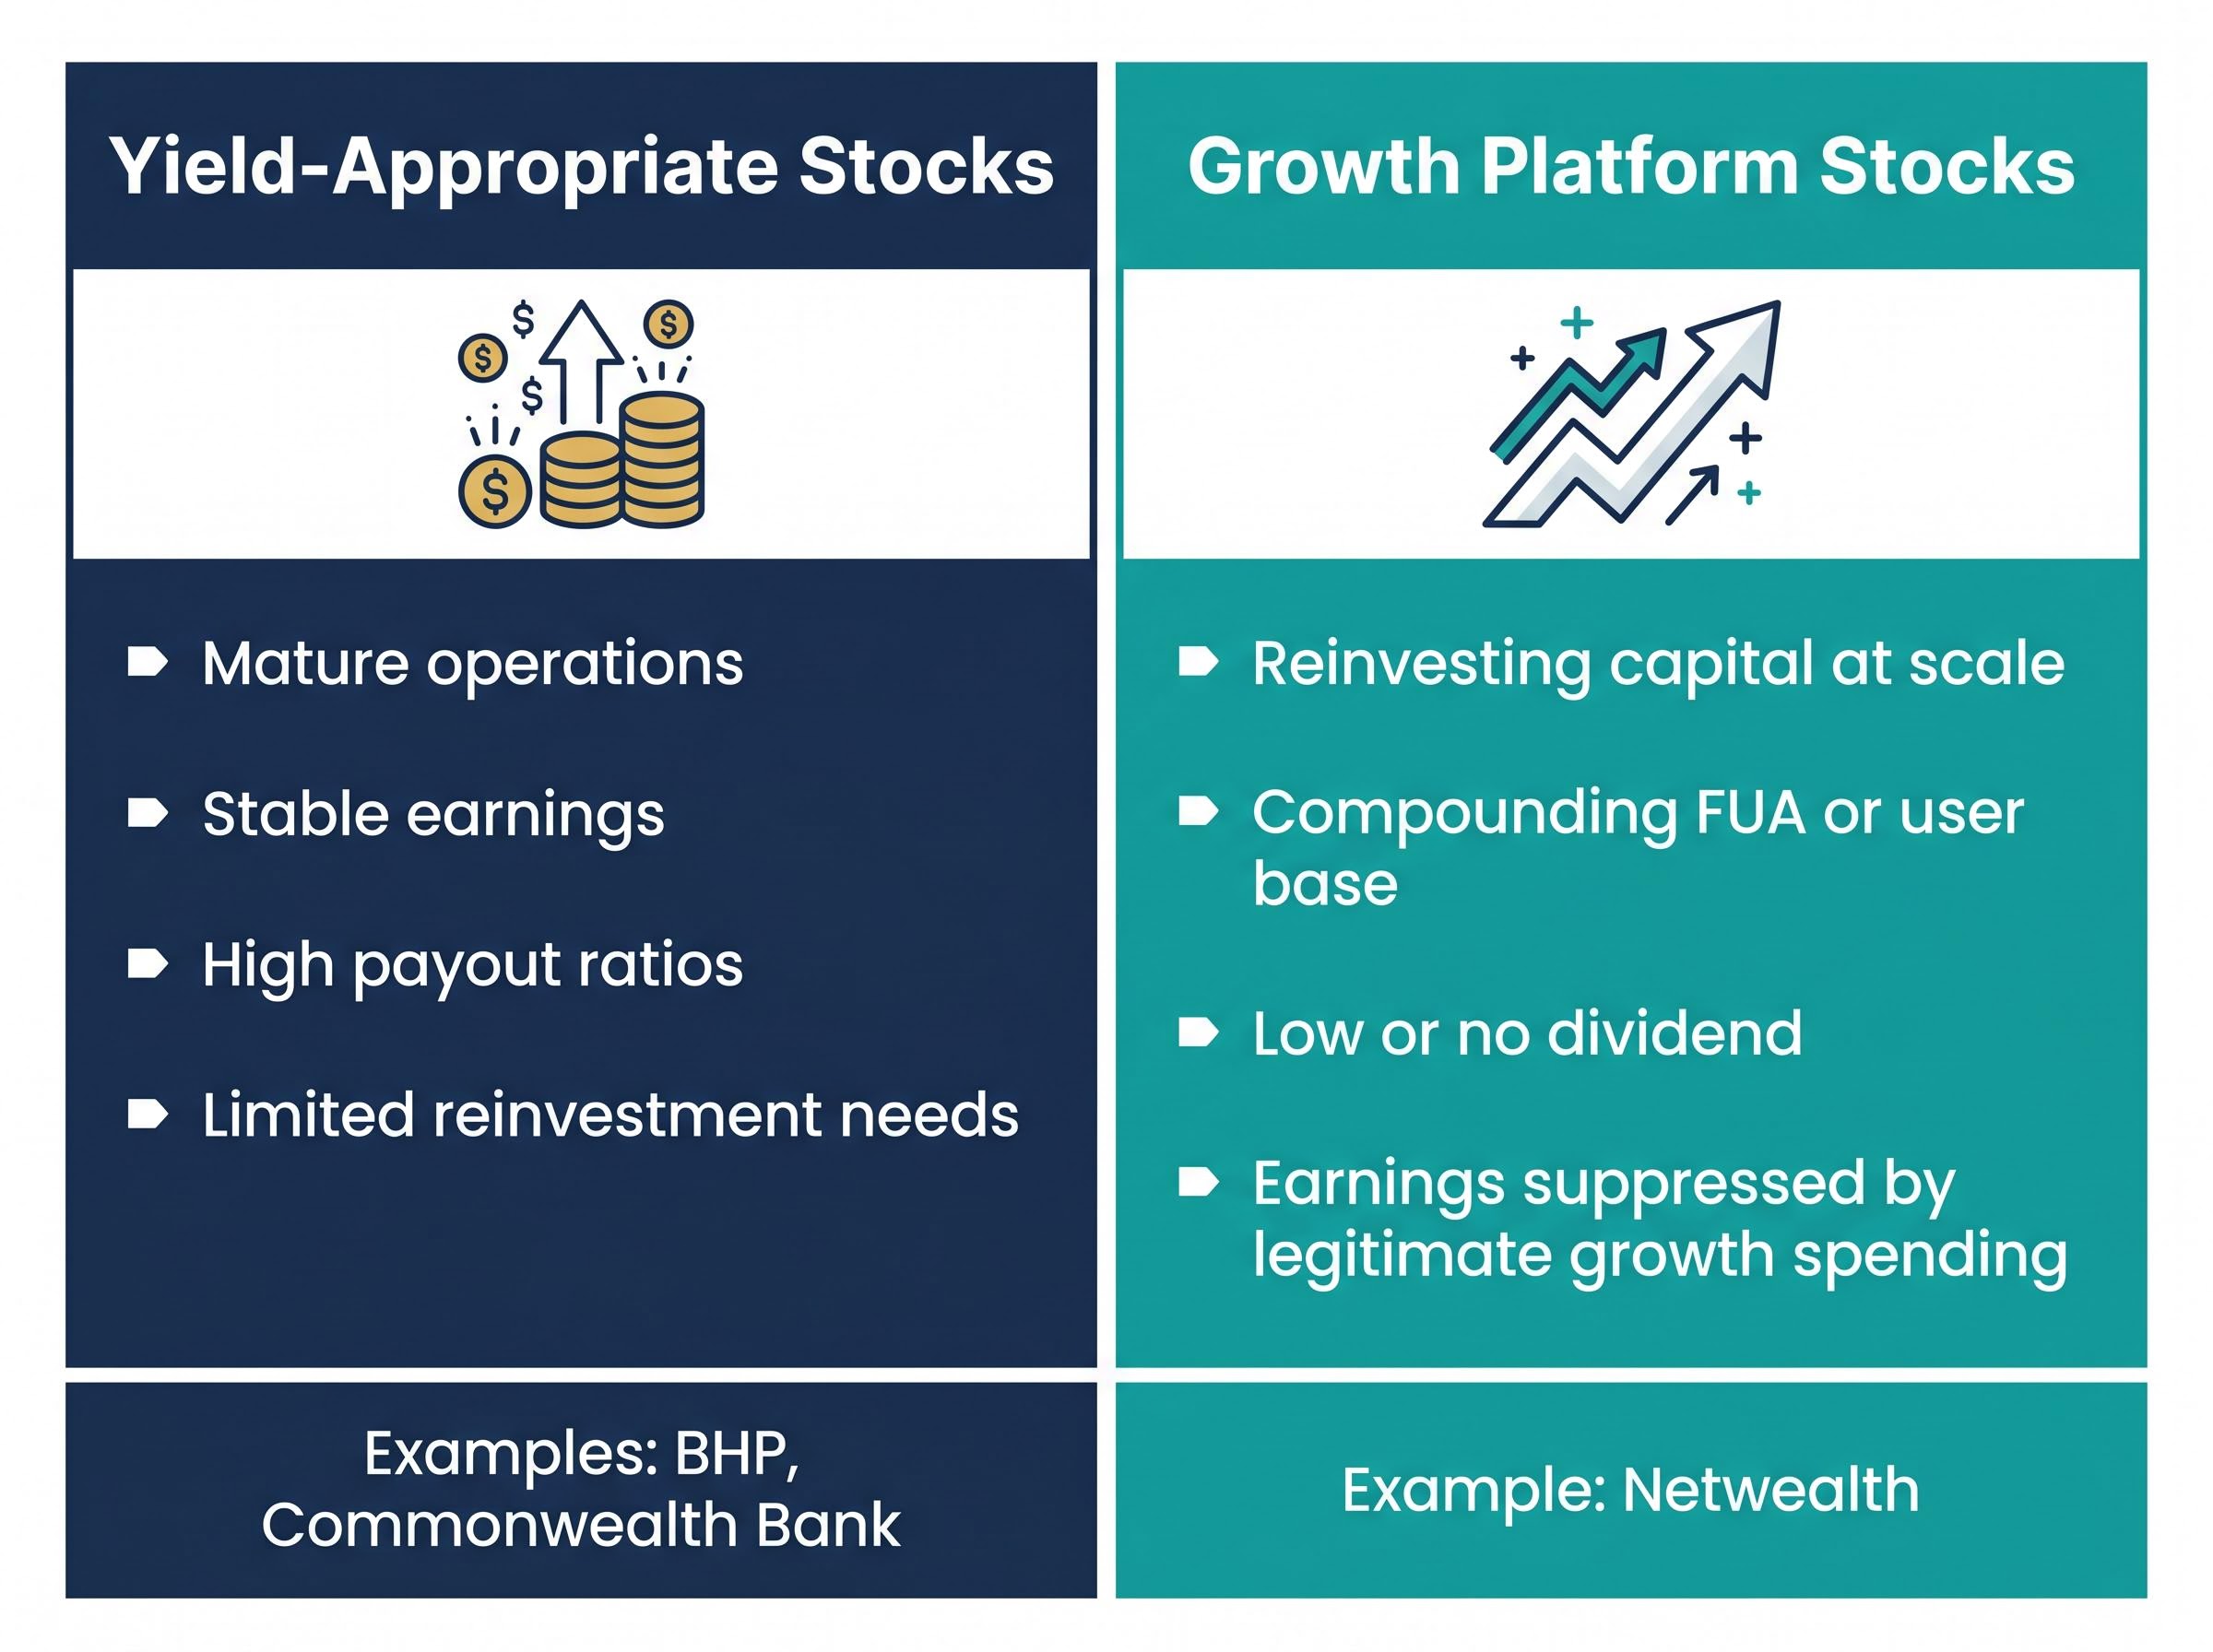
Dividend yield is one of the first numbers Australian investors check. For a company like BHP or Commonwealth Bank, it makes sense: those businesses generate stable earnings and return a large share to shareholders. Netwealth does neither of those things at scale, and that is by design.
The dividend discount model, by contrast, is built for exactly the type of business Netwealth is not: mature companies with stable, predictable payout ratios where intrinsic value is derived from the present value of future income streams rather than compounding revenue growth.
NWL is a growth-oriented business. Its capital is being reinvested into platform development, adviser acquisition, and FUA (funds under administration) expansion rather than distributed as dividends. Applying a yield-based lens to a company in a compounding phase produces a number that looks unattractive but says nothing meaningful about the business’s trajectory.
Near-term earnings multiples create a similar distortion. When reinvestment, amortisation of technology assets, and scaling costs compress reported profit, a P/E ratio can make a rapidly growing business look more expensive than it is, or simply produce a figure that does not reflect the underlying economics.
The characteristics of these two categories look different in practice:
When a company is compounding its asset base rather than distributing cash, dividend yield stops being a useful compass.
The question, then, is which metric captures what the market is actually pricing into a business like Netwealth. That is where the price-to-sales ratio enters the picture.
When an investor sees NWL trading at a price-to-sales (P/S) multiple of 21.53x, the number itself is straightforward. It means the market is currently willing to pay $21.53 for every $1 of Netwealth’s annual revenue. The higher the multiple, the more the market expects that revenue to grow.
The formula itself is simple:
Price-to-Sales Ratio = Market Capitalisation ÷ Annual Revenue
Reading a P/S multiple follows three steps:
A P/S multiple in the 20x-plus range, where NWL currently sits, reflects an expectation of strong future revenue growth rather than current profitability. The market is pricing in continued FUA expansion and the operating leverage that comes with a scalable platform model, where revenue can grow significantly without a proportional increase in cost.
P/E ratio limitations become most acute precisely when a business is spending aggressively to grow: amortisation of platform assets, capitalised development costs, and scaling investments all reduce reported earnings without reducing the underlying cash-generating capacity of the business.
Earnings can be compressed by legitimate reinvestment, platform development costs, or amortisation schedules. None of these reduce the underlying revenue quality of the business, but they do suppress reported profit. Revenue, by contrast, is harder to obscure through accounting choices, which is why P/S is often used alongside EV/EBITDA (enterprise value to earnings before interest, tax, depreciation, and amortisation) and P/E as a cross-check rather than a replacement for either.
Not all revenue deserves the same multiple. A mining services company earning $57.5 million per quarter from one-off contracts is a fundamentally different proposition from a platform business earning the same figure from recurring, scale-dependent fees. Netwealth sits firmly in the second category.
The business model works as follows: financial advisers use Netwealth’s platform to manage client portfolios, and Netwealth earns recurring fees tied to funds under administration. As FUA grows, revenue grows with it, without requiring a proportional increase in headcount or infrastructure spending. This creates high revenue visibility because the fees recur for as long as the assets remain on the platform.
The FUA trajectory underpins the revenue line. At 31 March 2025, Netwealth reported FUA of $104.1 billion, with net flows of $3.5 billion for the quarter alone, an indicator of organic growth momentum. By 30 June 2025 (FY25 full year), FUA had grown to $112.8 billion. The company, founded in 1999, had accumulated more than 140,000 account holders as of 2024.
Netwealth operates alongside HUB24 as one of the two dominant listed Australian platform operators. The competitive scale looks like this:
| Company | FUA (31 March 2025) | FUA (FY25 Full Year) |
|---|---|---|
| Netwealth | $104.1 billion | $112.8 billion |
| HUB24 | $113.8 billion | Not yet reported |
Netwealth’s revenue is structurally recurring, not transactional. It grows automatically as FUA grows, without a proportional increase in cost. This is why the market assigns a premium P/S multiple to the business.
Finding an external P/S benchmark for ASX-listed wealth platforms is difficult; no consensus “fair” multiple exists in publicly accessible research. A more practical approach is to compare a stock’s current multiple against its own pricing history.
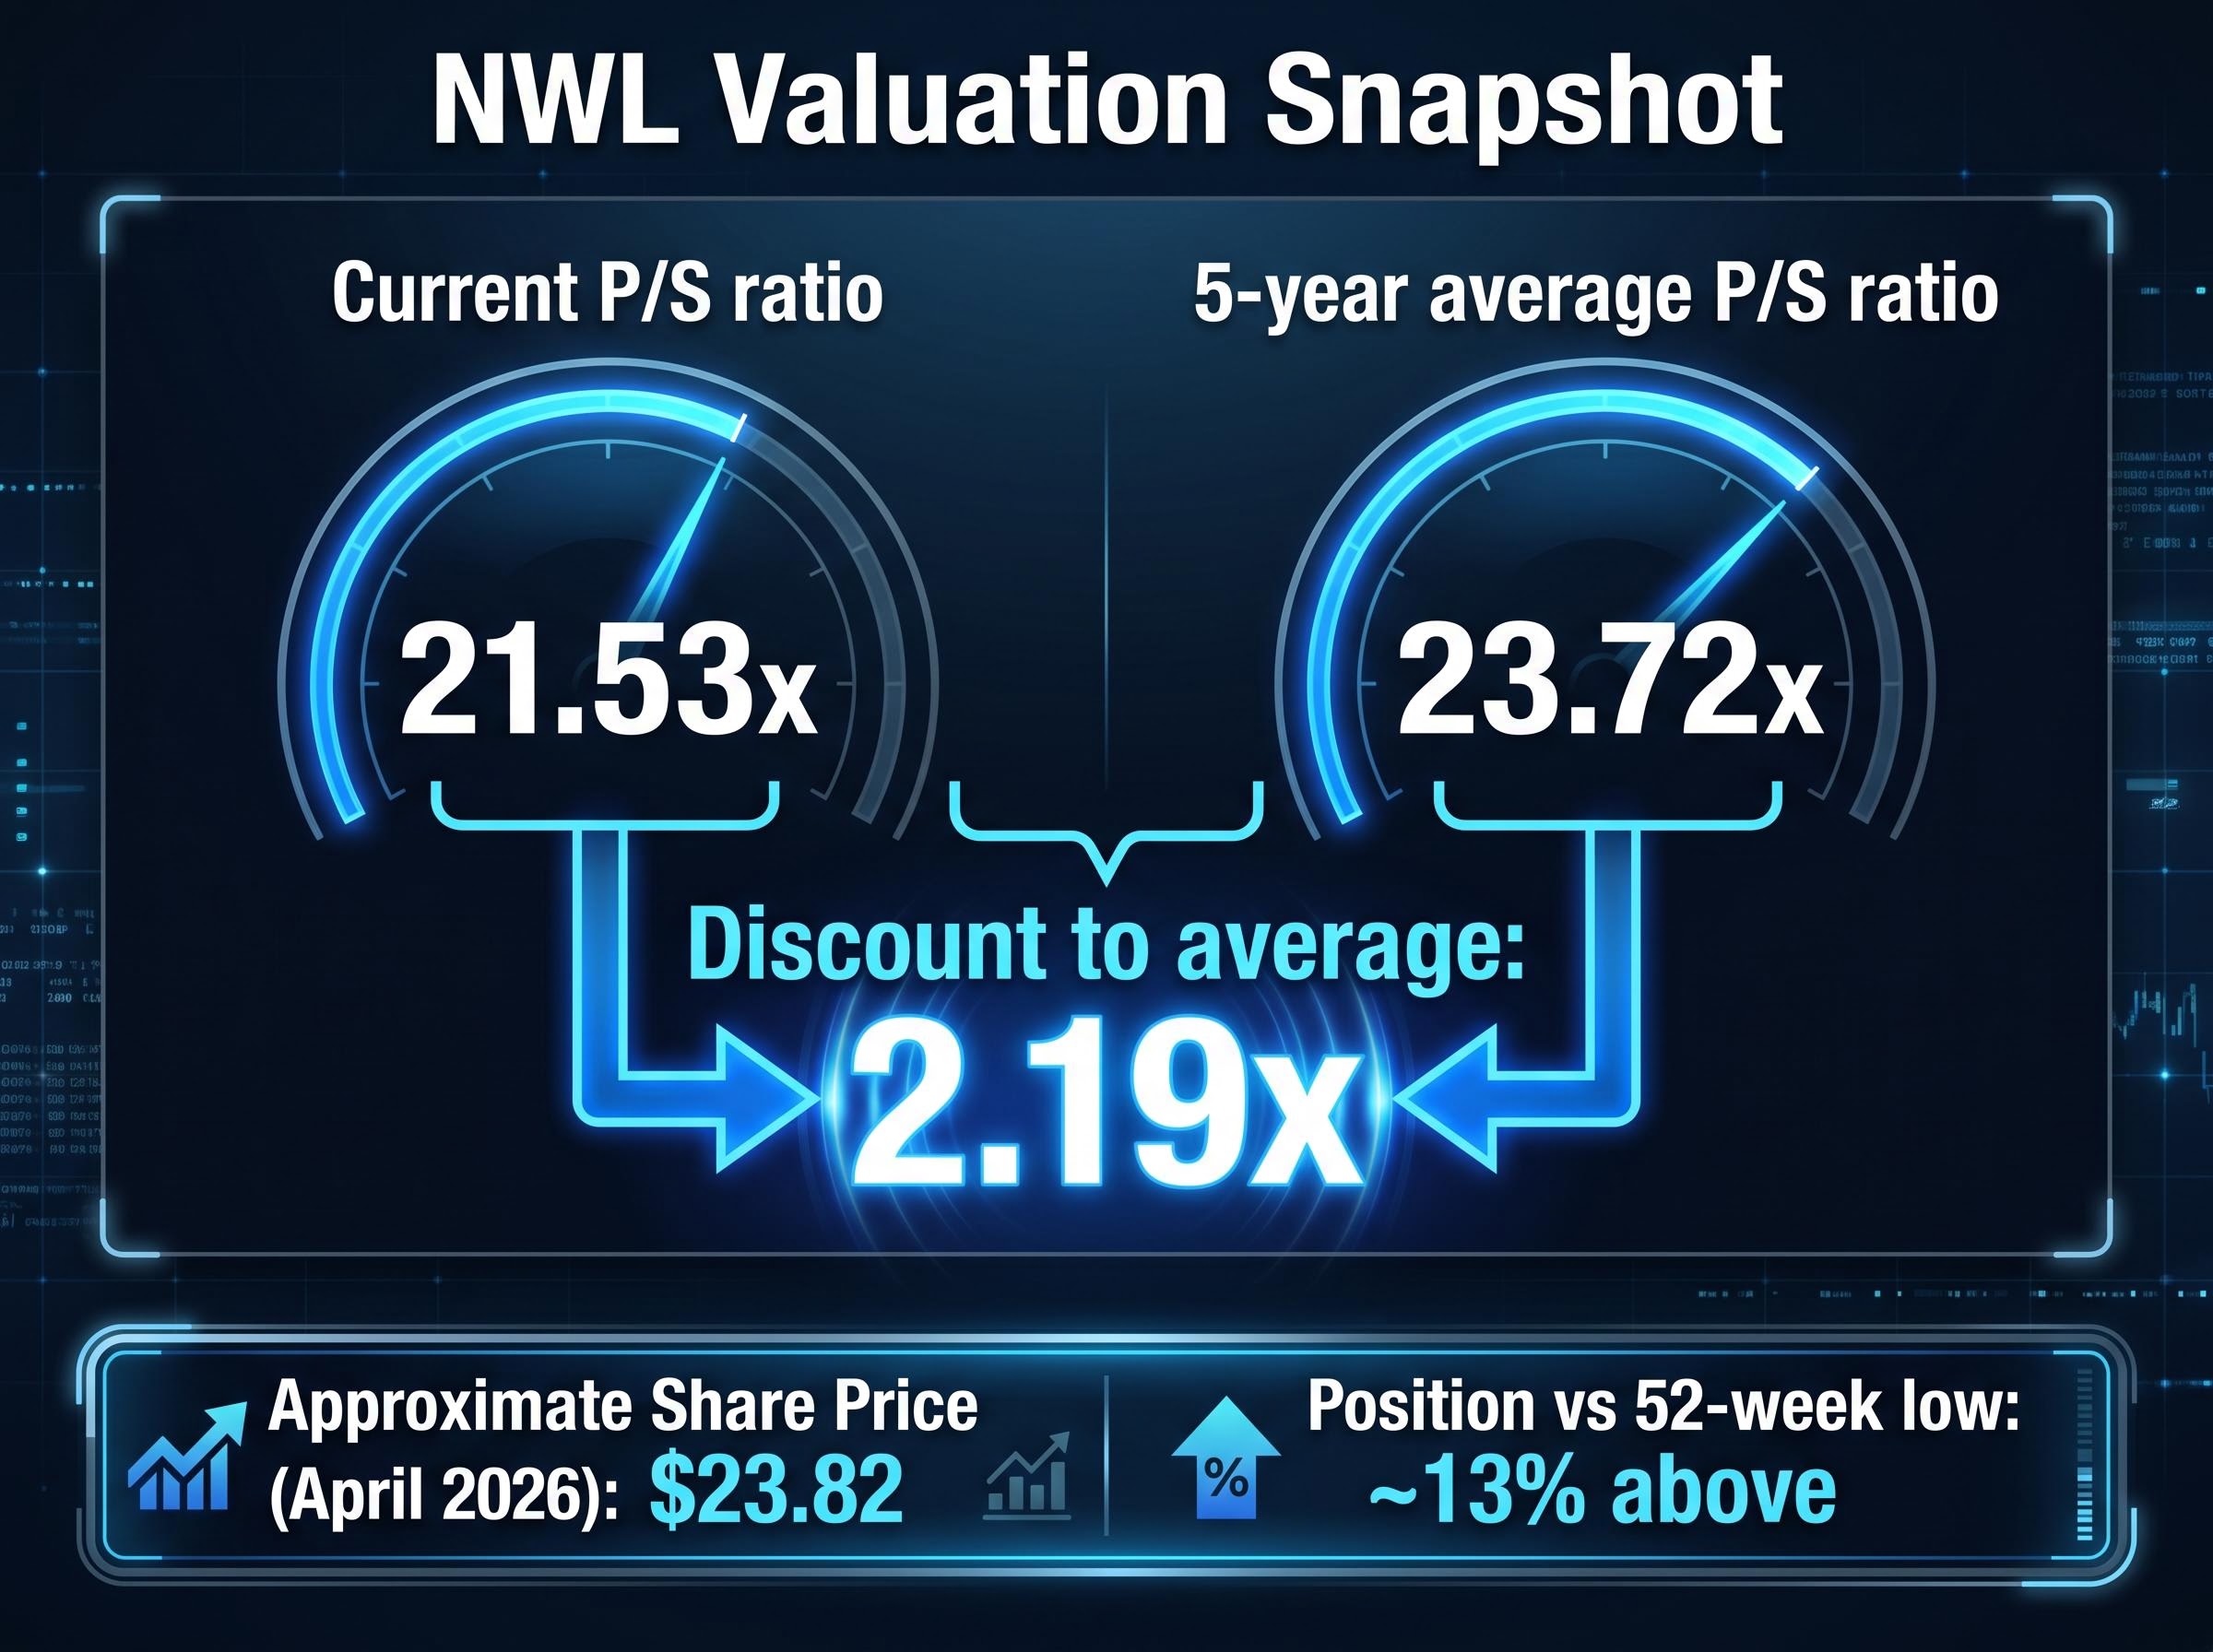
NWL’s current P/S ratio is 21.53x. Its five-year historical average is approximately 23.72x. That places the current multiple roughly 2.19x below where the market has, on average, been willing to price each dollar of Netwealth’s revenue over the past five years.
| Metric | Value |
|---|---|
| Current P/S ratio | 21.53x |
| Five-year average P/S ratio | 23.72x |
| Discount to average | 2.19x |
| Approximate share price (April 2026) | $23.82 |
| Position vs 52-week low | Approximately 13% above |
The comparison is worth walking through carefully. A 21.53x multiple is not “cheap” in any absolute sense; it still reflects a significant growth premium. What it does indicate is that the market is currently pricing NWL’s revenue at a lower multiple than it has on average over five years.
A discount to historical average is a signal worth investigating, not a conclusion to act on mechanically. Two interpretations are equally valid at face value.
P/S discount signals require careful interpretation regardless of sector: Zip Co’s P/S ratio of 3.76x sits approximately 35% below its own five-year average, a structurally similar pattern to NWL’s current discount, yet Zip’s negative operating cash flow introduces a material risk dimension that the ratio alone cannot capture.
The first is that the stock has drifted to a relative discount and may represent an opportunity if the underlying growth trajectory remains intact. The second is that the market has rationally repriced its growth expectations, perhaps reflecting concerns about the pace of net flows, margin trajectory, or competition from HUB24.
Macro factors also play a role. Interest rate expectations affect the multiples the market assigns to long-duration growth assets. Regulatory scrutiny of platform governance and managed accounts can shift compliance cost assumptions. Both of these can compress or expand the P/S multiple independent of company-specific performance.
The price-to-sales ratio identifies relative positioning. It does not tell an investor whether Netwealth will sustain its growth rate or what the business is intrinsically worth.
A complete valuation for a business like NWL would typically cross-check P/S against EV/EBITDA and P/E, and a thorough analysis would include a discounted cash flow (DCF) model to stress-test revenue growth assumptions under different scenarios. P/S is the starting point, not the verdict.
A multi-method valuation framework, combining P/S as a revenue screen, EV/EBITDA as an operational benchmark, and DCF to stress-test growth assumptions, produces materially more reliable conclusions than any single metric, particularly for platform businesses where earnings and cash flow can diverge significantly from reported profit.
Three variables would most materially change the P/S interpretation for Netwealth. Net flow momentum is the first: if quarterly net flows decelerate from the $3.5 billion recorded in March 2025, the revenue growth assumption embedded in a 21x-plus multiple weakens. Margin trajectory as FUA scales is the second: the platform model’s value rests on operating leverage, and any failure to convert FUA growth into margin expansion would undermine the premium. The interest rate environment for long-duration growth assets is the third, as rate expectations directly influence how much investors are willing to pay for future revenue.
Continued adviser migration to open-architecture platforms remains a structural tailwind supporting the revenue growth assumption. Regulatory scrutiny of managed accounts and platform governance, however, can affect compliance costs and therefore margin assumptions, a factor that can work in either direction depending on how policy evolves.
After calculating a P/S ratio, a practical next step follows three stages:
Single-metric valuation approaches are a starting point. Analyst commentary consistently recommends cross-referencing P/S with DCF or earnings-based models for more thorough analysis before reaching any investment conclusion.
Netwealth’s P/S multiple of 21.53x, set against a five-year average of 23.72x, tells investors that the market is currently pricing the company’s revenue at a modest discount to its own history. With FUA of $112.8 billion at FY25 year end, net flows of $3.5 billion in the March 2025 quarter, and a share price approximately 13% above its 52-week low as of May 2026, the operational trajectory remains consistent with a growth platform business.
What the P/S ratio does not tell investors is whether that growth will persist, whether margins will expand as FUA scales, or whether the current discount reflects a temporary mispricing or a rational reassessment.
The NWL case study distils into a set of transferable principles applicable to any high-growth, low-dividend ASX stock:
This article is for informational purposes only and should not be considered financial advice. Investors should conduct their own research and consult with financial professionals before making investment decisions. Past performance does not guarantee future results, and valuation assessments are subject to market conditions and various risk factors.
The price to sales ratio (P/S) measures how much the market is willing to pay for every dollar of a company's annual revenue, calculated by dividing market capitalisation by annual revenue. For example, Netwealth's current P/S of 21.53x means the market is paying $21.53 for every $1 of its revenue.
The P/E ratio can be distorted for growth businesses because reinvestment spending, platform development costs, and amortisation all compress reported earnings without reducing the underlying revenue quality. The P/S ratio uses revenue as its denominator, which is harder to obscure through accounting choices and provides a more stable basis for comparison during a high-growth phase.
Netwealth's current P/S ratio of 21.53x sits approximately 2.19x below its five-year historical average of 23.72x, indicating the market is currently pricing the company's revenue at a modest discount relative to its own pricing history. This is a signal worth investigating further, but it is not a buy signal by itself.
Three key variables would most materially shift the P/S interpretation: the pace of quarterly net flows (which were $3.5 billion in March 2025), whether margin expansion follows FUA growth as the platform scales, and broader interest rate conditions that affect how much investors pay for long-duration growth assets.
The P/S ratio is a starting point for identifying relative positioning, not a standalone verdict. Analysts recommend cross-referencing it with earnings-based metrics such as EV/EBITDA and P/E, and stress-testing growth assumptions through a discounted cash flow model, before forming any view on whether a stock is attractively valued.