Vanguard VIHY Declares First Distribution at 49.49 Cents per Unit
1 hr ago

Zip Co shares closed at A$2.60 on 11 May 2026, sitting 22.4% below where they started the year. In the same quarter that produced that decline, the company posted record cash EBITDA, expanded its operating margin, and lifted full-year guidance. When a share price falls while the business beneath it accelerates, the valuation question sharpens. The price-to-sales ratio offers one structured way to frame it. What follows is an application of that ratio to Zip’s current situation, an explanation of what the gap between its 3.76x current multiple and its 5.81x five-year average actually means, and a frank assessment of the limitations every investor should weigh before treating a single metric as a conclusion.
The 22.4% year-to-date decline is the puzzle at the centre of this analysis. At A$2.60, the market is pricing Zip Co as though something has deteriorated. The Q3 FY26 trading update, released on 17 April 2026, told a different story.
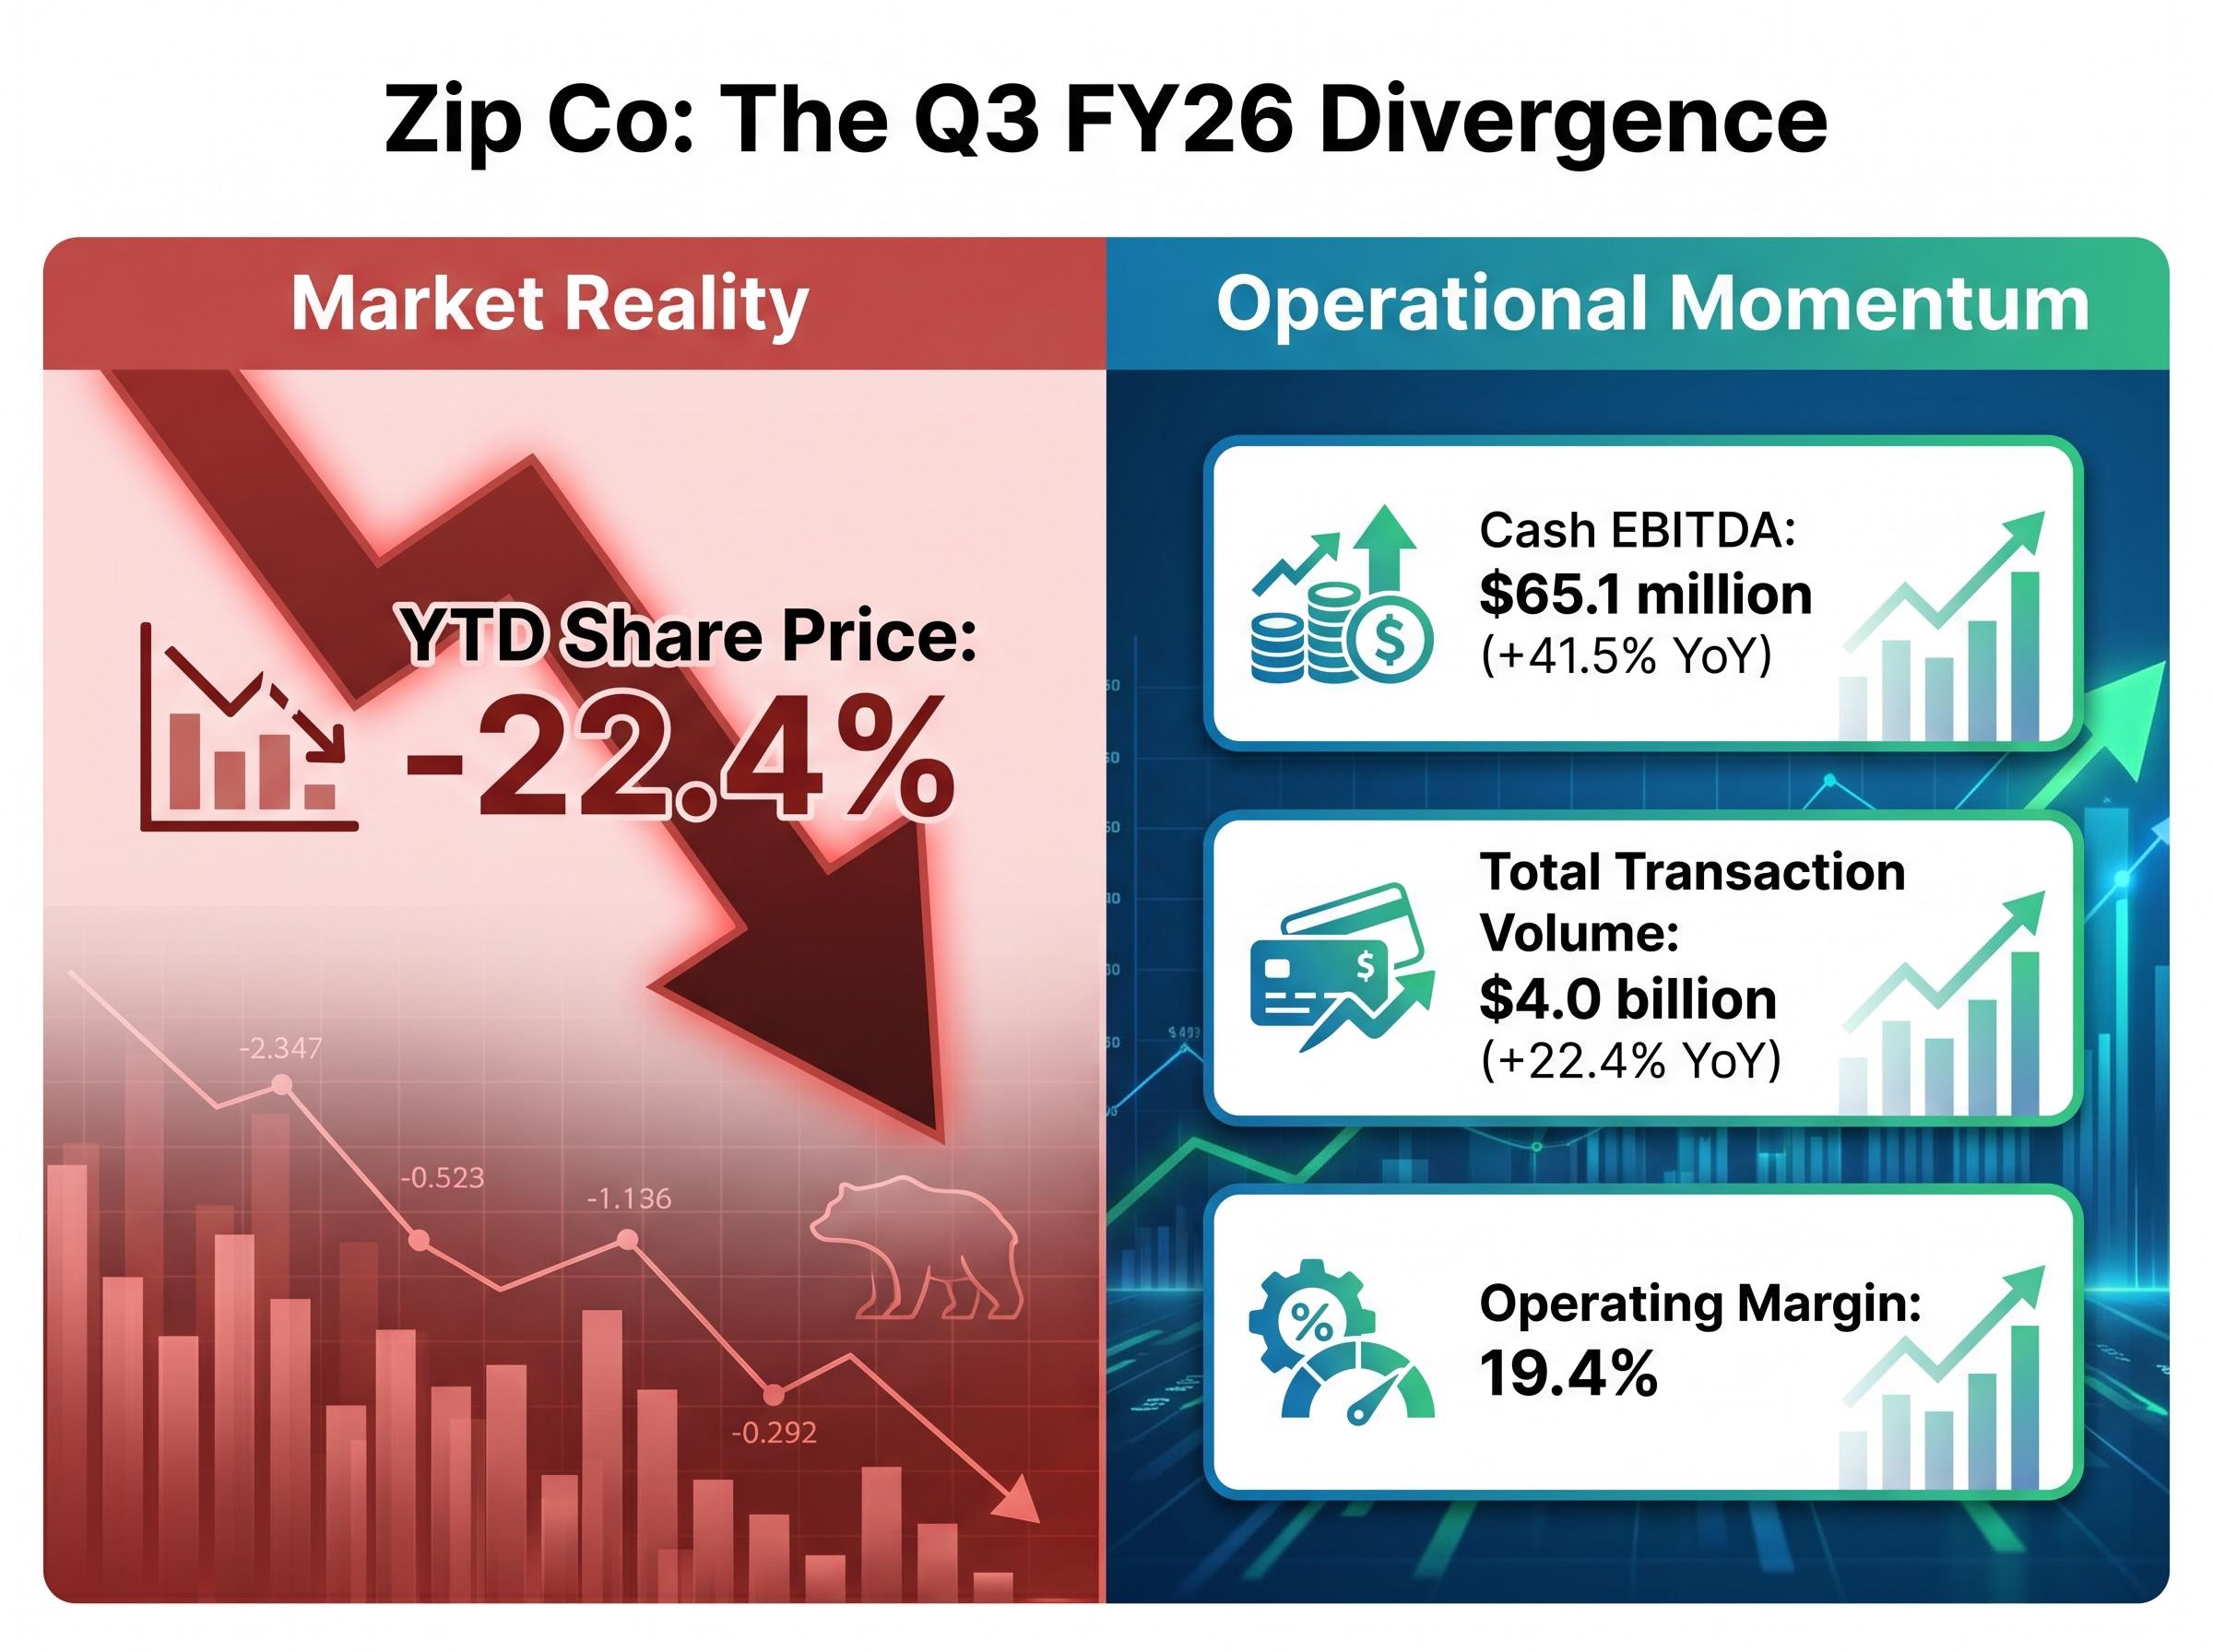
The operational highlights from that quarter:
FY26 guidance: Zip Co lifted its full-year cash EBITDA target to at least $260 million, announced alongside the Q3 FY26 trading update on 17 April 2026.
On the day of that update, shares closed at A$2.33, up 13.7%, after touching intraday gains as high as 24%. The rally recovered only a fraction of the year-to-date loss.
Short interest of 11.9% of shares outstanding adds a layer. A meaningful portion of the market’s informed participants are positioned for further downside, even as the operating metrics improve quarter after quarter. That tension between operational momentum and market scepticism is precisely what a valuation framework is designed to interrogate.
The price-to-sales (P/S) ratio divides a company’s market capitalisation by its total revenue, producing a multiple that represents how much investors pay for each dollar of sales. It is one of the simplest valuation metrics available.
| Component | Definition | Zip Co example |
|---|---|---|
| Market capitalisation | Share price multiplied by total shares outstanding | Based on A$2.60 share price |
| Total revenue | Annual income from all sources | $1,081.1 million (FY2025) |
| P/S ratio | Market cap ÷ total revenue | 3.76x |
At 3.76x, investors are paying approximately $3.76 for every dollar of Zip’s annual revenue.
Price-to-earnings ratios rely on a stable earnings denominator. For companies that have only recently crossed into profitability, that denominator can swing dramatically from one year to the next, distorting the multiple.
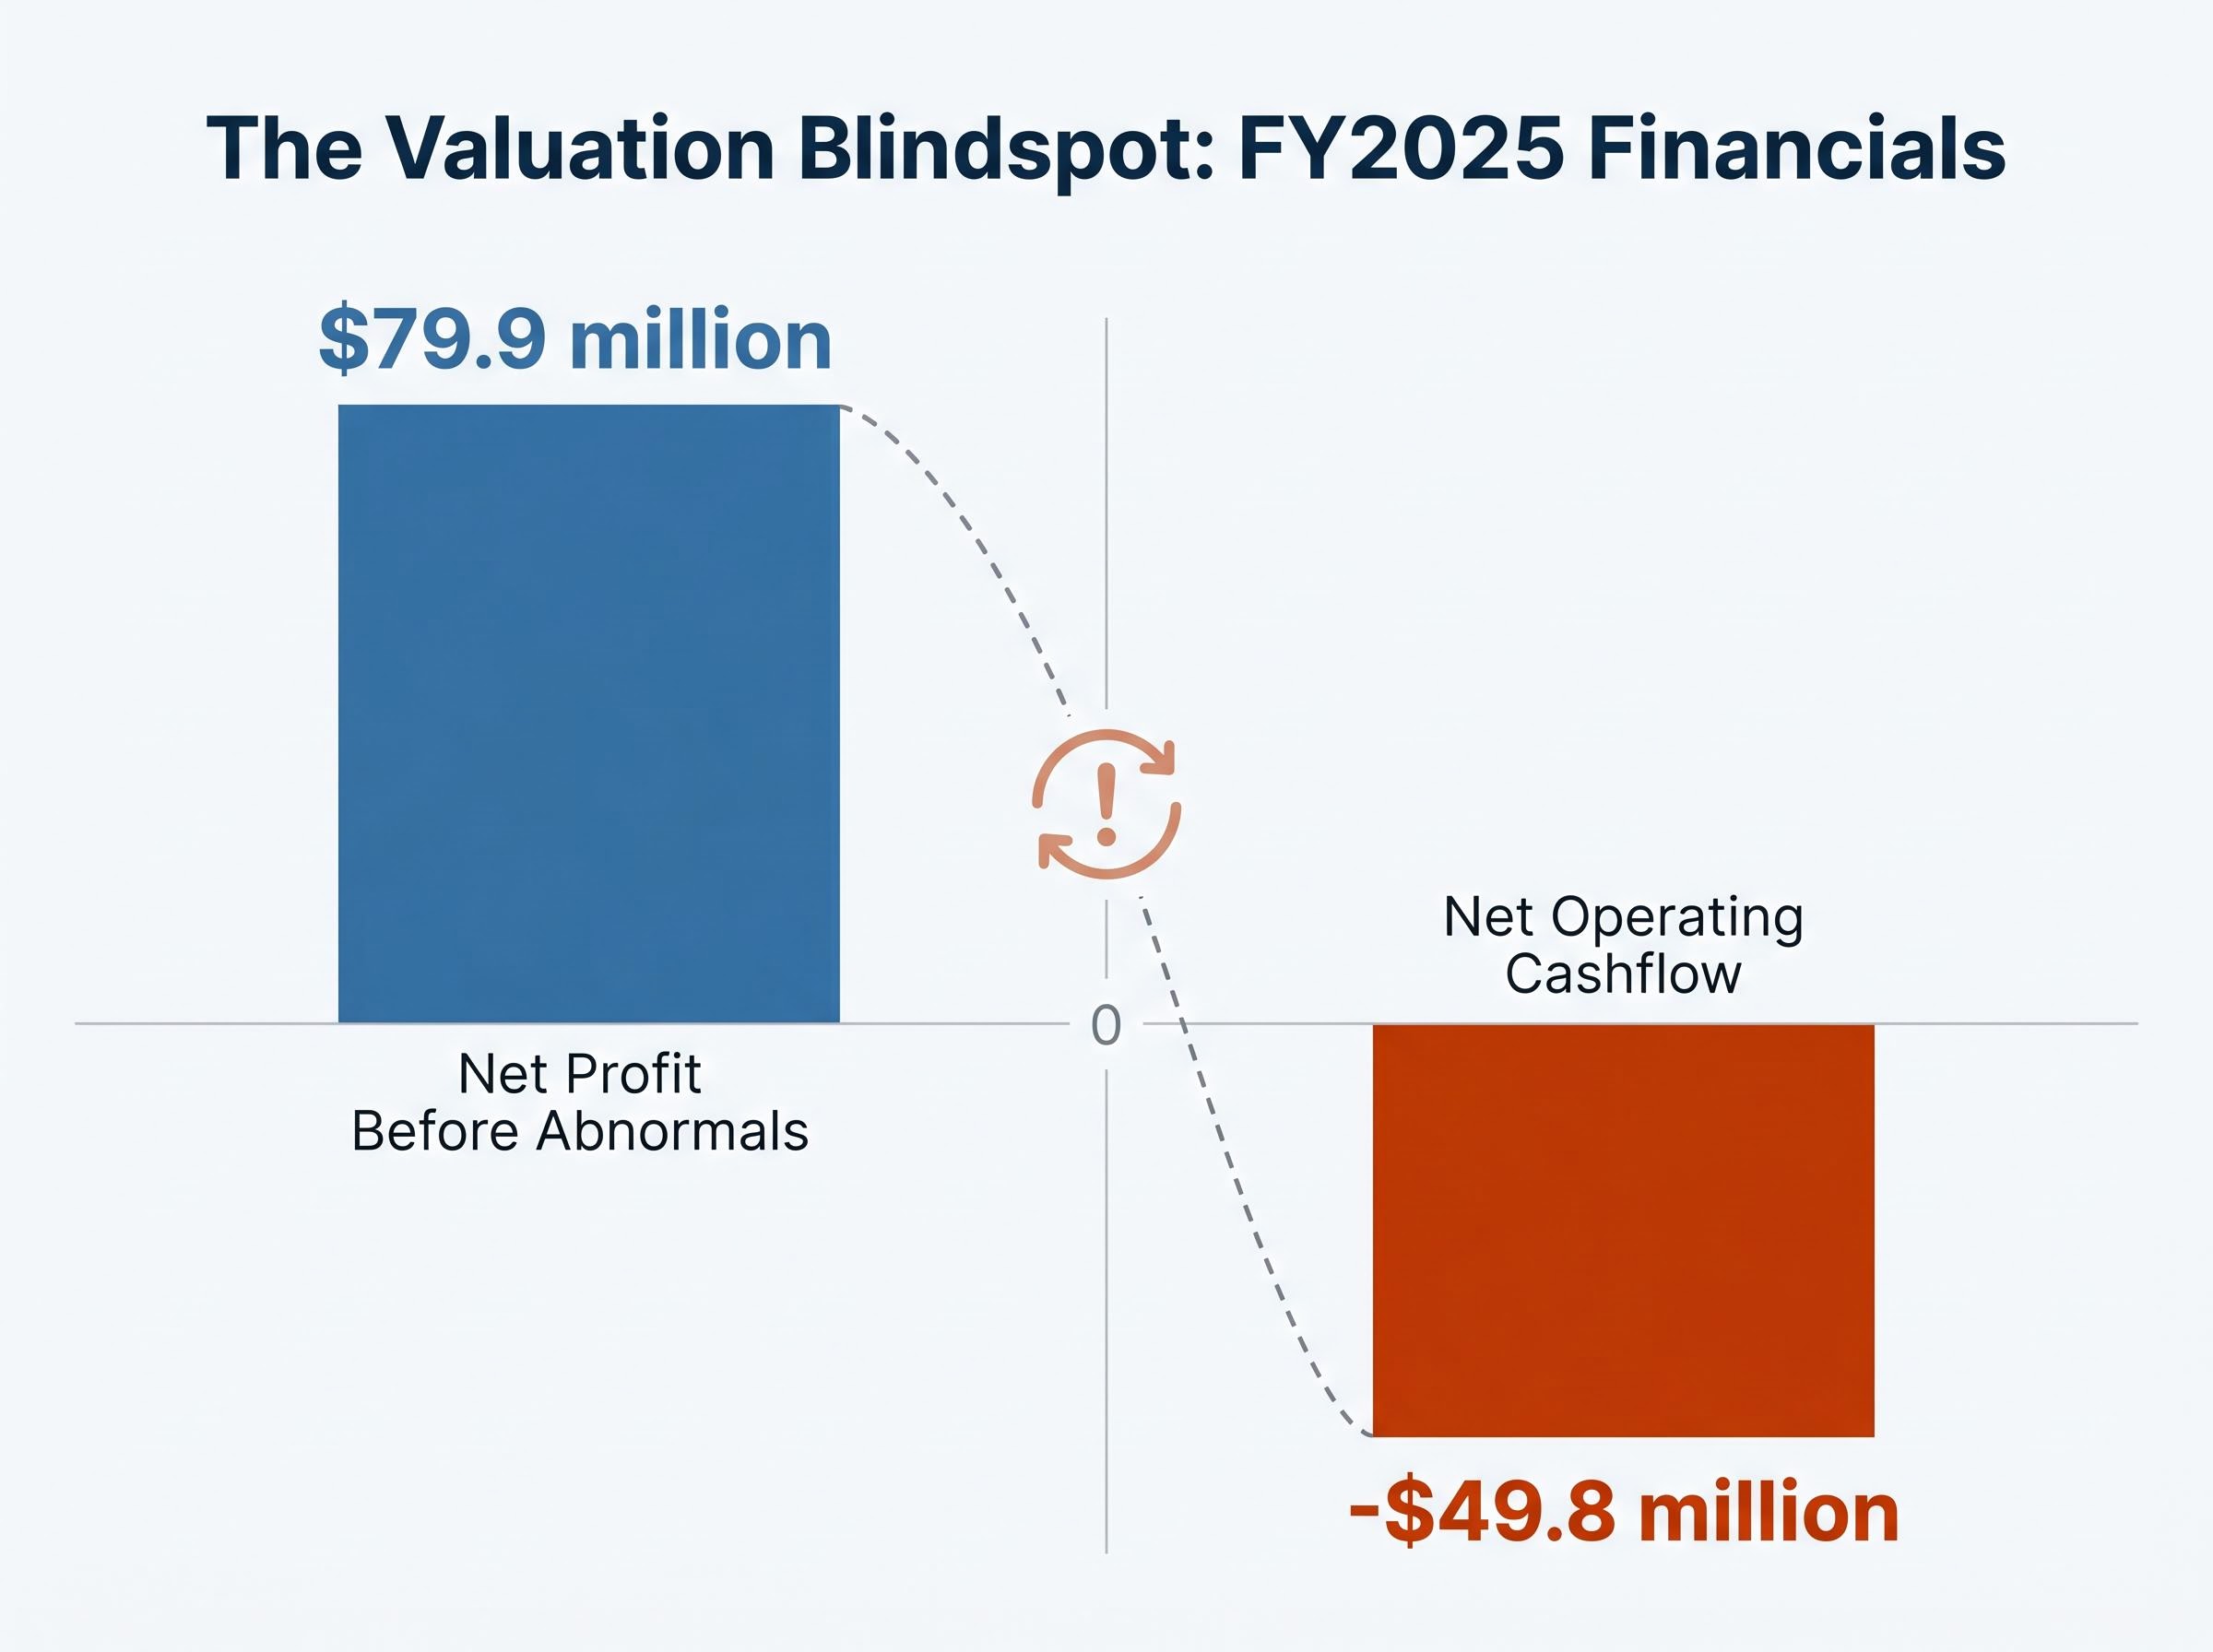
Zip illustrates this directly. In FY2023, the company reported operating losses. By FY2025, net profit before abnormals reached $79.9 million. A P/E ratio calculated across that span would produce wildly different readings, not because the business had become fundamentally different each year, but because the earnings line was transitioning through zero. Revenue, by contrast, grew throughout. That stability makes P/S the more reliable lens for growth-stage fintechs where the profitability trajectory is still maturing.
The CFA Institute market-based valuation framework identifies the price-to-sales ratio as particularly useful when earnings are negative or highly volatile, precisely because sales figures are generally less susceptible to the accounting adjustments that can distort earnings-based multiples during a profitability transition.
Forecasts from Simply Wall St project Zip’s revenue reaching A$1.7 billion by FY2028, implying a compound annual growth rate of approximately 17.4%. That forward revenue growth is the context within which the current P/S multiple needs to be read.
At 3.76x, Zip Co’s current P/S ratio sits roughly 35% below its five-year historical average of 5.81x.
That gap means investors are paying materially less per dollar of Zip’s revenue than they have on average over the past half decade. The question is what that discount represents.
| Metric | Value | Gap to average |
|---|---|---|
| Current P/S | 3.76x | — |
| Five-year average P/S | 5.81x | — |
| Discount to average | — | ~35% |
Two interpretations sit on either side of that number. The first: the market has mispriced Zip relative to its own history, and the operating momentum in Q3 FY26 supports a re-rating toward the mean. The second: the five-year average includes periods when the market assigned a higher multiple to a less profitable, higher-risk version of the business, and the current multiple reflects a more mature, more rational assessment.
The 22.4% year-to-date share price decline widened this gap considerably. The 17 April rally, which saw shares close at A$2.33 (up 13.7%), partially closed it, and subsequent trading pushed the price to A$2.64 by 7 May before a pullback. The gap remains substantial, and its interpretation depends on whether the revenue trajectory can sustain the case for a higher multiple.
Investors wanting to examine the full analyst target range and the competing arguments around whether the April recovery was justified will find our deep-dive into the Zip Co valuation debate useful; it covers the spread from A$2.63 to A$5.53 across analyst price targets, the RBA rate environment as an open variable, and the case for and against a re-rating from the current level.
A falling P/S ratio does not always signal a market re-rating downward. It can also reflect revenue growing faster than the share price appreciates, mechanically compressing the multiple even as the business strengthens.
Zip’s Q3 FY26 numbers point in this direction. Total transaction volume (TTV) reached $4.0 billion, up 22.4% year-on-year. US TTV grew by more than 43% year-on-year. The Stripe partnership, which provides low-cost merchant acquisition at scale, continues to drive the US expansion without proportional increases in distribution costs.
The operating leverage embedded in that margin expansion becomes clearer when examined at the segment level: US credit performance and transaction volume data from April 2026 confirm the trend is extending into Q4, with credit losses tracking below the management target of 1.75% of transaction volume.
Volume growth alone does not settle the question. The quality of that revenue matters.
Simply Wall St’s FY2028 revenue forecast of A$1.7 billion (implying a 17.4% compound annual growth rate) suggests the denominator in Zip’s P/S calculation may continue expanding at a pace that makes the current 3.76x look conservative, if the trajectory holds. A lower P/S becomes a more meaningful potential discount signal when the revenue growth rate behind it is high, because faster growth may justify a higher multiple over time.
The P/S ratio captures one dimension of value. Several others sit outside its field of view, and at least three deserve direct attention in Zip’s case.
The P/S ratio is one of five core fundamental analysis metrics that each answer a different question about the same business; used together, they expose dimensions of value and risk that no single figure can capture on its own.
The ASIC credit licensing rules for BNPL providers, which took effect from June 2025 under the Treasury Laws Amendment Act 2024, introduced modified responsible lending obligations that materially altered the compliance cost base for operators including Zip, a structural shift that investors assessing peer comparisons should factor into any sector-wide P/S analysis.
What P/S does not reveal: Zip Co reported -$49.8 million in net operating cashflow for FY2025, a metric entirely invisible to the price-to-sales ratio.
FY2025 return on equity improved to 11.3% from -34.4% in the prior year, a significant shift that supports the profitability narrative but also underscores how recently the turnaround began. The 11.9% short interest reflects the view of market participants who weigh these limitations more heavily than the headline P/S discount.
At 3.76x, Zip Co’s price-to-sales ratio sits approximately 35% below its five-year average of 5.81x. Against the backdrop of record Q3 FY26 cash EBITDA, upgraded guidance of at least $260 million, and US transaction volume growing above 43%, that gap warrants attention.
It does not, however, warrant a conclusion. The metric earns its credibility only when read alongside revenue trajectory, cashflow development, and competitive context. A P/S discount is a starting point for investigation, not a substitute for it.
For investors considering the next steps, the logical research path includes:
Simply Wall St forecasts FY2028 earnings of A$216.9 million. If that trajectory materialises, the valuation conversation shifts from P/S to P/E, and the question becomes whether today’s share price adequately reflects that earnings path.
This article is for informational purposes only and should not be considered financial advice. Investors should conduct their own research and consult with financial professionals before making investment decisions. Past performance does not guarantee future results. Financial projections are subject to market conditions and various risk factors.
The price-to-sales (P/S) ratio divides a company's market capitalisation by its total revenue to show how much investors pay per dollar of sales. It is preferred for growth-stage fintechs like Zip Co because earnings can swing dramatically during a profitability transition, while revenue provides a more stable comparison base.
A P/S of 3.76x means investors are paying approximately $3.76 for every dollar of Zip's annual revenue, which is roughly 35% below the company's five-year historical average of 5.81x and may indicate the stock is trading at a discount relative to its own history.
Zip Co's share price fell 22.4% in 2026 even as the company reported record Q3 FY26 cash EBITDA of $65.1 million (up 41.5% year-on-year) and raised full-year guidance, with elevated short interest of 11.9% of shares outstanding suggesting a portion of the market remains sceptical of the operational momentum.
The P/S ratio does not reveal cashflow health (Zip reported net operating cashflow of -$49.8 million in FY2025 despite reporting a net profit), it relies on a historical average that includes periods when Zip carried higher risk and a different business mix, and it lacks peer context without comparison to other global BNPL operators.
Key milestones include whether FY26 full-year results meet the at-least-$260 million cash EBITDA guidance, whether net operating cashflow turns positive to close the gap between reported earnings and cash generation, and how Zip's P/S multiple compares to global BNPL peers as earnings-based multiples become more consistently applicable.