
The Big Four banks account for a combined weighting of roughly one-fifth of the S&P/ASX 200, making them among the most widely held equities in Australian portfolios. Yet most retail investors evaluate them the same way they evaluate a retailer or a mining company: check the share price, glance at the dividend yield, and move on.
Bank stocks require a different analytical lens. Their revenue is overwhelmingly interest-based, their risk profile is shaped by a single regulator (the Australian Prudential Regulation Authority, or APRA), and their profitability hinges on metrics that rarely appear in a standard earnings headline. This guide uses Westpac’s FY25 results as a worked reference point to walk through the four metrics that actually differentiate Australian bank stocks: net interest margin (NIM), return on equity (ROE), Common Equity Tier 1 (CET1) capital, and cost-to-income ratio. By the end, the framework is repeatable for any Big Four reporting season.
Why bank stocks need their own analytical playbook
A bank’s revenue model has almost nothing in common with an industrial company’s. Westpac’s lending income represented approximately 87% of total revenue in its most recent full financial year. The balance sheet is equally distinct: a bank’s liabilities are predominantly customer deposits, not trade payables or corporate debt. That structure means conventional ratios like EBIT margin or debt-to-equity, the standard toolkit for evaluating a retailer or manufacturer, carry far less analytical weight.
Bank valuation frameworks that go beyond PE ratios matter because a single large provision movement can inflate or deflate reported earnings in ways that have nothing to do with the underlying business, making price-to-earnings a particularly unreliable entry point for any serious analysis of the Big Four.
What does carry weight? The metrics that analysts and commentators from Livewire Markets, the Australian Financial Review (AFR), and Morningstar consistently identify as the differentiators for Australian majors. Livewire and the AFR both describe NIM as “the single most important driver of bank profit,” and the remaining three metrics build the rest of the picture.
This guide covers four core metrics:
- Net interest margin (NIM): the spread between lending income and funding costs
- Return on equity (ROE): the profitability return generated for shareholders
- CET1 capital adequacy: the regulatory safety buffer that signals dividend capacity
- Cost-to-income ratio: the efficiency measure that explains why similar margins produce different profits
When big ASX news breaks, our subscribers know first
Net interest margin: the spread that drives everything
NIM measures the gap between what a bank earns on its loans and investments and what it pays for deposits and wholesale funding, expressed as a percentage of interest-earning assets. When NIM expands, bank revenue grows without the institution needing to write a single additional loan. When it compresses, even a growing loan book can produce flat or declining revenue.
That makes it tempting to assume higher interest rates automatically mean higher margins. The 2024-2026 environment shows otherwise. On the lending side, intense mortgage competition has forced banks to price aggressively to retain high-quality borrowers. The AFR noted that both CBA and NAB cited “elevated competition in home lending” as a factor in NIM compression from FY23 to FY24. On the funding side, deposit customers migrated from low-yield transaction accounts into higher-yield term deposits, lifting banks’ cost of funds. The expiry of the RBA’s COVID-era Term Funding Facility (TFF), cheap funding issued during 2020-2021 that was refinanced at higher prevailing rates from 2023 through 2025, added a further drag.
The result is a two-sided squeeze that the RBA’s May 2025 Statement on Monetary Policy made explicit:
“Competitive pressures in mortgage lending and increases in deposit rates have contributed to a narrowing of banks’ net interest margins over the past year.”
Placing Westpac’s FY25 NIM alongside CBA’s reveals where each bank sits relative to the sector.
| Bank | FY25 NIM | vs Sector Average |
|---|---|---|
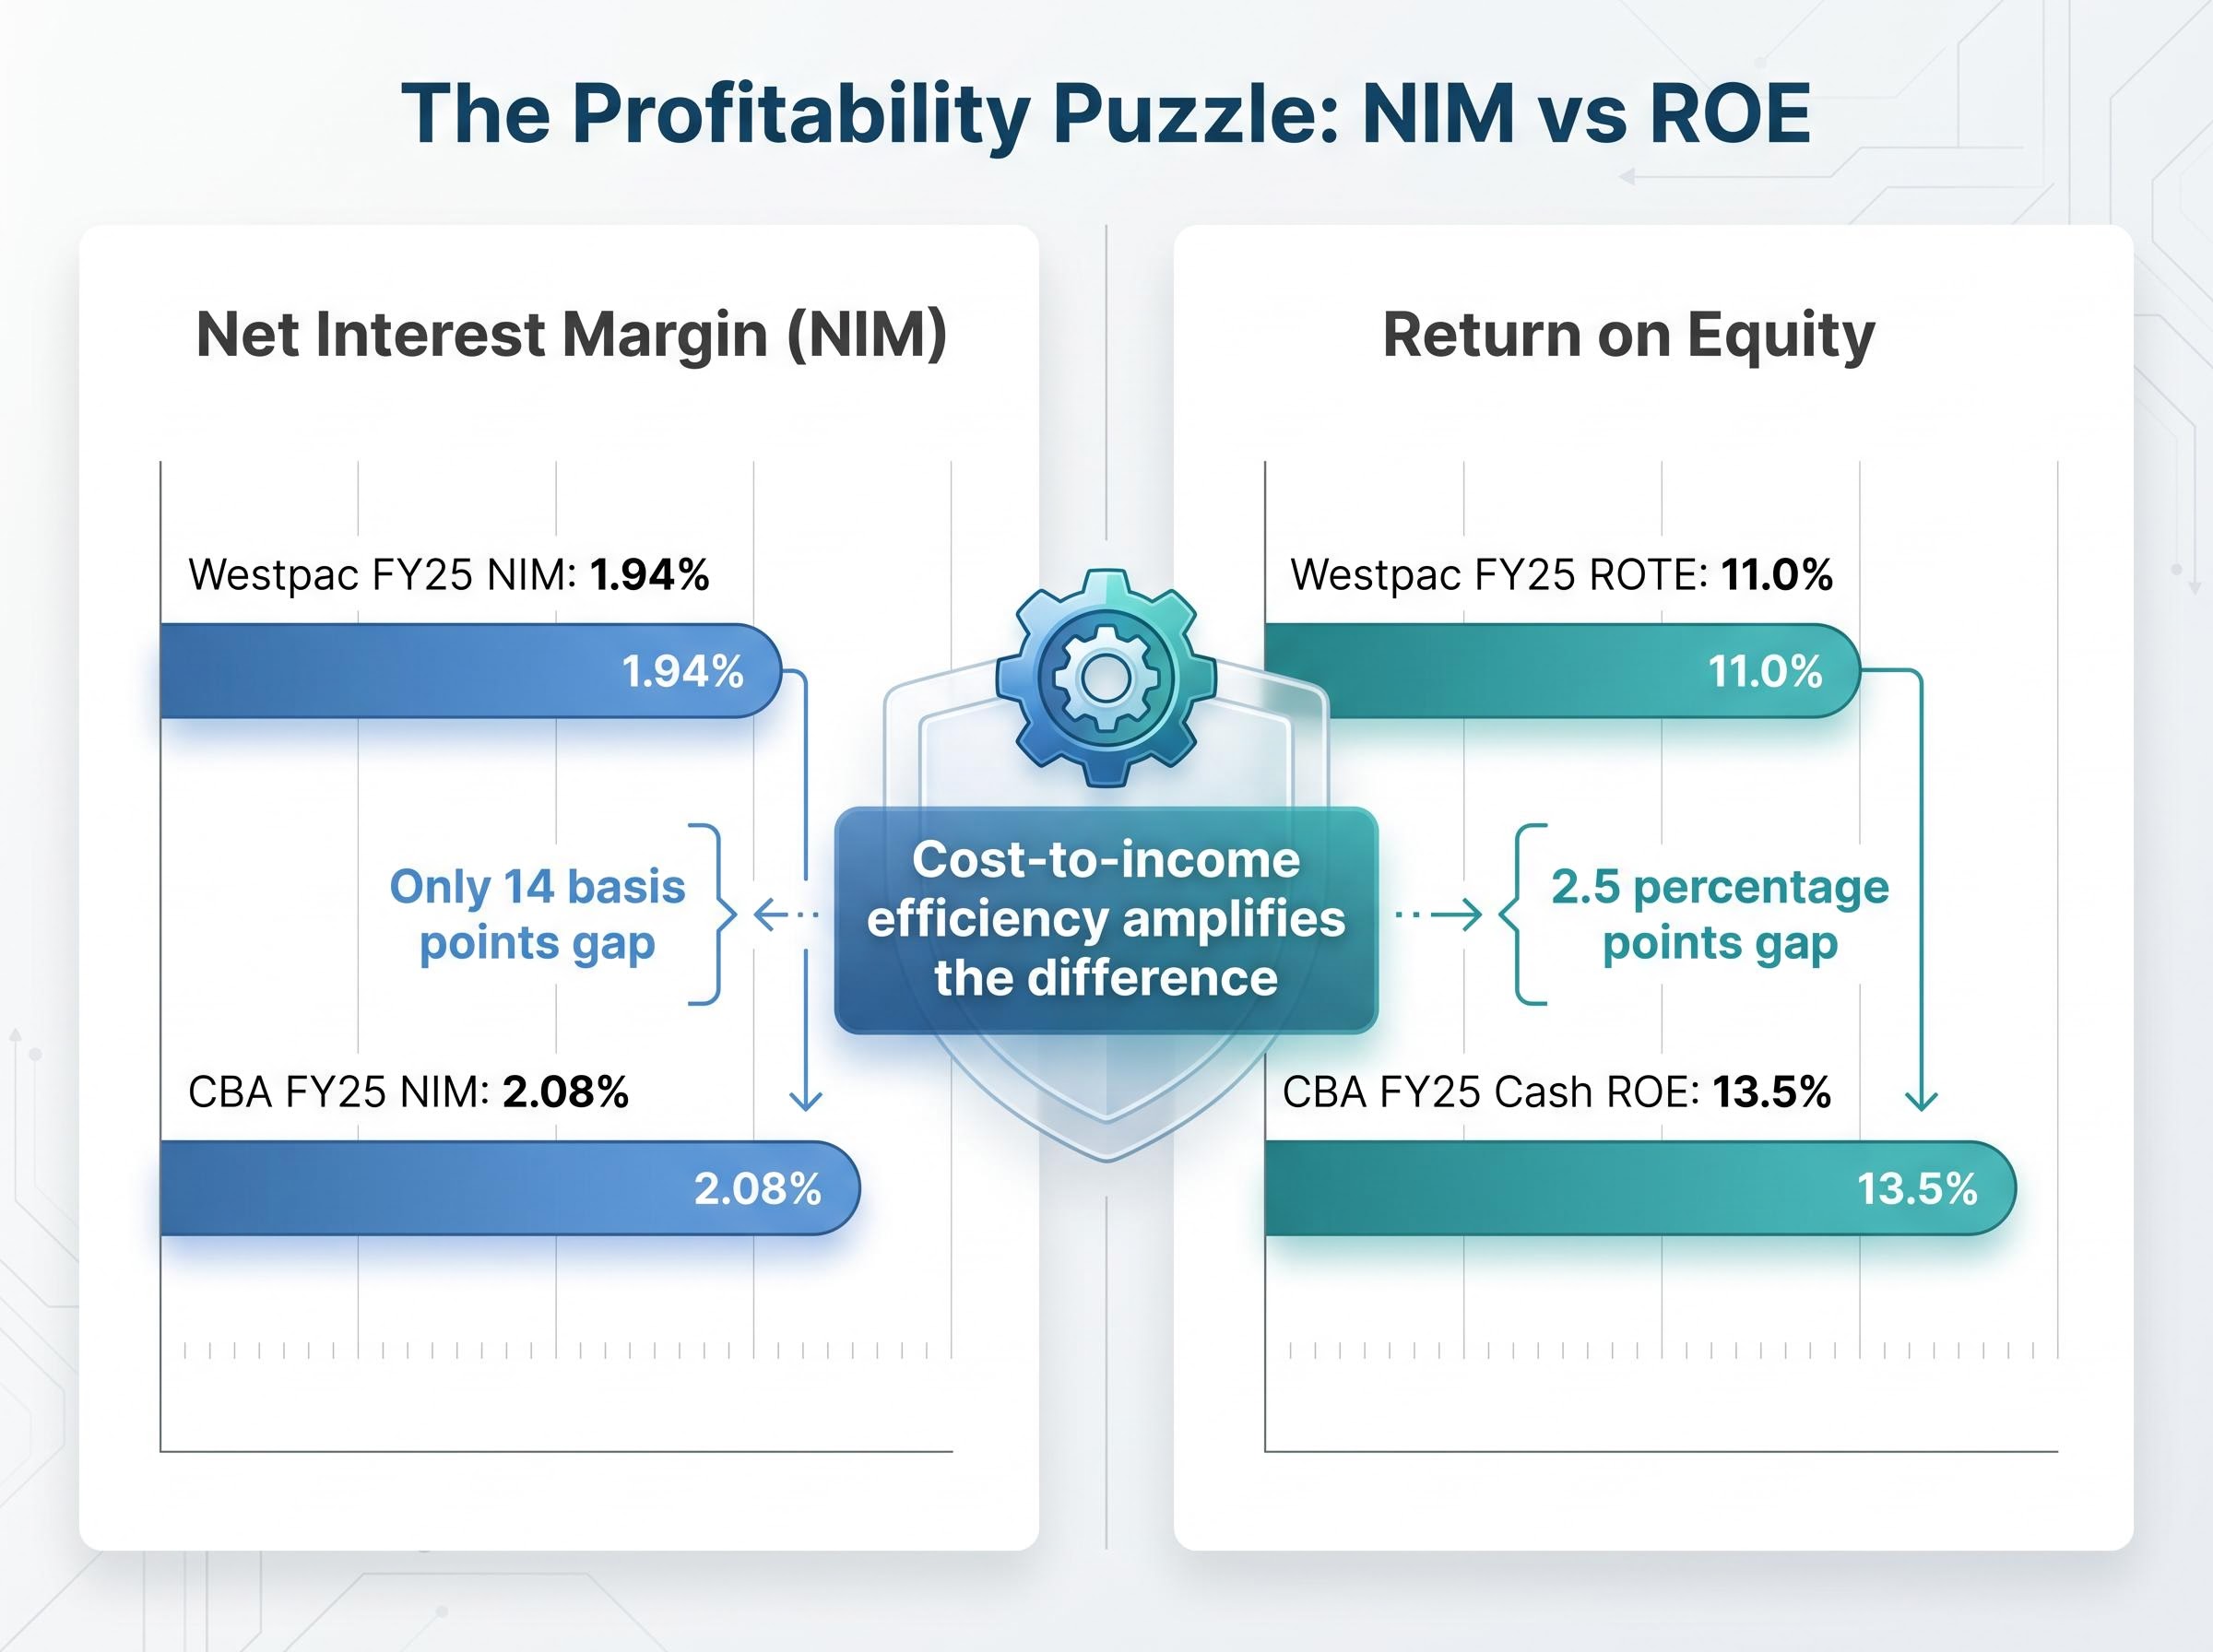
| Westpac | 1.94% | +0.16 percentage points |
| CBA | 2.08% | +0.30 percentage points |
| Sector Average | 1.78% | — |
Sector average sourced from the Rask Invest Research Team. CBA’s NIM premium reflects its larger share of low-cost transaction deposits, a structural advantage in funding costs that does not disappear when rates move. Reading NIM in isolation, however, does not explain the full profitability gap between these two banks. That requires a second pair of metrics.
Return on equity and cost-to-income: the profitability pair
ROE measures how much profit a bank generates for every dollar of shareholder equity. A higher ROE signals a more efficient use of capital, but the number means more in comparison than in isolation. A bank delivering 11% ROE in a sector averaging 9.35% is outperforming; the same 11% ROE in a sector averaging 14% tells a different story.
CBA reported a Cash ROE of 13.5% in FY25. Westpac reported a Return on Tangible Equity (ROTE) of 11.0%. One important note: these are related but not identical measures. Cash ROE includes goodwill and intangible assets in the equity base; ROTE excludes them. Westpac’s primary FY25 profitability disclosure uses ROTE, and direct comparison with CBA’s Cash ROE requires acknowledging this definitional difference. Westpac’s ROE on a Rask Invest calculation basis was 9.7%, against a sector average of 9.35%. For the primary disclosure figure, the bank’s investor presentation provides the most precise reference.
The gap between CBA and Westpac is material. NIM alone does not explain it; the difference is only 14 basis points. So what does?
Why cost-to-income explains what ROE alone cannot
The cost-to-income ratio (CIR) measures what proportion of a bank’s revenue is consumed by operating expenses. A lower CIR means more of each dollar of revenue flows through to profit. If NIM is the top-line driver, CIR is the efficiency filter that determines how much of that margin actually reaches shareholders.
CBA has consistently delivered among the lowest CIRs of the Big Four, reflecting its franchise scale and digital investment over the past decade. This cost advantage amplifies CBA’s NIM premium into a materially higher ROE. FY25 CIR figures for both banks are available in each institution’s investor presentation under the “Financial summary” or “Key ratios” slides.
| Bank | ROE / ROTE (FY25) | Cost-to-Income Ratio |
|---|---|---|
| CBA | 13.5% (Cash ROE) | See FY25 investor presentation |
| Westpac | 11.0% (ROTE) | See FY25 investor presentation |
A bank with a lower ROE is not automatically a weaker business. If the gap reflects temporary cost investment (a technology transformation programme, for instance) rather than a structural efficiency disadvantage, the ROE may narrow over time. CIR helps investors make that distinction.
NAB’s 1H26 result illustrated the same dynamic from a different angle: its ROE ex-notable items of 11.6% improved on its FY25 baseline, yet the share price fell nearly 3% on results day, a reminder that the market’s reaction to bank earnings depends on how the metrics are trending relative to expectations, not just where they sit in absolute terms.
CET1 capital adequacy: what the safety buffer tells you about dividends
Common Equity Tier 1 (CET1) capital is the proportion of a bank’s risk-weighted assets funded by the highest-quality capital, predominantly common equity. APRA requires Australia’s major banks to maintain CET1 well above minimum thresholds under its “unquestionably strong” framework.
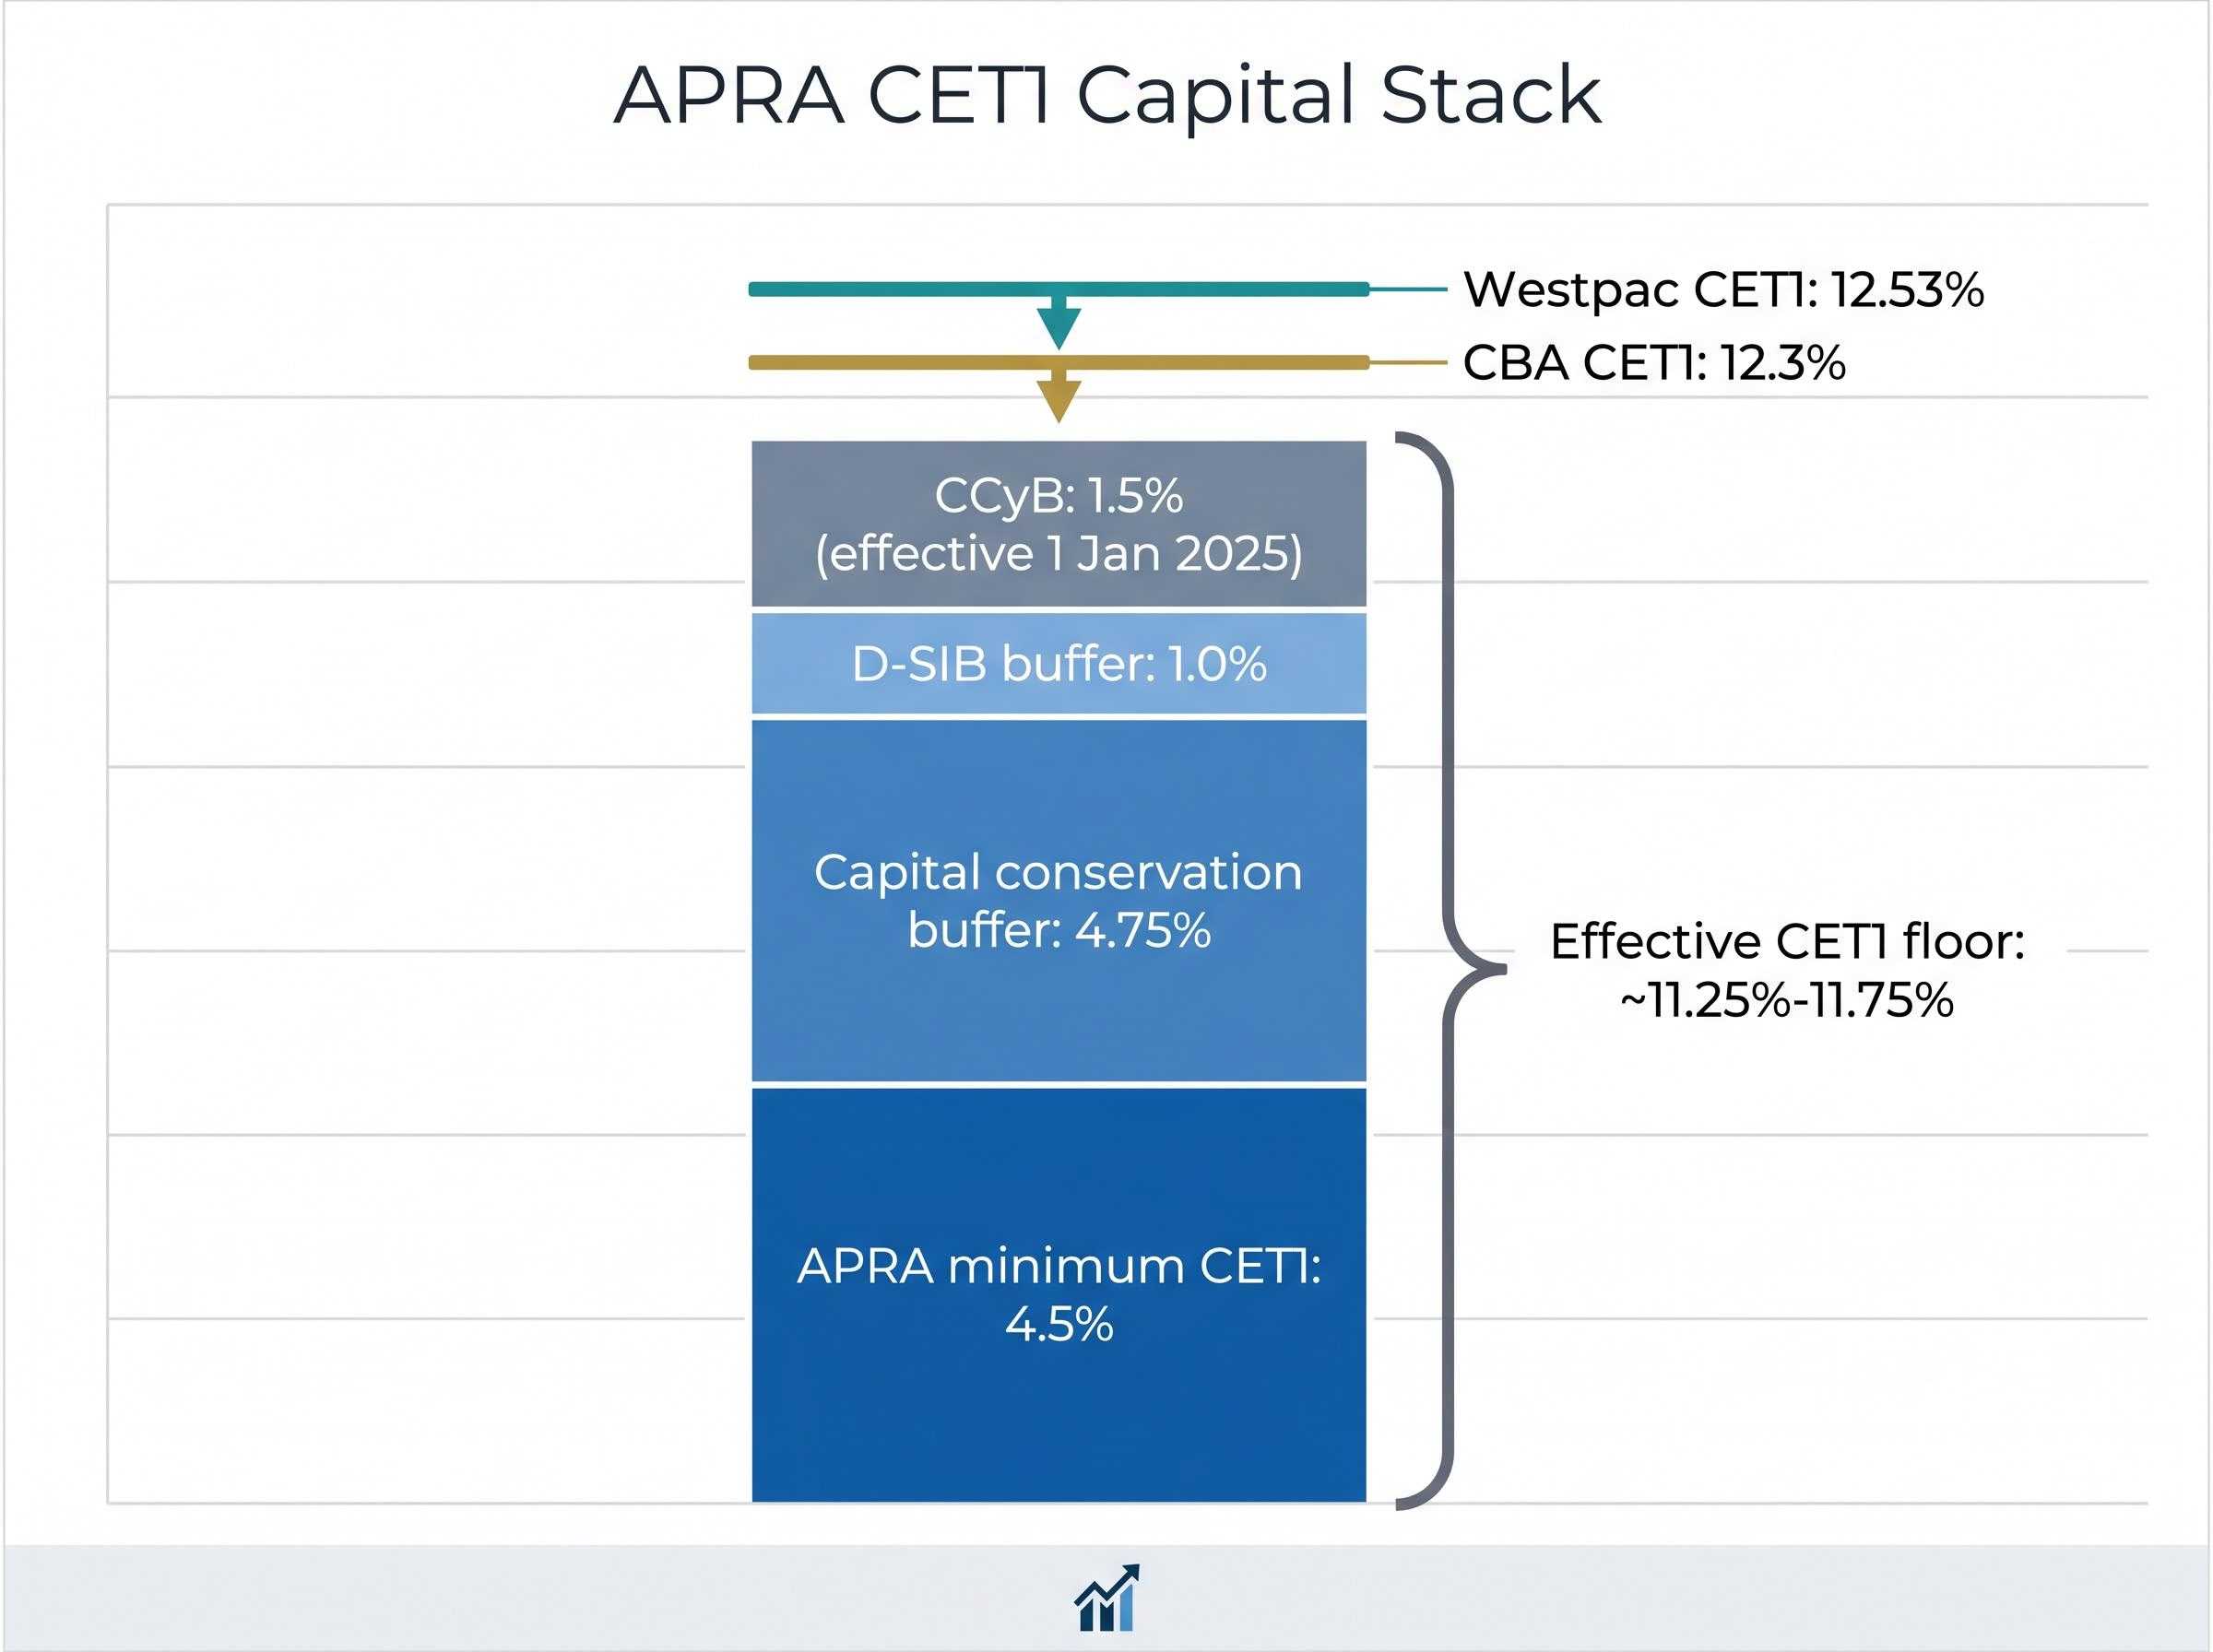
The regulatory stack works as follows. APRA sets a minimum CET1 of 4.5%, then layers on a capital conservation buffer of 4.75%, a domestic systemically important bank (D-SIB) buffer of 1.0%, and a countercyclical capital buffer (CCyB). In March 2024, APRA announced an increase in the CCyB from 1.0% to 1.5%, effective 1 January 2025. The combined effect places the effective CET1 floor for major banks at approximately 11.25%-11.75%.
APRA’s capital framework for major banks establishes the layered buffer architecture that places the effective CET1 floor for Australian majors well above the baseline 4.5% minimum, reflecting a deliberate policy design to ensure domestic systemically important institutions can absorb stress without government intervention.
What matters for investors is the capital above that floor.
CET1 above the regulatory minimum represents the capital available for buybacks, special dividends, or strategic acquisitions. It is the clearest signal of whether a bank’s dividend is sustainable and whether management has room to return capital beyond the ordinary payout.
Westpac’s CET1 stood at 12.53% (Level 2 APRA, September 2025), while CBA reported 12.3% (APRA level, June 2025). Both sit comfortably above the regulatory floor, with the sector average near 12.5% according to the Rask Invest Research Team.
| Bank | CET1 Ratio (FY25) | Buffer Above Regulatory Floor |
|---|---|---|
| Westpac | 12.53% | Approximately 0.78-1.28 percentage points |
| CBA | 12.3% | Approximately 0.55-1.05 percentage points |
| APRA Effective Floor | ~11.25-11.75% | Minimum requirement |
A bank running close to the regulatory minimum during a credit downturn carries more risk than its headline dividend yield might suggest. CET1 headroom is where dividend sustainability lives.
CBA’s CET1 ratio of 11.6% in Q3 FY2026 sits 110 basis points above APRA’s minimum threshold for systemically important banks, yet total risk-weighted assets grew 2.4% during that quarter as commercial lending and residential mortgage books expanded, demonstrating that a comfortable capital buffer can narrow quickly when loan growth accelerates.
Putting the metrics together: how to read a Big Four comparison side by side
Individual metrics tell part of the story. The analyst’s actual process reads them as an interconnected system. The table below consolidates all four metrics for the Big Four, with the caveat that NAB and ANZ FY25 headline figures should be sourced from their respective November 2025 profit announcements for a complete comparison, and that CBA’s financial year ends 30 June while the other three report to 30 September.
| Bank | NIM | ROE / ROTE | CET1 | Cost-to-Income |
|---|---|---|---|---|
| CBA | 2.08% | 13.5% (Cash ROE) | 12.3% | See FY25 presentation |
| Westpac | 1.94% | 11.0% (ROTE) | 12.53% | See FY25 presentation |
| NAB | See Nov 2025 results | See Nov 2025 results | See Nov 2025 results | See Nov 2025 results |
| ANZ | See Nov 2025 results | See Nov 2025 results | See Nov 2025 results | See Nov 2025 results |
| Sector Average | 1.78% | 9.35% (ROE) | ~12.5% | Varies by source |
Reading this table as a system rather than four separate scores reveals the relationships. CBA’s NIM premium is modest (14 basis points over Westpac), yet its ROE premium is substantial (2.5 percentage points or more, depending on the measure used). That gap points to cost efficiency, not margin, as the primary differentiator. Westpac’s slightly higher CET1, meanwhile, signals marginally greater capacity for capital returns.
Analyst commentary from Livewire Markets reinforces the valuation test this framework enables: a bank trading at a premium price-to-book (P/B) multiple is only justified if its ROE sustainably exceeds peers. CBA has commanded the highest P/B among the Big Four for years. Whether that premium remains warranted depends on whether the ROE advantage persists.
The four-step analytical process:
- Assess NIM and its trajectory. Is the margin expanding, stable, or compressing? What is driving the direction (mortgage competition, deposit mix, funding costs)?
- Compare ROE against peers and against CIR. A high ROE driven by low costs is more durable than one driven by temporarily wide margins.
- Check CET1 buffer above the APRA floor. Headroom supports dividends and buybacks; thin buffers warrant caution in a downturn.
- Connect ROE to P/B. Determine whether the current market valuation is justified by the bank’s sustainable profitability, not its trailing headline number.
Beyond the core metrics: what else belongs in a bank stock analysis
The four metrics above form the analytical foundation. A second layer of supplementary metrics explains why those core numbers are moving.
- Loan impairment charges and credit quality: Analysts track both the absolute impairment charge and changes in collective provisioning overlays, which the AFR describes as a “leading indicator of management’s view on forward credit risk.” In a late-cycle credit environment, rising provisions can signal earnings pressure ahead, even if current NIM looks healthy.
- Deposit mix and funding costs: The split between low-cost transaction accounts, higher-cost term deposits, and wholesale funding is the structural driver of NIM resilience. ANZ’s FY24 investor presentation acknowledged that NIM was “impacted by competitive pressures in deposits and mortgages” and that the benefit from rate hikes on deposits had “largely run its course.”
- Non-interest income trends: Fee income and markets revenue contribute varying proportions across the Big Four, affecting earnings quality and predictability.
- Dividend payout ratio and franking credits: Australian retail investors benefit materially from fully franked dividends under the imputation system. According to an ASX Investor Update from June 2024, fully franked dividends can materially increase effective investor yield. Westpac’s FY25 full-year dividend of $1.66 per share provides a reference point for assessing payout sustainability, but a high payout ratio is only sustainable when CET1 sits comfortably above the regulatory floor.
Rising collective provisions were visible in CBA’s Q3 FY2026 result before the headline profit figure signalled any distress: CBA added $200 million to provisions in a single quarter while arrears climbed across every major consumer lending category, precisely the forward-looking credit signal that experienced analysts check before the core ratios have time to reflect the deterioration.
The AFR characterises provisions as a “leading indicator of management’s view on forward credit risk,” making them one of the first metrics experienced analysts check when core ratios still look strong.
A bank with a healthy NIM but rapidly rising impairment charges may be borrowing profitability from the future. These supplementary metrics are where the differentiation that headline numbers sometimes obscure becomes visible.
A smarter way to assess ASX bank stocks from here
The framework above is a repeatable process for any Big Four reporting season. Start with NIM and its trajectory, then check ROE against the cost-to-income ratio to understand the efficiency story. Verify CET1 headroom above the APRA floor. Layer in the supplementary metrics, impairment charges, deposit mix, and payout ratio, to build the complete picture.
The four-step sequence:
- Assess NIM direction and the forces driving it (mortgage competition, deposit migration, funding cost shifts).
- Compare ROE across peers and trace any gap back to cost-to-income efficiency.
- Check CET1 against the APRA regulatory floor to gauge dividend sustainability and capital return capacity.
- Layer impairment charges, deposit mix, and payout ratio to test whether the core metrics are telling the full story.
Each metric is publicly available. FY results investor presentations are published on each bank’s ASX announcements page, typically under slides titled “Financial summary” or “Key ratios.” APRA’s published ADI statistics provide a cross-check for capital ratios. Rask Media and Livewire Markets offer further worked examples for retail investors seeking deeper analysis.
Australian bank stocks are among the most widely held equities on the ASX, yet the analytical gap between checking a dividend yield and understanding the four metrics that drive it is significant. Closing that gap improves the quality of every bank stock decision from here forward.
This article is for informational purposes only and should not be considered financial advice. Investors should conduct their own research and consult with financial professionals before making investment decisions.