
Style Drift: the Silent Risk in Your Active Fund Holdings
1 hr ago

At a share price of roughly $35.21 and a fully franked trailing dividend of $1.66 per share, ANZ looks like a straightforward income stock. Plug those numbers into a dividend discount model, though, and the picture shifts. Depending on the assumptions fed into the formula, fair value could land anywhere from $18 to $84, a range wide enough to make a single-point estimate feel almost meaningless.
The dividend discount model remains one of the most widely referenced valuation tools for mature, high-payout companies, and Australian major bank shares sit squarely in the category for which the model was designed. Yet the formula’s deceptive simplicity hides a dangerous sensitivity to small input changes that catches many investors off guard. What follows unpacks the model from the ground up, walks through a live ANZ worked example using current dividend data, demonstrates why a sensitivity matrix across multiple scenarios produces a more trustworthy estimate than any single calculation, and sets out the qualitative factors that no spreadsheet can capture.
The dividend discount model rests on a single proposition: a company’s value equals the present value of all its future dividend payments. That makes the model most reliable when dividends are the dominant form of shareholder return and are reasonably predictable. Apply it to a high-growth technology company that retains all earnings and pays nothing to shareholders, and the model simply has no inputs to work with.
The origins of the dividend discount model trace back to John Burr Williams, who formalised the concept in 1938 as a direct response to the speculative excesses he observed in the 1920s bull market, establishing the principle that a stock’s value derives from its income stream rather than its resale price.
Australia’s Big Four banks occupy the model’s sweet spot. Three structural characteristics make them natural candidates:
ANZ paid a trailing twelve-month dividend of $1.66 per share in FY25 (83 cents interim plus 83 cents final), fully franked. At a share price of approximately $35.21 in mid-May 2026, that translates to a cash yield of roughly 4.71%. For eligible Australian investors, the grossed-up yield (reflecting the value of franking credits at the 30% corporate tax rate) is materially higher.
A grossed-up DDM valuation that incorporates imputation credits produces materially higher fair value estimates than a cash-dividend-only approach; for a fully franked dividend at the 30% corporate tax rate, the correct grossing-up multiplier of 1.4286 can lift a DDM output by more than 40%, a gap that is particularly significant for superannuation funds in pension phase.
The oligopolistic structure of the Australian banking market supports both earnings and dividend predictability. That stability is precisely what allows a dividend-based valuation model to function. It does not guarantee accuracy, but it makes the exercise credible in a way that would not hold for most other ASX sectors.
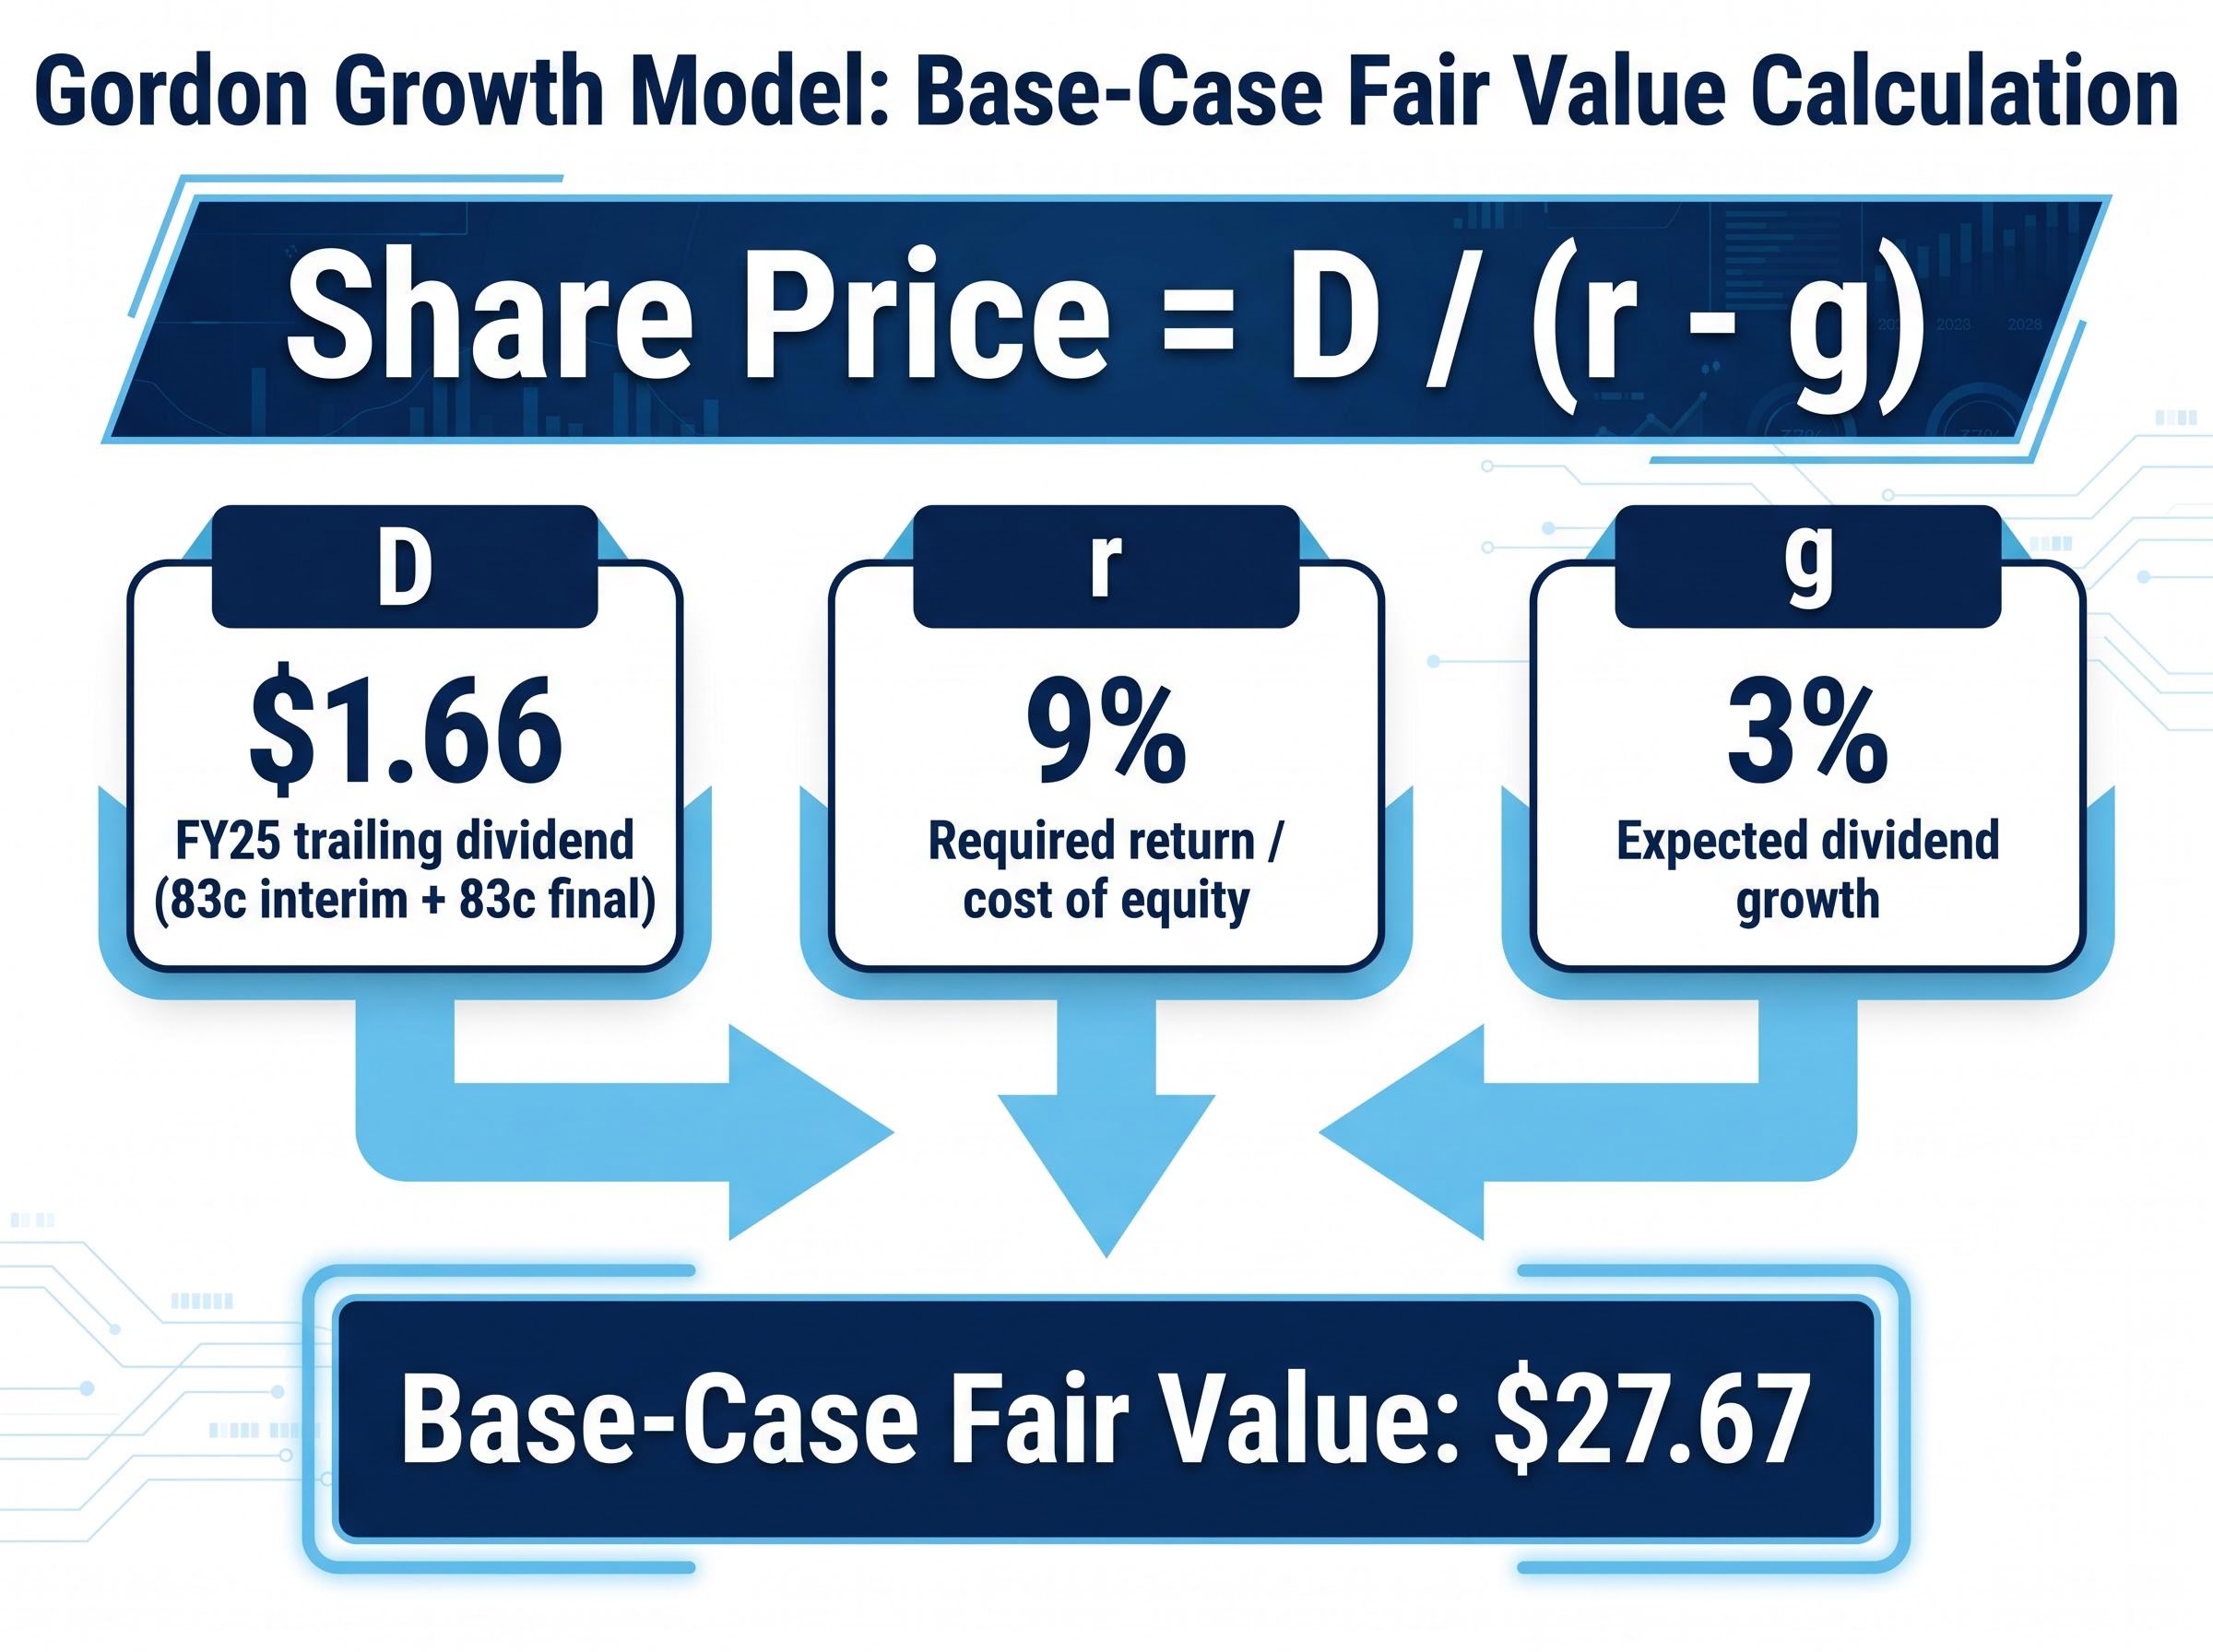
The most common form of the dividend discount model is the Gordon Growth Model, expressed as:
Share Price = D / (r – g)
Where D is the annual dividend per share, r is the required return (discount rate), and g is the expected long-run dividend growth rate.
The formula captures a specific piece of logic. If a company pays a dividend that grows at a constant rate forever, the present value of that infinite stream of payments can be collapsed into a single fraction. The numerator is straightforward: the annual dividend. The denominator is where the judgement lives.
The required return (r) represents the total annual return an investor needs to justify holding the stock instead of a risk-free alternative. For the Big Four banks, Australian analysts commonly apply a cost of equity in the range of 9-10% in the current rate environment. That figure reflects an equity risk premium of roughly 4-4.5% above 10-year Commonwealth government bond yields, according to broker commentary from firms including Macquarie and UBS. Morningstar Australia applies a cost of equity near 9% for the majors.
The expected dividend growth rate (g) captures the long-run annual increase in dividends. For a mature bank like ANZ, a realistic range sits between 2% and 4%. One absolute constraint applies: g must always remain below r. If the growth rate equals or exceeds the discount rate, the denominator collapses to zero or turns negative, producing a nonsensical infinite or negative result. This is not a minor technicality. It is the fault line where the model breaks, and it will reappear in the limitations section below.
The value of the formula becomes concrete only when real numbers go in. The calculation follows four steps:
For a base case, the inputs are:
Base-case fair value = $1.66 / (0.09 – 0.03) = $1.66 / 0.06 = $27.67
That figure sits below ANZ’s current market price of approximately $35.21. On this set of assumptions, the model implies the market is paying a premium to what the dividend stream alone would justify. But the result is only as reliable as the inputs, and even small adjustments produce dramatically different outputs.
Hold the dividend constant at $1.66, raise the discount rate to 11%, and lower the growth assumption to 2%.
Alternative fair value = $1.66 / (0.11 – 0.02) = $1.66 / 0.09 = $18.44
A 2-percentage-point increase in the discount rate alone, combined with a 1-percentage-point reduction in growth, cuts the estimated fair value by roughly one-third. That degree of sensitivity is not a flaw in this particular example. It is a structural feature of the model, and it is precisely why professional analysts never rely on a single calculation.
Rather than anchoring to one output, analysts run the DDM across a grid of growth and discount rate combinations and study the distribution. The spread of outcomes reveals far more than any individual figure.
The matrix below uses ANZ’s annual dividend of $1.66 and tests three growth rate assumptions against four discount rate assumptions.
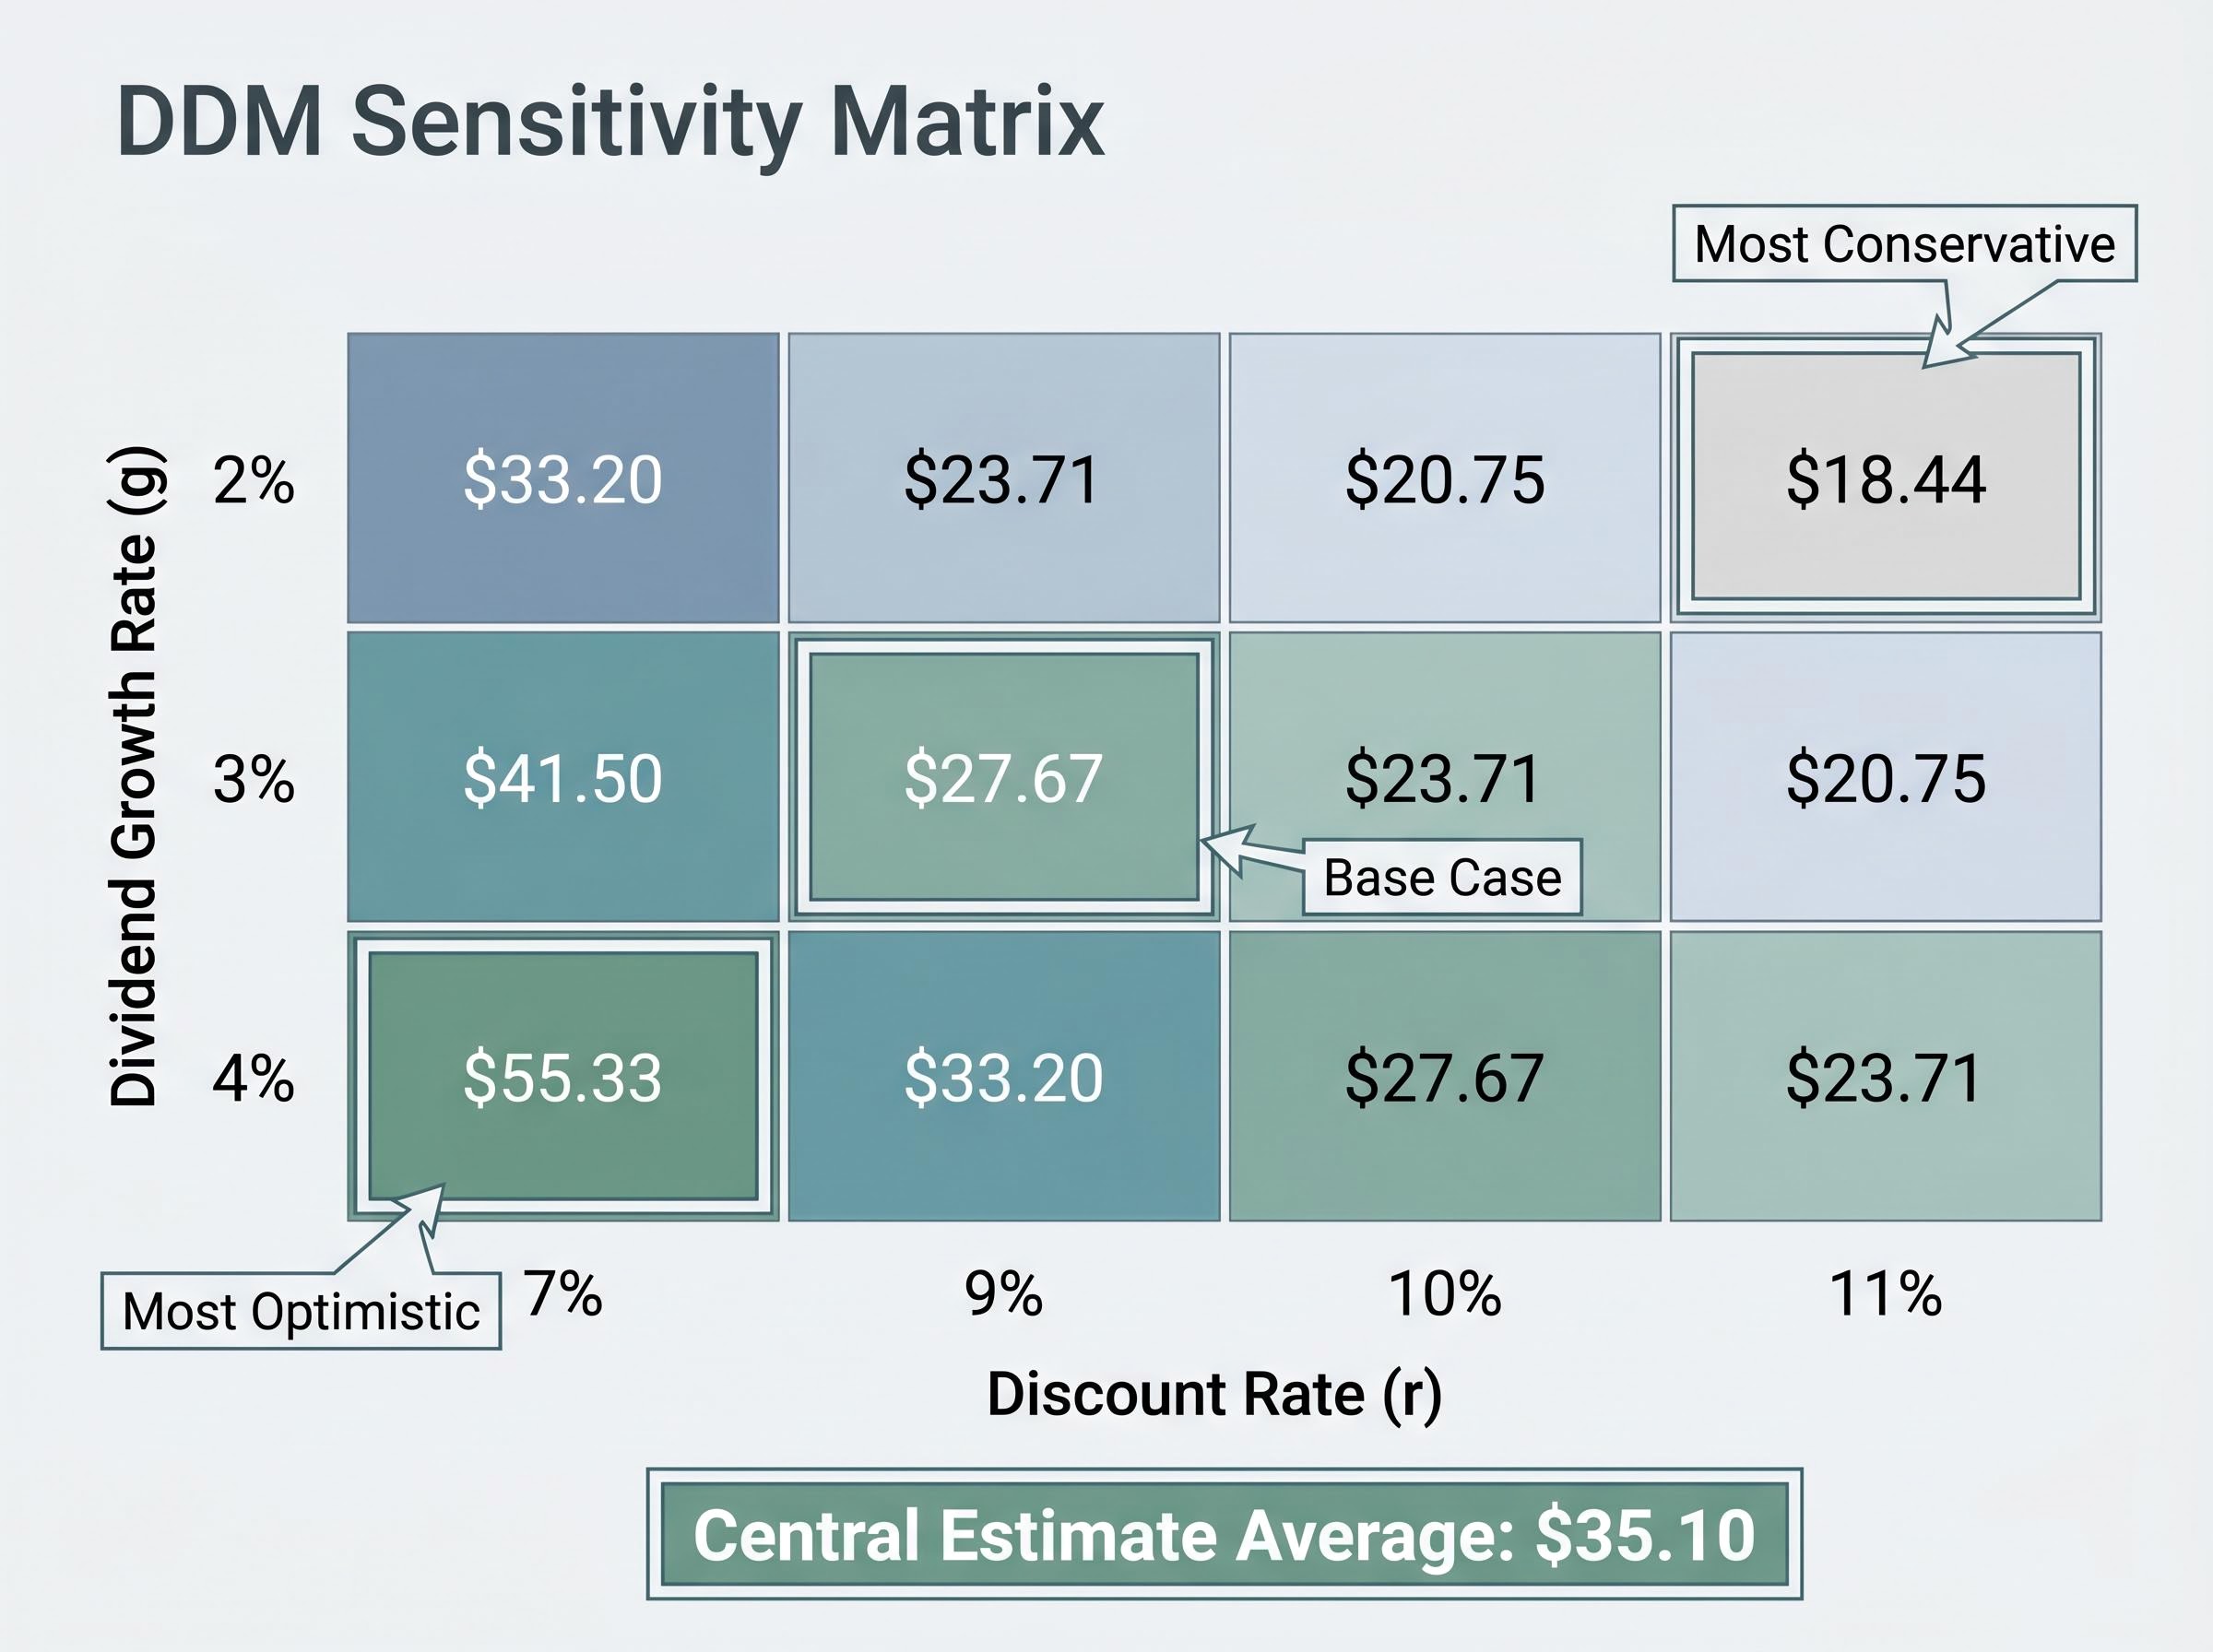
| Dividend Growth Rate | r = 7% | r = 9% | r = 10% | r = 11% |
|---|---|---|---|---|
| g = 2% | $33.20 | $23.71 | $20.75 | $18.44 |
| g = 3% | $41.50 | $27.67 | $23.71 | $20.75 |
| g = 4% | $55.33 | $33.20 | $27.67 | $23.71 |
The range spans from $18.44 at the most conservative combination (2% growth, 11% discount rate) to $55.33 at the most optimistic plausible pairing (4% growth, 7% discount rate). At even lower discount rates, the numbers escalate further: at 4% growth and a 6% discount rate, the formula produces approximately $83.00, a figure that illustrates the model’s explosive sensitivity near the denominator’s lower bound rather than a credible valuation.
Averaged across the central cluster of scenarios in the matrix, the DDM produces a central estimate of approximately $35.10 per share for ANZ.
That figure sits close to the current market price. This does not constitute a buy or sell signal. It reflects, in effect, the market’s own embedded assumptions about ANZ’s dividend growth and appropriate discount rate. Where an investor’s own assumptions diverge from that embedded consensus, the matrix makes the valuation consequences of that divergence visible.
The matrix demonstrates how sensitive the model is to reasonable input variation. But there are conditions under which the DDM does not merely produce a wide range; it produces unreliable outputs altogether.
Three structural failure conditions apply:
CET1 capital buffers directly constrain dividend capacity, and the relationship works in both directions: CBA’s CET1 ratio of 11.6% sitting 110 basis points above APRA’s 10.5% minimum for systemically important banks illustrates how much headroom the majors currently carry above regulatory floors, a surplus that supports near-term payout ratios but can narrow quickly when risk-weighted assets expand.
For these reasons, Morningstar Australia cross-checks DDM outputs against discounted cash flow and residual income models when valuing the Big Four. Total-return models that incorporate both dividend and buyback yield offer another complementary lens, particularly as capital management strategies evolve.
The DDM produces a number. Whether the dividend assumptions embedded in that number are plausible requires qualitative analysis that sits outside any formula. Four ANZ-specific factors warrant scrutiny:
APRA’s capital reform roadmap for ADIs, updated in March 2026, reaffirms that the unquestionably strong capital framework remains a cornerstone requirement for systemically important institutions, with ongoing reforms setting the boundaries within which payout ratios and capital return decisions must operate.
Macroeconomic variables, including housing market conditions, unemployment, and the RBA rate path, feed directly into whether the growth and discount rate assumptions in any DDM scenario are conservative or optimistic. A valuation model applied without this context is arithmetic, not analysis.
The dividend discount model is well-suited to ANZ and the other Big Four banks precisely because of their dividend-paying structure. Its value, however, comes from running a sensitivity matrix rather than trusting a single-point estimate. A central estimate of approximately $35.10 per share emerged from the range tested in this article, broadly consistent with the current market price, but that alignment does not resolve the question of whether ANZ represents an attractive investment.
The model works best as a first filter. Cross-checking against complementary frameworks, including discounted cash flow and residual income models, adds rigour. Qualitative analysis of APRA settings, housing market conditions, and ANZ’s own capital management signals should follow before any investment view is formed.
For readers who want to extend this analysis beyond dividend-based inputs, our full explainer on balance sheet valuation metrics for ASX banks covers NPL ratios, CET1 adequacy, deposit funding composition, and price-to-book multiples across CBA, ANZ, NAB, Westpac, and Macquarie, providing a complementary framework for cross-checking any DDM output against the underlying credit quality of the loan book.
This article is for informational purposes only and should not be considered financial advice. Investors should conduct their own research and consult with financial professionals before making investment decisions. Past performance does not guarantee future results, and financial projections are subject to market conditions and various risk factors.
The dividend discount model values a stock by calculating the present value of all future dividend payments. The most common version, the Gordon Growth Model, uses the formula: share price equals the annual dividend divided by the difference between the required return and the expected dividend growth rate.
Using ANZ's FY25 trailing dividend of $1.66 per share, a 9% discount rate, and a 3% long-run growth assumption, the Gordon Growth Model produces a base-case fair value of approximately $27.67, though the result changes significantly when those inputs are adjusted.
The model is extremely sensitive to small changes in the discount rate and growth rate inputs. For ANZ, varying these assumptions across plausible ranges produces fair value estimates from $18.44 at conservative settings to over $55 at optimistic ones, which is why analysts use a sensitivity matrix rather than a single-point estimate.
The key limitations include the model breaking down when the growth rate approaches the discount rate, its inability to capture capital returned via buybacks rather than dividends, and the risk that dividends are cut or suspended during periods of regulatory capital rebuilding, as occurred during the global financial crisis.
Investors should assess APRA capital requirements, mortgage market margin pressure, ANZ's ongoing technology investment programme, and Reserve Bank of New Zealand capital requirements on its New Zealand operations, as these factors directly influence the dividend growth and payout assumptions underpinning any DDM output.


