
Style Drift: the Silent Risk in Your Active Fund Holdings
1 hr ago

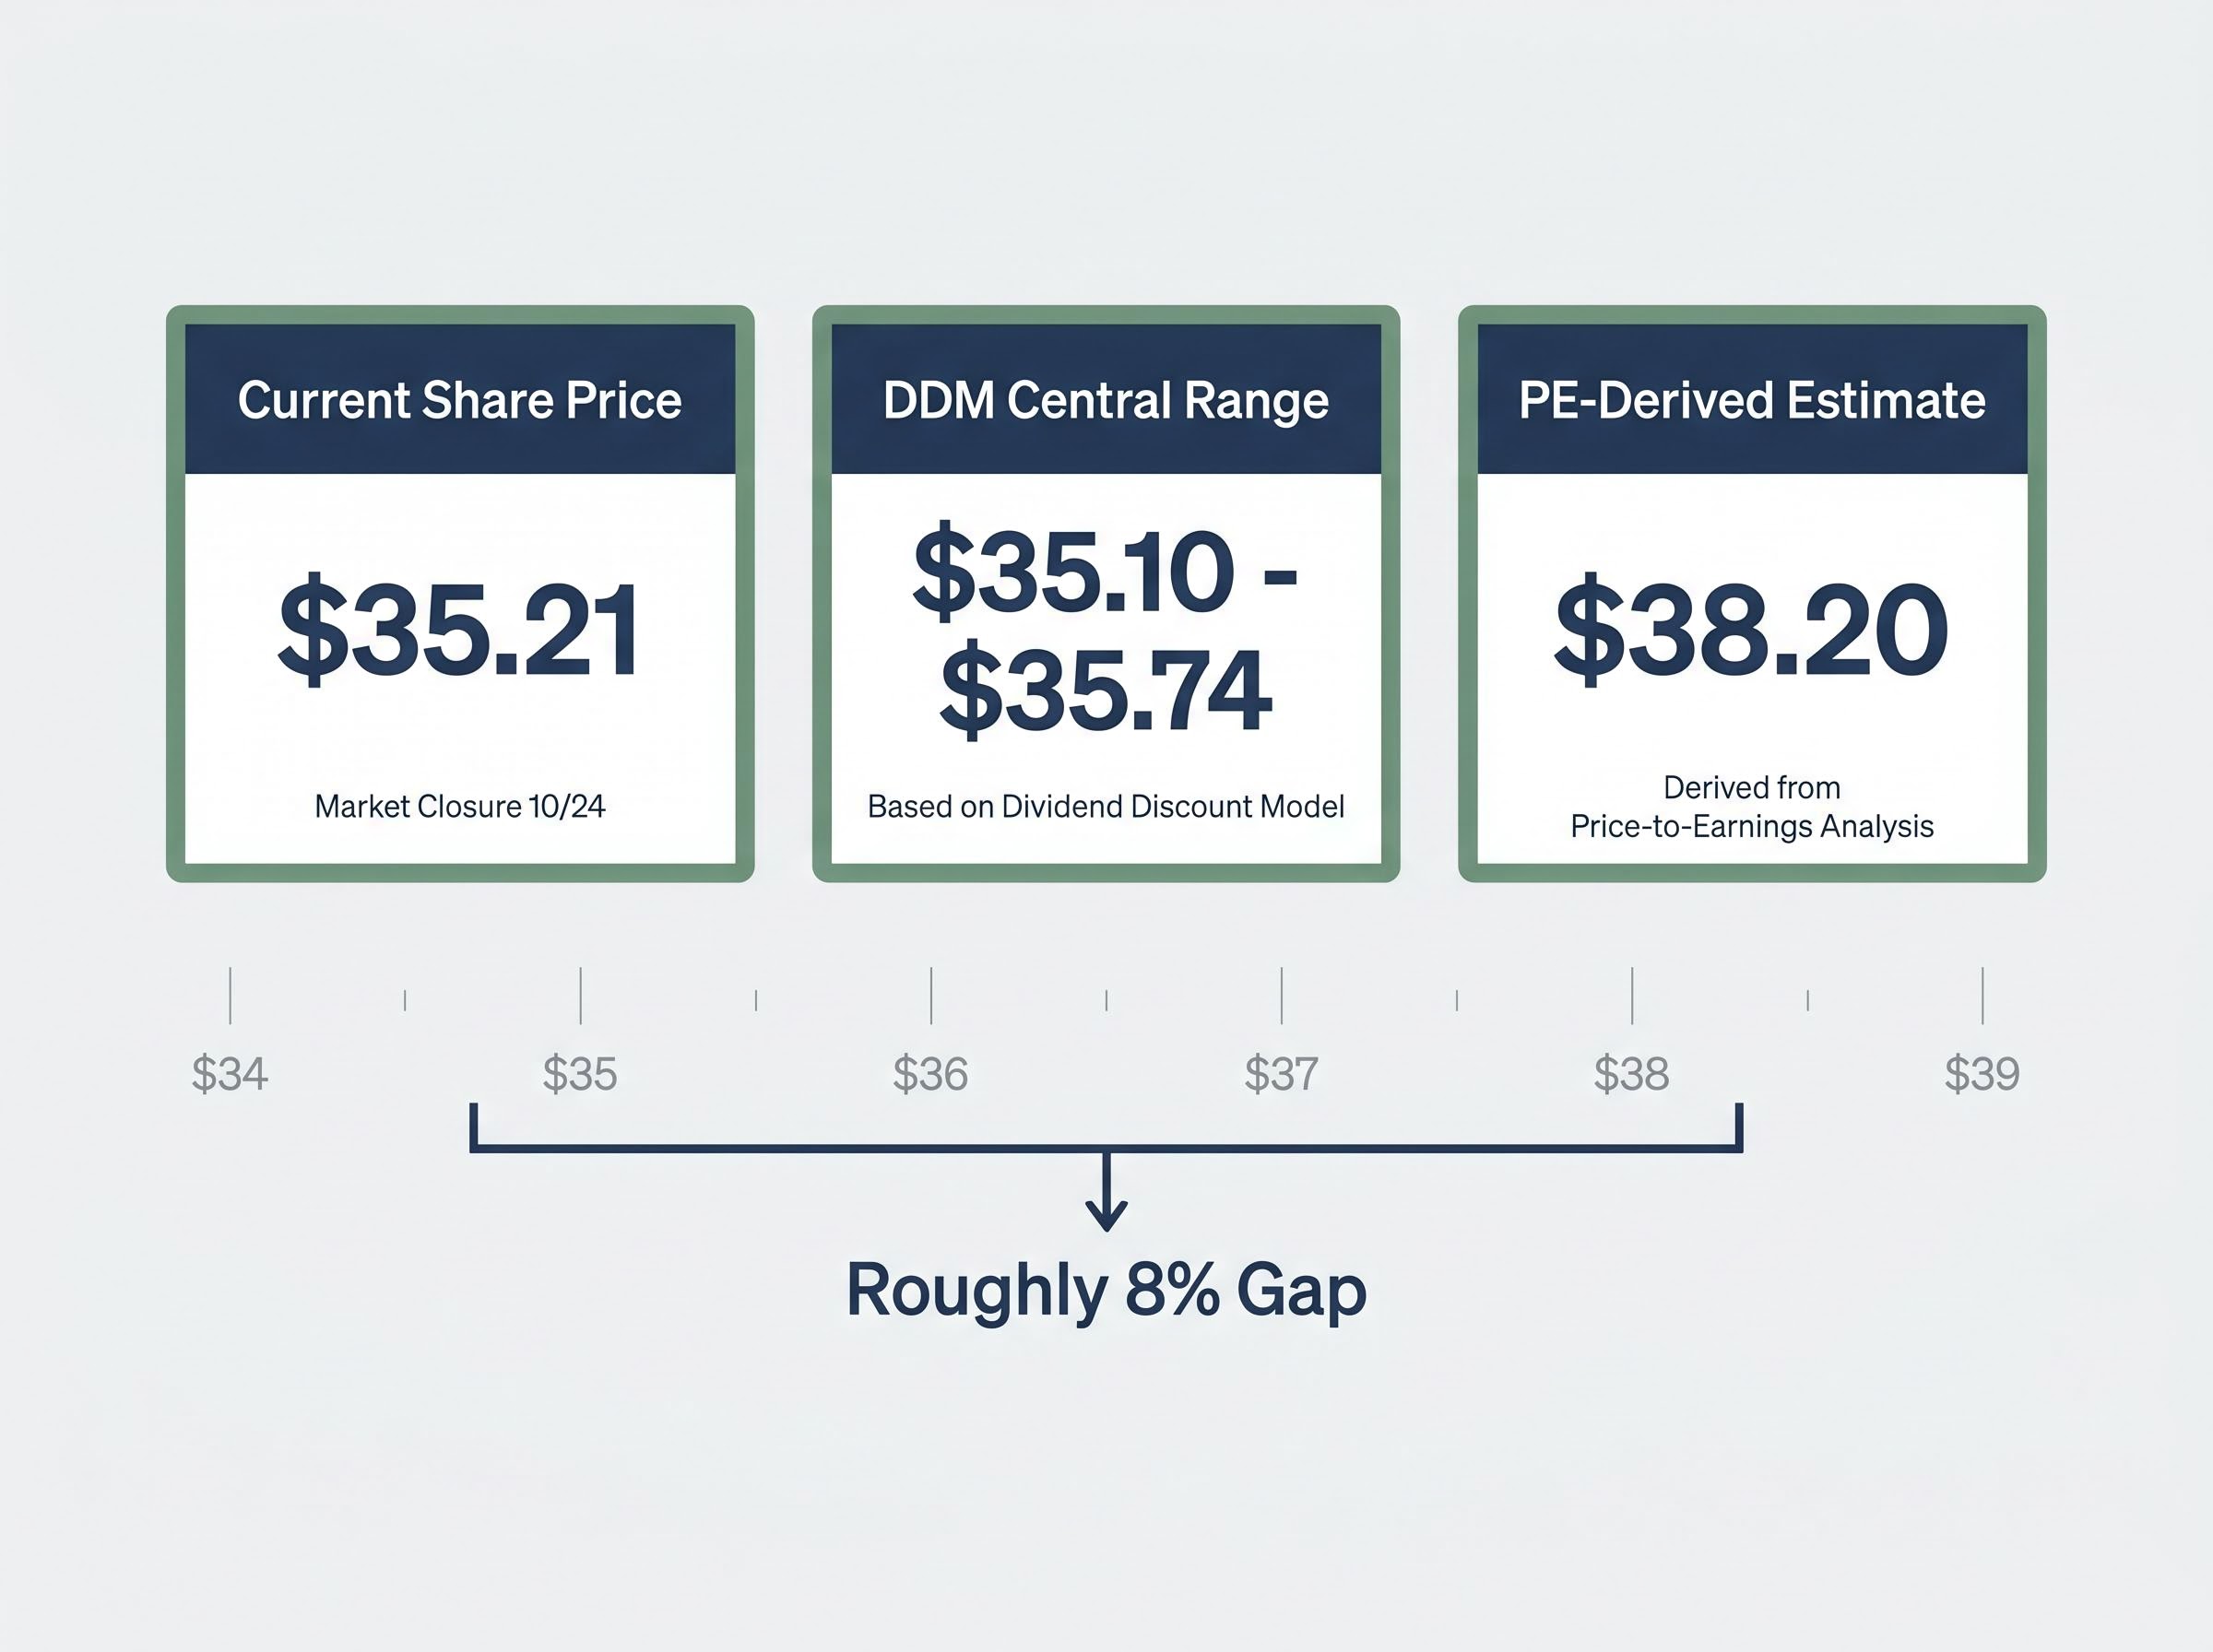
ANZ shares closed the week near $35.21, yet a sector-adjusted price-to-earnings calculation places a fair value estimate closer to $38.20. The gap between those two figures, roughly 8% before dividends, is not large enough to signal a screaming discount, but it is wide enough to warrant a structured look at how the number is derived, what it assumes, and where it might be wrong. With the Suncorp Bank acquisition now fully integrated, the RBA cash rate sitting at 4.35%, and ANZ’s most recent half-year result confirming a “solid but unspectacular” earnings trajectory, the conditions are right for a fresh valuation read. What follows is a step-by-step walkthrough of the PE ratio as a valuation tool for bank shares, applied directly to ANZ’s FY24 financials, then tested against a dividend discount model, so that income-focused Australian investors leave with a framework they can update every reporting season rather than a single price target to anchor on.
The price-to-earnings ratio measures how much investors pay for each dollar of a company’s profit. Take the current share price, divide it by earnings per share, and the result tells you whether the market is pricing those earnings generously or cautiously relative to history or peers.
A lower PE is not automatically a bargain. It can reflect genuine risk, subdued growth expectations, or a temporary distortion in the earnings figure itself. Conversely, a high PE may simply mean the market trusts the company to keep growing.
PE ratio tells you:
PE ratio cannot tell you:
At a share price range of approximately $34.80-$36.00 and FY24 earnings per share of $2.15, ANZ’s trailing PE sits in the region of 16.4x-18.7x depending on the data source and price snapshot used. That range is worth noting honestly; PE is not a single fixed number but a moving target updated with every trade.
Banks generate earnings from regulated lending activities, producing revenue streams that are more predictable across cycles than those of, say, a mining explorer or an early-stage technology company. Australia’s Big Four oligopoly, where ANZ, CBA, NAB, and Westpac collectively dominate the domestic lending market, reinforces this stability. Earnings cycles across the four tend to move in the same direction, which makes cross-peer PE comparison a meaningful exercise rather than a statistical coincidence.
The logic behind a sector-adjusted PE valuation is mean reversion: if a stock trades below the average PE of its closest peers, and its fundamentals are broadly comparable, there is a case that its multiple has room to re-rate toward the group average.
Applying this to ANZ involves three steps:
At a sector-average PE of 18x and FY24 EPS of $2.15, the PE-derived estimate for ANZ is $38.20 per share.
At the $35.21 price used in the source case study, ANZ’s trailing PE sits at approximately 16.4x, implying a discount of roughly $3 per share, or about 8%, to the sector-adjusted estimate.
The table below shows approximate trailing and forward PE multiples across the Big Four:
| Bank | Approximate Trailing PE | Approximate Forward PE |
|---|---|---|
| ANZ | 17.8-18.7x | 13.75-14x |
| CBA | 17-18x | Premium to peers |
| NAB | 17-18x | 13.8-14.8x |
| Westpac | 17-18x | 13.8-14.8x |
This is a replicable method. Each time ANZ reports a new EPS figure, investors can update the calculation with current numbers and see whether the implied gap has widened, narrowed, or closed.
The PE ratio valuation for bank shares follows the same three-step logic regardless of which Big Four stock sits in the denominator: identify the sector-average multiple, source the latest reported EPS, and multiply; the NAB worked example in StockWire X’s education library shows how a $37.37 share price and FY24 cash EPS of $2.292 produce a sector-adjusted estimate of $41.27, the same method applied here to ANZ.
The table above complicates the discount narrative. ANZ’s trailing PE of approximately 17.8-18.7x is not dramatically below NAB or Westpac; all three sit in a broadly similar band. The outlier is CBA, which consistently commands a premium multiple.
APRA quarterly ADI statistics publish the aggregate capital adequacy, return on equity, and asset quality metrics for authorised deposit-taking institutions including the Big Four, providing the official data set against which ANZ’s reported performance can be benchmarked when assessing whether its PE multiple reflects a genuine fundamental gap or accurate peer pricing.
On a forward PE basis, ANZ at approximately 13.75-14x reflects consensus expectations of moderate earnings growth rather than a deep-value signal. The Suncorp Bank integration, completed in July 2024, is now a current operational matter contributing to reported earnings, not a future catalyst waiting to be priced in.
CBA trades at a structural premium for specific reasons:
Comparing ANZ directly to CBA without adjusting for the ROE difference can produce a misleading discount signal. A bank earning a lower return on its equity base should, in theory, trade on a lower multiple. The discount, in this case, may simply be the market pricing fundamentals accurately.
The majority of broker consensus positions ANZ as “Hold” or “Neutral,” implying fair to modestly undervalued rather than a clear buy signal. Target prices generally sit modestly above spot, consistent with mid-single-digit upside expectations.
The dividend discount model (DDM) calculates the present value of a stock based on its expected future dividend payments. The formula divides the annual dividend per share by the difference between a required rate of return and the expected dividend growth rate.
For ANZ, the DDM is a natural companion to the PE ratio. The bank’s fully franked dividends are stable and predictable, making a dividend-based valuation tractable in a way it would not be for a company reinvesting all earnings into growth.
The NYU Stern framework for valuing financial service firms addresses why dividend discount models are particularly suited to banks compared with other valuation approaches, given that regulatory capital constraints make free cash flow estimation unreliable and dividend policy reflects the true distributable earnings capacity of the institution.
Using ANZ’s base annual dividend of $1.66 per share, the sensitivity table below maps DDM outputs across a range of growth and discount rate assumptions:
| Discount Rate | 2% Growth | 3% Growth | 4% Growth |
|---|---|---|---|
| 6% | $41.50 | $55.33 | $83.00 |
| 7% | $33.20 | $41.50 | $55.33 |
| 9% | $23.71 | $27.67 | $33.20 |
| 11% | $18.44 | $20.75 | $23.71 |
The extremes of this matrix produce implausibly high or low figures, which is expected. The central cluster, averaging across the most commonly used discount rates (7-9%) and growth assumptions (2-3%), produces a DDM estimate of approximately $35.10-$35.74 per share.
The wide DDM sensitivity range for ASX bank shares is a feature of the model’s mathematics rather than an error: discount rate and growth rate assumptions compound against each other, so even modest changes in either input shift the output by tens of dollars per share, a property the Bendigo and Adelaide Bank worked example illustrates starkly across the $7.22 to $32.50 range.
That range sits close to the current market price and somewhat below the PE-derived $38.20 estimate. The two methods do not agree precisely, but they converge around the same neighbourhood.
The PE-derived estimate of $38.20 and the DDM central range of $35.10-$35.74 bracket the current share price, suggesting ANZ is trading within a plausible fair value band rather than at a sharp premium or discount.
For Australian investors, particularly SMSF holders, the fully franked nature of ANZ’s dividends amplifies the effective yield through franking credit tax offsets, a factor the DDM captures more directly than the PE ratio.
A Big Four income comparison after franking adjustments shows ANZ carrying the highest confirmed raw yield at 4.58% among the three banks where data was available in late April 2026, grossing up to approximately 5.95% for eligible investors, a figure that meaningfully widens the gap between ANZ and CBA’s grossed-up yield of approximately 4.10% once the franking credit layer is applied.
PE-based valuation is anchored to FY24 earnings. It cannot capture shifts in the outlook driven by forces that have not yet appeared in reported numbers. Five specific factors sit outside what any PE ratio can measure:
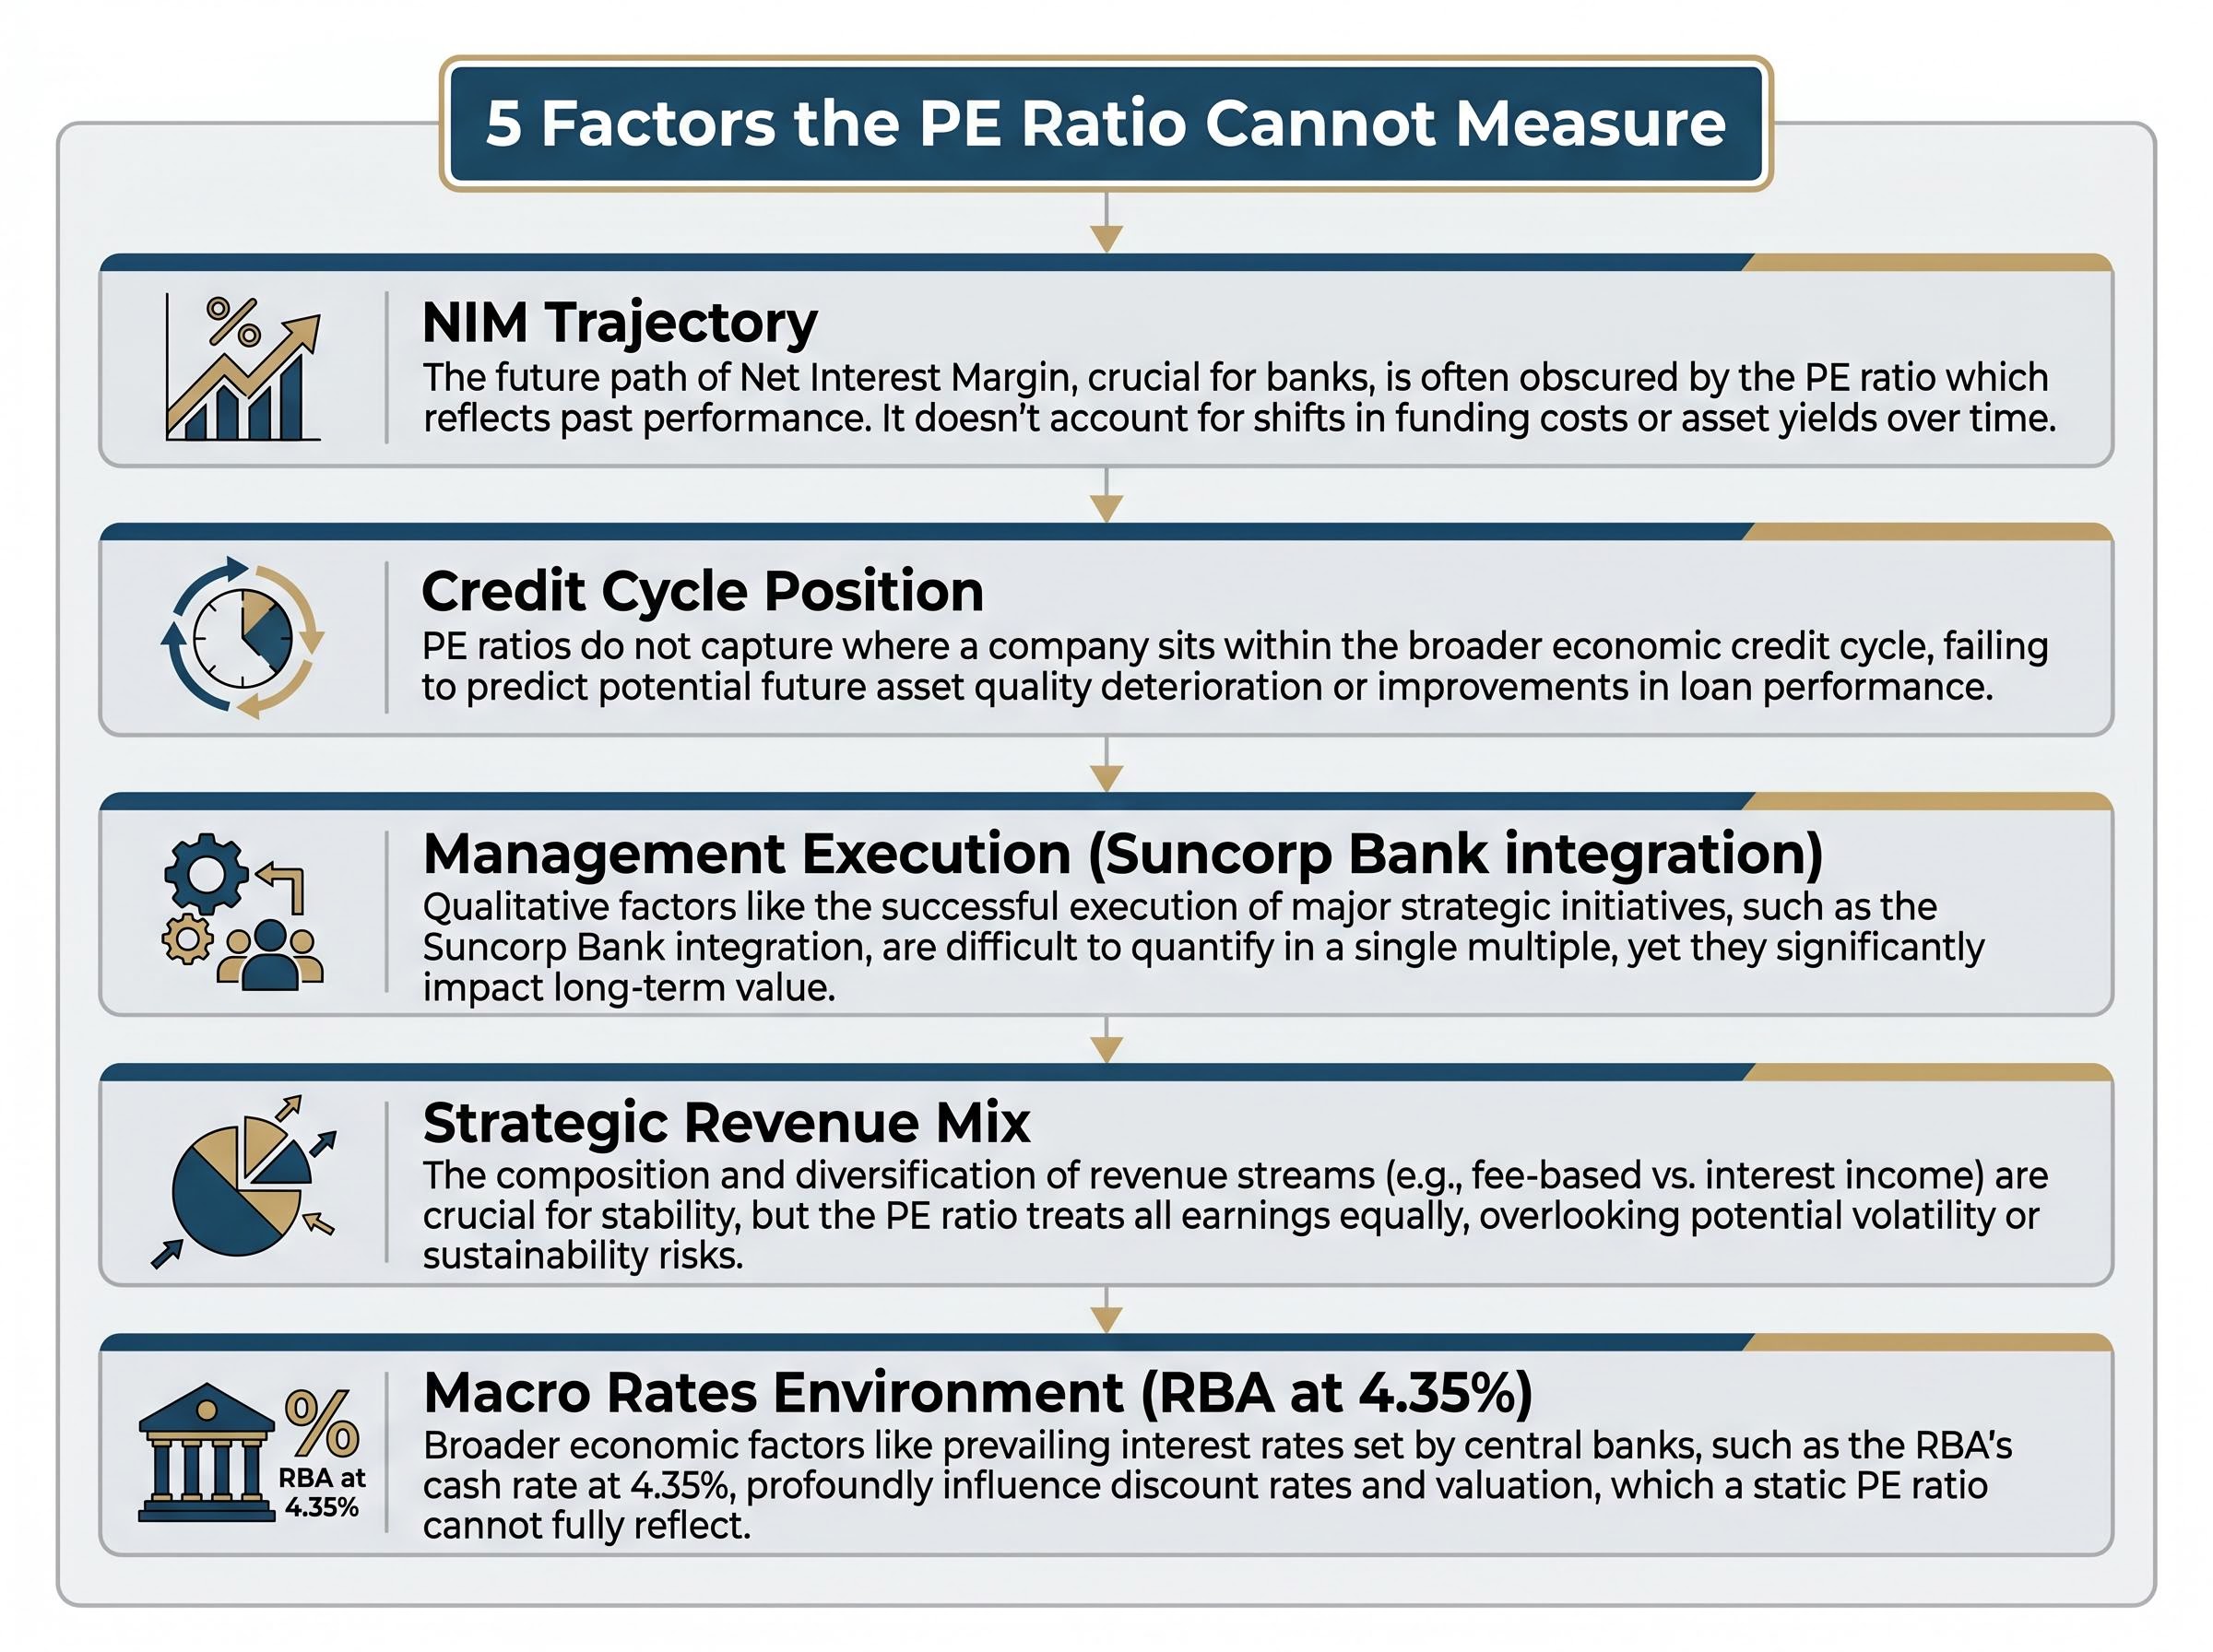
The RBA cash rate remains at 4.35% as of May 2026, with potential for further increases rather than the easing cycle some investors had anticipated. ANZ’s H1 FY25 and H1 FY26 results have been characterised by analysts as “solid but unspectacular,” with NIM compression ongoing and credit quality still benign, though arrears are ticking gradually higher.
Three macro variables connect most directly to ANZ’s earnings path. The unemployment rate, which has edged up from cycle lows but remains historically low, determines borrowers’ capacity to service debt. Residential property prices, which CoreLogic data shows rose modestly through 2024 into early 2025, support credit quality but constrain new mortgage volume growth at current affordability levels. And the RBA’s rate decisions flow directly into NIM calculations and provisioning models.
The macro assumptions driving ASX bank valuations matter more than the choice of model: the same NAB DDM spreadsheet produces a $19.00 floor and an $85.50 ceiling depending entirely on whether unemployment, property prices, and the RBA rate path are set to stress or base-case scenarios, a spread that makes the NAB consensus range from Morgans’ $37.27 sell target to Jefferies’ $50.64 buy target look almost mechanical.
The Global Financial Crisis remains a historical reminder that even well-capitalised banks can face severe stress under extreme conditions. Current conditions are far from that scenario, but the principle holds: ratios derived from a benign earnings period are only as reliable as the stability of that period.
Two independent valuation methods produce estimates in the same general range. The PE-derived figure of $38.20 implies approximately 8% upside from the $35.21 reference price. The DDM central range of $35.10-$35.74 suggests current pricing is broadly fair. Together, they place ANZ within a plausible fair value band rather than at an obvious mispricing.
ANZ’s investment case for Australian income investors rests primarily on fully franked yield and payout stability. The trailing PE is broadly in line with NAB and Westpac, which means the opportunity is less about a dramatic PE-discount re-rating and more about steady income collection while the share price oscillates within a reasonable valuation range.
The majority broker consensus of “Hold/Neutral” aligns with this picture: fair to modestly undervalued, subject to the NIM and credit-cycle risks identified above. For SMSF investors, franking credits amplify the effective after-tax yield, adding a layer of return not visible in the headline dividend figure.
Three conditions would cause the valuation picture to shift materially:
ANZ is not obviously cheap on a trailing PE basis relative to NAB or Westpac, but the convergence of two valuation methods around the high-$30s suggests current pricing sits within a reasonable fair value band for a patient income investor.
This article is for informational purposes only and should not be considered financial advice. Investors should conduct their own research and consult with financial professionals before making investment decisions. Past performance does not guarantee future results. Financial projections are subject to market conditions and various risk factors.
The PE and DDM methods explored here are starting points, not conclusions. They frame a question: is ANZ trading at a price consistent with its earnings power and dividend capacity? The evidence from both models suggests it is, with modest room for upside if the sector multiple holds and earnings remain stable.
The framework becomes more useful with repetition. Each time ANZ reports a half-year result, a new EPS figure arrives, and the PE calculation updates in seconds. Each time the RBA moves, the DDM discount rate shifts, and the sensitivity table recalibrates. Investors who treat these models as living tools, refreshed at every reporting season, will spot changes in the valuation picture earlier than those waiting for a broker note.
The next data point that matters most is not another ratio. It is whether the RBA’s rate posture shifts or whether credit quality deteriorates in a way that flows through to EPS and dividend assumptions. Either would change the inputs, and the inputs are where every valuation framework lives or fails.
A sector-adjusted PE ratio uses the average price-to-earnings multiple of a stock's closest peers as a benchmark, then multiplies that figure by the company's latest earnings per share to estimate fair value. For ANZ, applying the Big Four sector average PE of 18x to FY24 EPS of $2.15 produces a fair value estimate of approximately $38.20 per share.
Using ANZ's base annual dividend of $1.66 per share, the DDM central range across the most commonly used discount rates of 7-9% and growth assumptions of 2-3% produces an estimate of approximately $35.10-$35.74 per share, somewhat below the PE-derived $38.20 but broadly consistent with current market pricing.
Three conditions would cause the valuation picture to shift materially: a deterioration in credit quality visible through rising arrears and impairment charges, a sustained fall in EPS below $2.00 compressing the PE-derived estimate, or a sector-wide de-rating driven by prolonged net interest margin compression forcing all Big Four multiples lower.
ANZ's fully franked dividends carry tax credits representing company tax already paid, which eligible investors can use to offset their own tax liability. Based on a confirmed raw yield of 4.58%, the grossed-up yield for eligible investors rises to approximately 5.95%, a meaningful uplift compared to CBA's grossed-up yield of approximately 4.10%.
Each time ANZ reports a new half-year result, investors can take the updated earnings per share figure, multiply it by the prevailing Big Four sector-average PE multiple, and produce a refreshed fair value estimate in seconds, making the three-step method a repeatable tool rather than a static price target.


