Macquarie Group has surged 19.4% since the start of 2025, yet its current dividend yield of approximately 2.63% sits meaningfully below its five-year historical average of 3.16%. That gap typically prompts the question every investor evaluating the stock eventually reaches: has the market already priced in the good news?
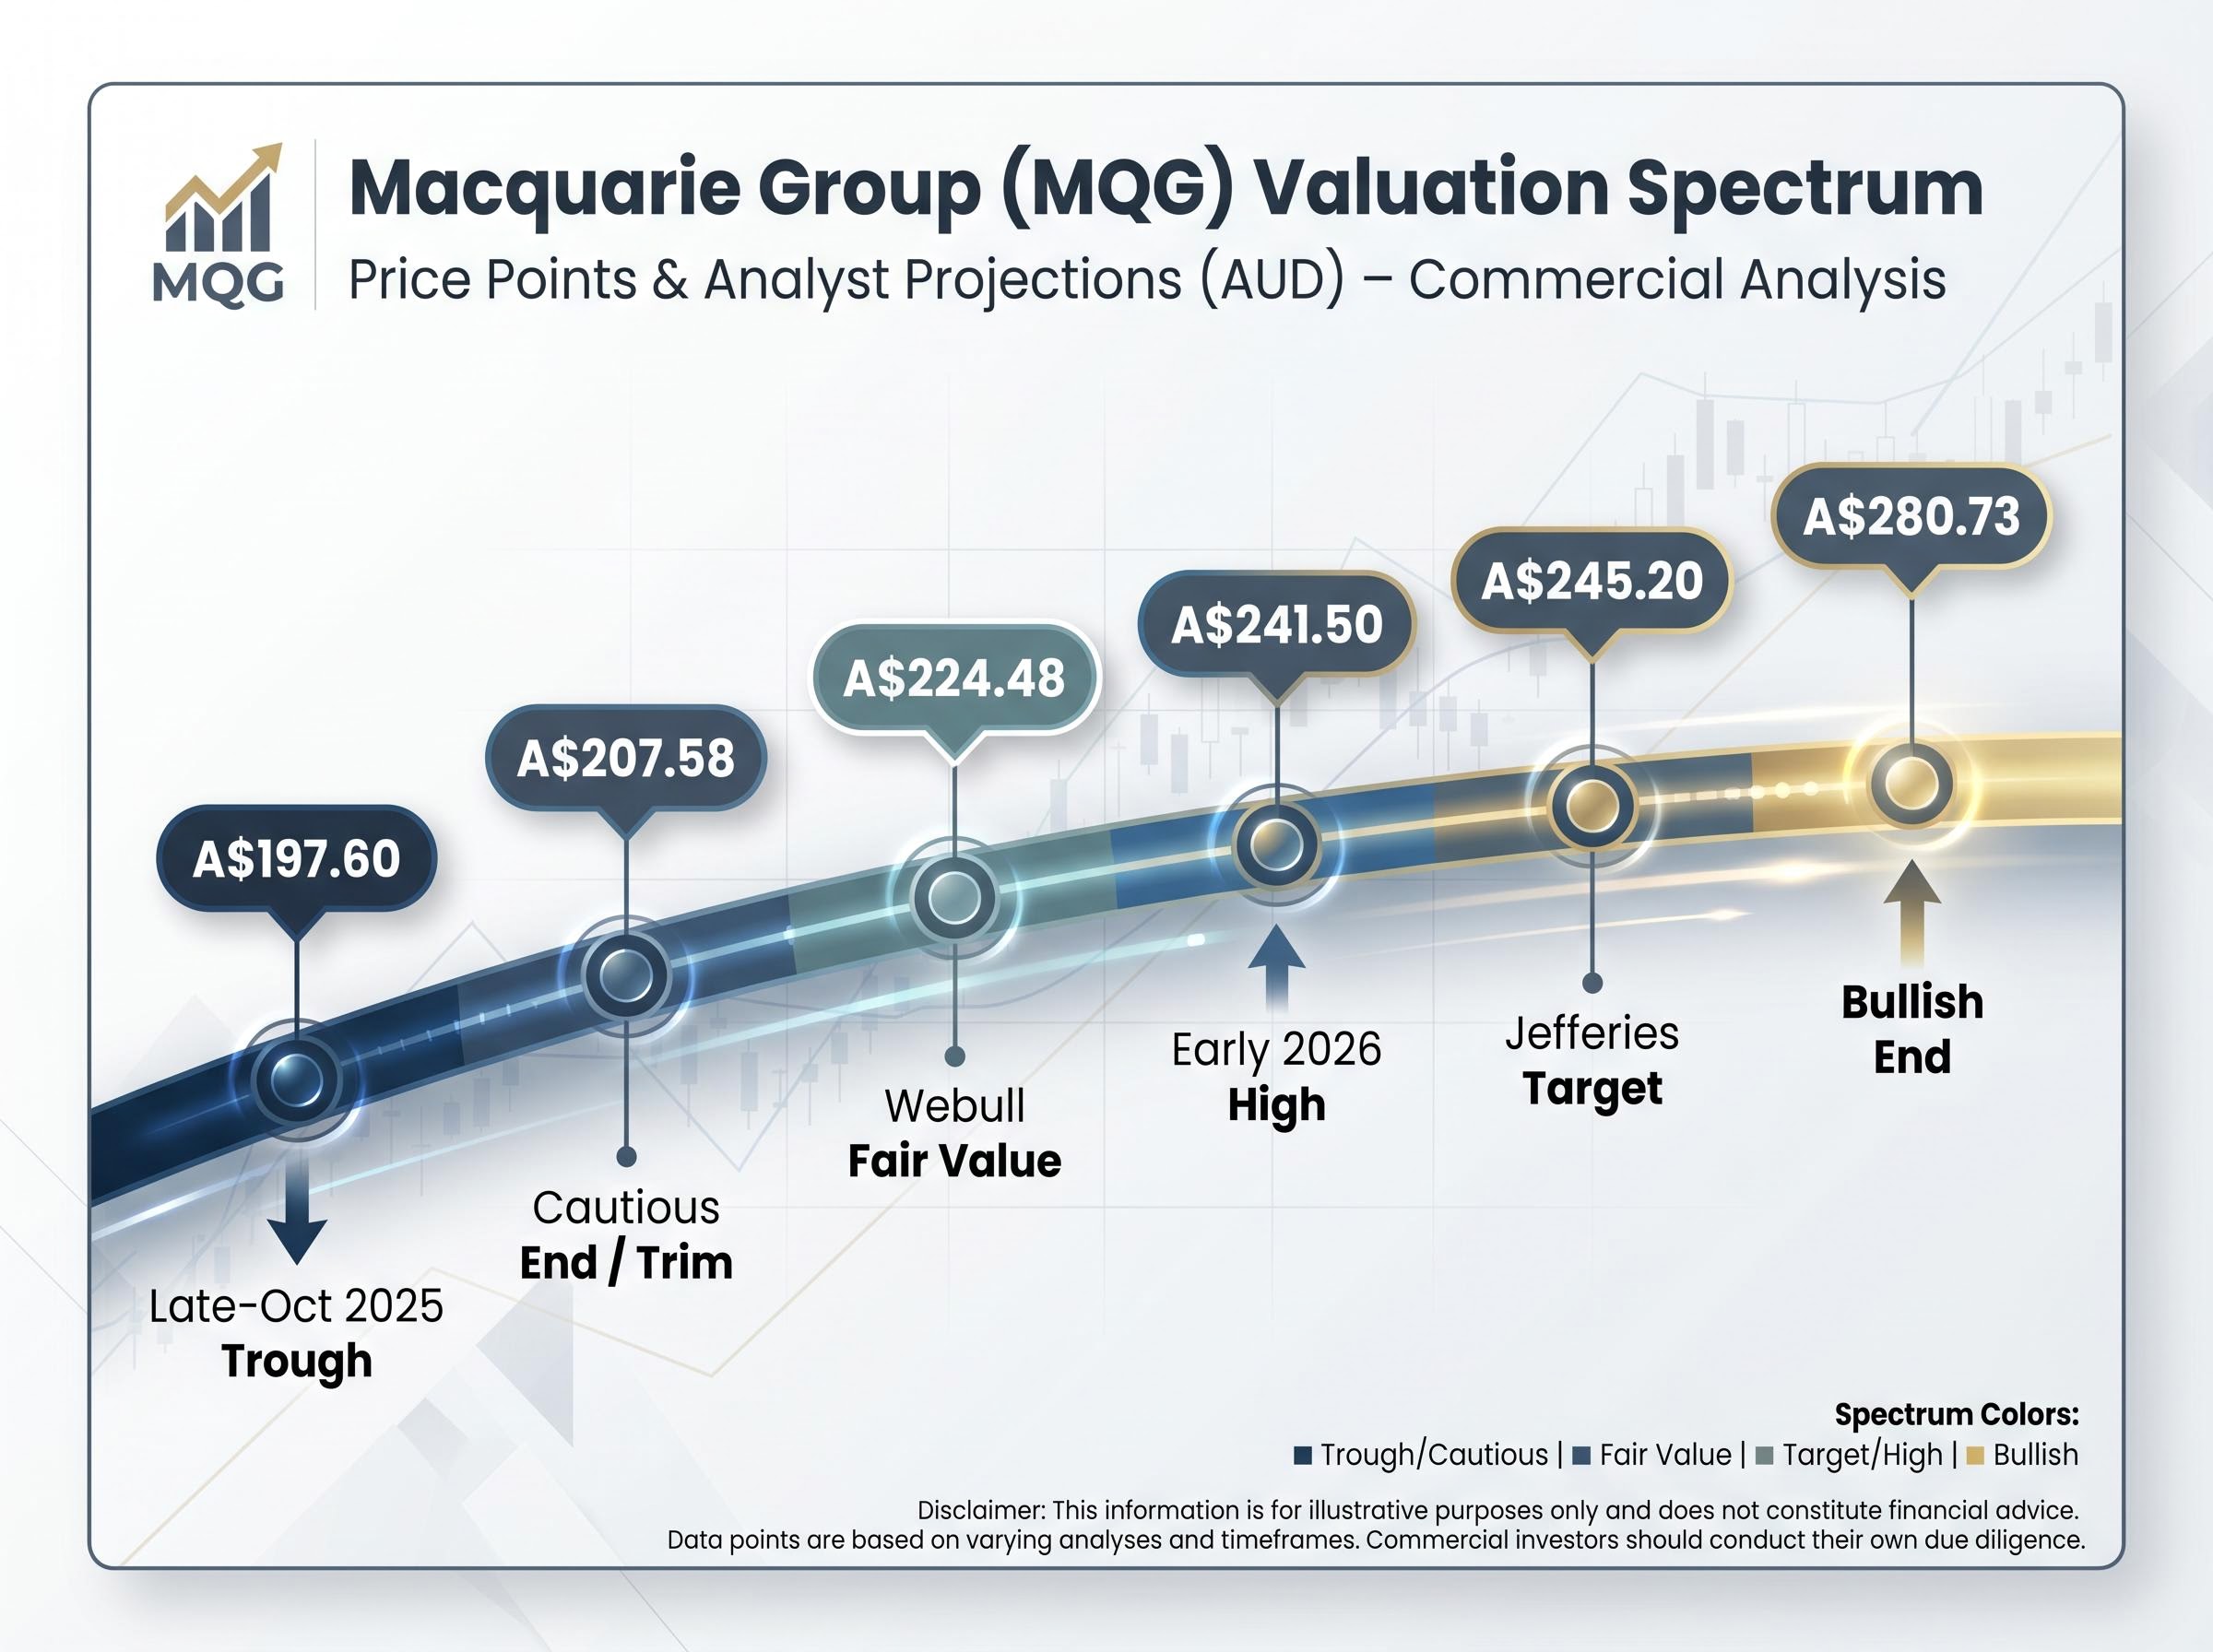
As of 14 May 2026, MQG trades in a range where analyst price targets span from A$207.58 on the cautious end to A$280.73 on the bullish end, a spread reflecting genuine disagreement about how to value a business that does not behave like a traditional bank. With a major asset sale to a BlackRock/Microsoft/Nvidia consortium expected to close in H1 2026 and earnings growth forecast at roughly 5.9% per annum, the valuation question is live and consequential.
What follows works through what the dividend yield signal is actually telling investors, why Macquarie’s structure makes standard bank valuation metrics unreliable, what the forward catalysts and risk factors look like at current prices, and how to think about entry timing.
What the 19% rally actually looks like in context
The headline figure is striking: a 19.4% gain from early 2025 through to the A$241.50 high reached in early 2026. For investors who bought near the A$197.60 late-October trough, the recovery has been material.
The multi-timeframe picture complicates that story:
- YTD 2025 gain: +19.4%
- 1-year return: -8.9%
- 3-month return: -11.2%
- 5-year return: +68.4%
- Post-1H FY26 results decline: 5-10%
The 5-year return of +68.4% remains the structural outperformance baseline, distinguishing MQG from the major bank peer group over a full cycle.
The 19.4% surge did not happen in isolation. It followed a slide to A$214.15 by July 2025 and a further fall to approximately A$197.60 by late October 2025. The rally, measured from its lowest point, looks more like a recovery to prior levels than a breakout into new territory.
The broader ASX bank sector rally in early 2026 created a context in which MQG’s 19.4% gain looks less exceptional than the headline suggests; across the Big Four, price momentum and analyst valuation targets have diverged sharply, with unanimous sell ratings on CBA despite its continued outperformance, a dynamic that has made stock selection within financials more consequential than broad sector allocation.
After 1H FY26 results landed, the share price fell 5-10%, suggesting the market tested the rally’s durability and found it conditional. The question for investors considering entry now is whether the current price reflects a recovery to fair value or an overshoot that borrowed from future returns.
When big ASX news breaks, our subscribers know first
Why Macquarie cannot be valued like the big four banks
Much of the disagreement in analyst price targets traces back to a structural problem: Macquarie Group is not a bank in the way CBA, NAB, or Westpac are banks. Screening it against big-four yield or price-to-book benchmarks produces misleading answers.
The business combines a regulated banking division with a global asset management and advisory operation spanning:
- Infrastructure
- Commodities
- Agriculture
- Real estate
- Global equities
This mix places Macquarie structurally closer to a global alternatives manager than a domestic retail lender.
A large share of earnings comes from performance fees, capital recycling, and asset sales rather than net interest margin. That distinction matters because these revenue sources are inherently lumpier and more cyclical. In 1H FY26, the Asset Management and Banking divisions performed strongly while the Commodities division delivered weaker results, illustrating how different parts of the business can move in opposite directions within the same reporting period.
Q3 FY26 trading conditions provided early confirmation of the divisional recovery thesis, with asset divestment gains and organic AUM growth lifting Macquarie Asset Management while Banking and Financial Services posted deposit and home loan market share gains of 6% and 7% respectively, despite ongoing margin compression.
Management has been deliberately shifting toward recurring revenue streams in asset management and retail banking, reducing dependence on commodities-driven earnings. Over 55 years of continuous profitability suggests the model works across cycles, even if individual periods produce uneven results.
With a total equity base of A$35.8 billion (FY25) and a debt/equity ratio of 258.5%, the balance sheet carries a leverage profile that would alarm investors applying traditional banking metrics. For a capital-intensive asset management model, the leverage serves a different function, though it introduces its own risks.
What dividend yield compression is signalling at current prices
A dividend yield sitting below its historical average can result from three causes: the share price rising faster than dividends, dividends being cut, or both. Identifying which force is dominant determines whether the signal points to overvaluation or simply reflects re-rating.
In Macquarie’s case, the compression is primarily price-driven. The share price rally has pushed the yield denominator higher. However, the most recent annual dividend also came in below the three-year average, adding a secondary layer: the numerator has softened as well.
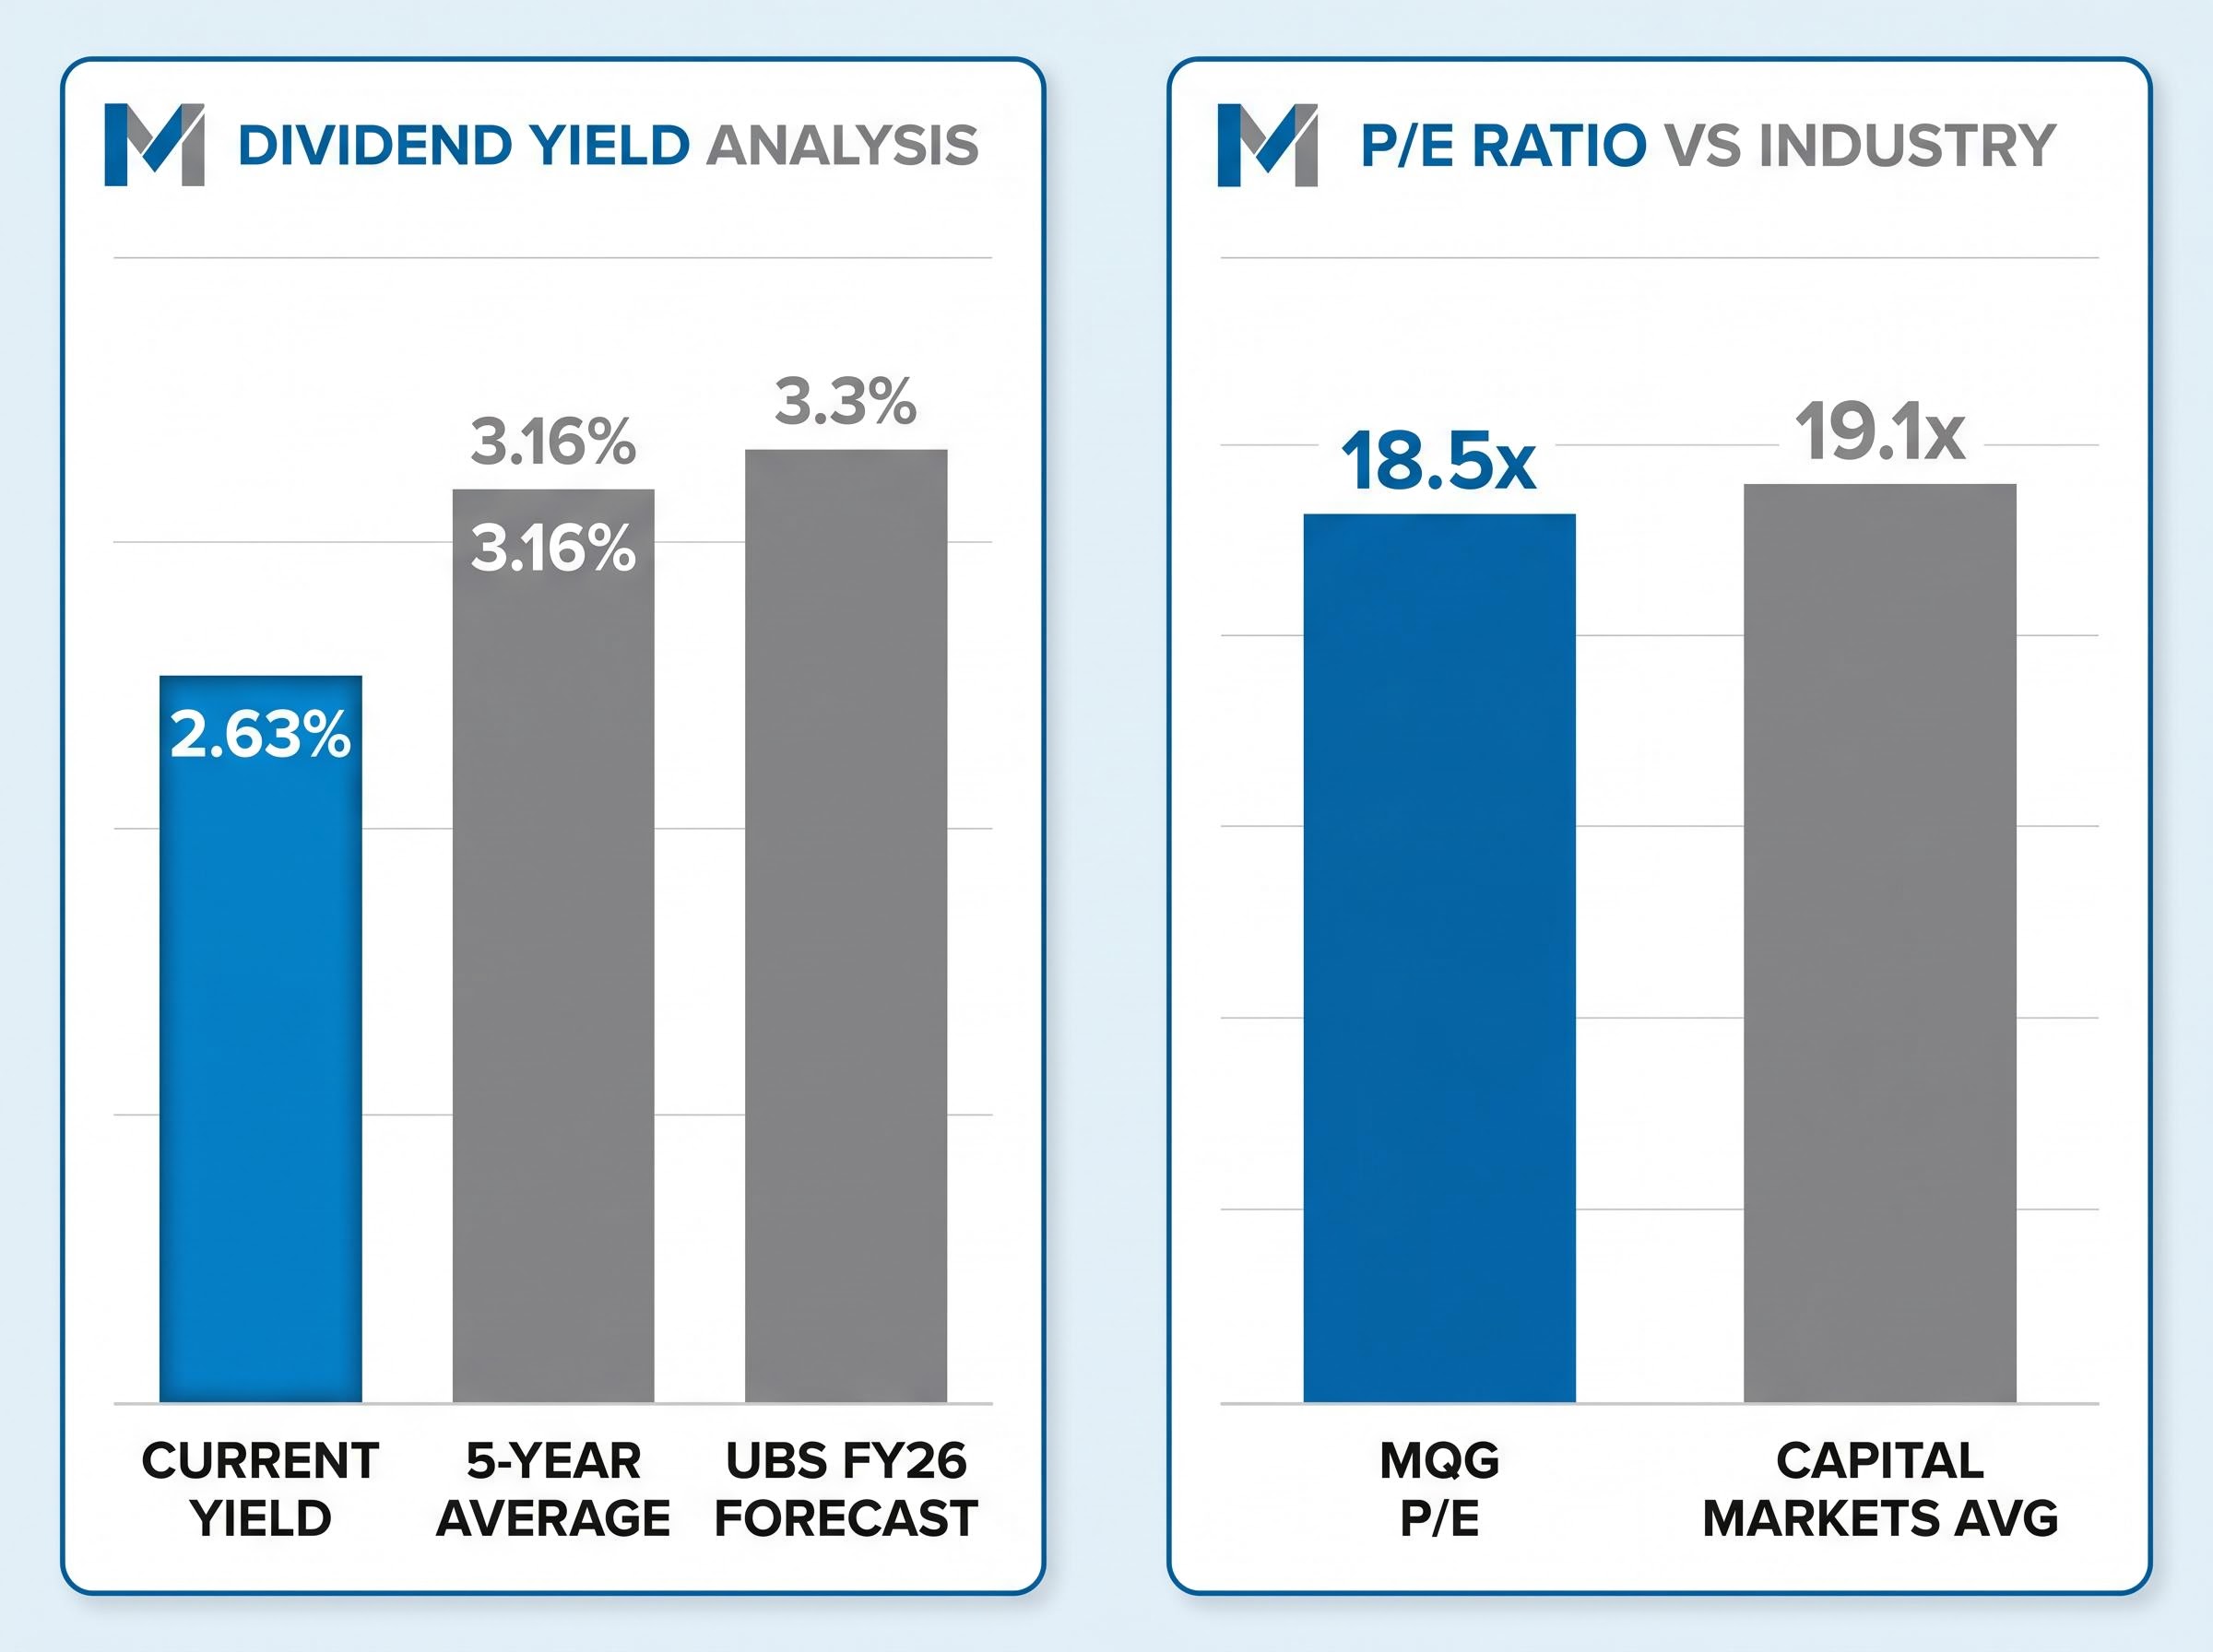
Current yield of approximately 2.63% versus the five-year average of 3.16% represents a gap that warrants attention but not, on its own, a conclusion.
| Metric | Current | 5-Year Average |
|---|---|---|
| Dividend yield | ~2.63% | 3.16% |
| P/E ratio | 18.5x | Capital Markets industry avg: 19.1x |
The P/E of 18.5x sits below the Capital Markets industry average of 19.1x, suggesting the stock is not expensive on an earnings multiple basis even as the yield signal flashes caution. UBS forecasts the yield recovering to 3.3% by FY26, which would narrow the gap if earnings growth materialises as expected.
Whether an investor anchors to today’s compressed yield or the forward yield estimate changes the valuation reading considerably. Dividend yield is one of the most accessible screening tools for ASX investors, but for a stock like MQG, it tells only part of the story.
Investors wanting to build a more systematic framework around the yield compression signal will find our dedicated guide to dividend yield as a valuation signal, which walks through the mechanics of yield mean reversion, how to set a historical baseline, and why the gap between trailing yield and bond yields changes the risk premium calculus for ASX blue-chips like MQG.
The forward catalysts that justify (or challenge) current pricing
Three specific catalysts underpin the bullish case at current prices, ranked by near-term materiality:
- Aligned Data Centers sale: The agreement to sell to a BlackRock/Microsoft/Nvidia consortium at approximately US$40 billion valuation is expected to close in H1 2026. Completion would validate Macquarie’s origination capability in AI and cloud infrastructure assets and is expected to boost performance fees.
- Earnings growth trajectory: Forecasts point to 5.92% per annum earnings growth and 5.3% revenue growth over the next three years, providing the structural underpinning for re-rating.
- Infrastructure and AI tailwinds: Global data centre and infrastructure investment cycles continue to support Macquarie’s asset management pipeline.
The FY26 full-year result, delivered in May 2026, provided the clearest test of whether the earnings growth trajectory underpinning the bullish case was materialising: net profit reached A$4.85 billion, up 30% on FY25, with all four operating divisions posting double-digit growth and return on equity recovering from 11.2% to 14.0%.
The counterweight is near-term earnings softness. UBS flags a possible earnings trough before the recovery trajectory to FY30 materialises, and Goldman Sachs has downgraded the stock as a cautious signal.
| Broker | Rating | Price Target | Key Rationale |
|---|---|---|---|
| Jefferies | Buy | A$245.20 | Stabilising divisions; growth optionality |
| UBS | Neutral | ~9% implied upside | Near-term earnings trough; FY26 yield recovery to 3.3% |
| Goldman Sachs | Downgrade | Not specified | Cautious on near-term outlook |
| Simply Wall St | Bullish | A$280.73 (high); A$207.58 (trim) | P/E below industry; good value vs. peers |
The spread between A$207.58 and A$280.73 quantifies the debate. The Aligned Data Centers close is the most likely event to narrow that gap, making the next three to six months a live decision window.
Risks that current pricing may not fully reflect
The bullish analyst consensus does not mean the risks are small or distant. Three factors deserve direct scrutiny at current prices.
Debt/equity ratio: 258.5%. This level of leverage means earnings and equity value are materially sensitive to interest rate movements and credit conditions.
- Structural leverage: The 258.5% debt/equity ratio is not a temporary phase. It reflects Macquarie’s capital-intensive model. While the leverage serves the asset management strategy, it amplifies downside sensitivity to rising rates or tightening credit conditions.
- Earnings cyclicality: The Commodities division’s weaker 1H FY26 performance alongside stronger Asset Management and Banking results illustrates a recurring pattern. Result volatility from the commodities side can offset gains elsewhere in any given period.
- Post-results price weakness: The 5-10% share price decline following 1H FY26 results, which showed net profit of A$1.65 billion (up approximately 3% year-on-year, in line with expectations but not a beat), demonstrates that the market has not been uniformly rewarding earnings at current levels.
APRA’s APS 110 capital adequacy standard sets the minimum CET1, Tier 1, and total capital ratios that Macquarie Bank Limited must maintain as an authorised deposit-taking institution, meaning the leverage profile that appears alarming under traditional bank screening is assessed by regulators against a separate prudential framework designed for capital-intensive financial groups.
The Intelligent Investor (April 2025) flagged an increase in overall risk assessment for the stock. With a profit margin of approximately 18%, the business generates adequate returns, but the leverage profile means the risk-reward calculation at current prices is more sensitive to macro conditions than headline growth forecasts suggest.
Putting yield, price targets, and catalysts together before deciding
No single metric resolves the valuation question for a business as structurally complex as Macquarie Group. The role of dividend yield, P/E, and analyst targets is to define the range of plausible outcomes rather than pick a number.
A practical framework for investors evaluating entry:
- Assess the yield signal against the historical average. The current ~2.63% versus 3.16% five-year average flags that the share price has run ahead of dividends, but UBS’s 3.3% FY26 forecast suggests potential convergence.
- Review forward earnings forecasts and the analyst target range. The A$207.58 to A$280.73 spread defines the boundaries. A narrative fair value estimate from Webull of A$224.48 sits in the lower half of that range.
- Apply a discounted cash flow (DCF) or Dividend Discount Model (DDM) to stress-test assumptions. Using the 5.92% per annum earnings growth as a baseline input, investors can model how sensitive the valuation is to changes in growth rates, discount rates, or terminal assumptions.
StockInvest.us, as of 25 July 2025, forecast a 14.06% rise to the A$244-269 range from a base of A$214.15 within three months, with 90% probability assigned. These short-term forecasts carry their own limitations but illustrate the directional consensus among growth-oriented models.
The Aligned Data Centers close remains the near-term binary event. Investors who want exposure before the catalyst realises need to accept current pricing. Those who prefer confirmed earnings uplift may choose to wait for post-close results.
MQG at 19% above its 2025 starting price: premium earned or premium borrowed?
The dividend yield compression and post-results price weakness both suggest the market has priced in a significant portion of near-term good news. The Aligned Data Centers close and the multi-year earnings growth trajectory mean the stock is not clearly overvalued by conventional measures, but nor does it offer the margin of safety that characterised the late-October 2025 entry point.
What distinguishes a reasonable entry from a speculative one at current prices is evidence of earnings quality improvement and proximity to the A$207-224 range identified by cautious and fair-value analysts.
The H1 2026 asset sale close is the next material data point. Its completion, or delay, will likely narrow the spread between A$207.58 and A$280.73, giving investors a clearer signal on whether this premium was earned or borrowed.
This article is for informational purposes only and should not be considered financial advice. Investors should conduct their own research and consult with financial professionals before making investment decisions. Past performance does not guarantee future results. Financial projections are subject to market conditions and various risk factors.